Code review can rate computational and module complexity, provide maintainability index and summarize SQL complexity.
I recently did one of my Lunch N Learn webinars (Mondays at 12:15…see my website to get on the list for these…and to see the replay) on this Toad Code Review. Goes without saying that I just love this feature.
IF I were regularly programming, I’d definitely attach one of these code review reports (see below) to my completed work. This will show that my code is clean and complies with the rules setup in this area of Toad (the rules are easily visible and adjustable).
Code review report: 4 main areas to take notice
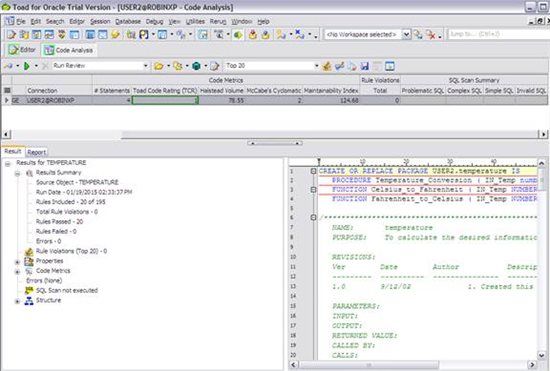
This code review report shows four main areas across the top of the interface I would like as a manager:
- Halstead Volume – a rating of computational complexity
- McCabes Cyclomatic – a rating of overall module complexity
- Maintainability Index – a simple scale of maintainable code
- SQL Scan summary – SQL complexity has 4 areas:
- Problematic SQL
- Complex SQL
- Simple SQL
- Invalid SQL
Managers, programmers and potential users will find value in code review
A manager can use this simple scale when assigning resources to the project and to quickly see the status of a current project or an overall rating of a completed project.
Programmers can use this same code review information to make a baseline of the status of code they are about to start on to be compared with the same report items once the project is complete. This information can be used to help programmers make sure they don’t miss any bad or invalid code.
People evaluating software packages based in Oracle code can use this as another metric to compare the code among the solutions being considered.
Get started with Code Review
To use: Database > Diagnose > Code Review.
Open the code from the file system or from the database. The green button to the left of the open buttons runs the analysis on the selected items. To the right of the open buttons are the rule buttons…shows the rules being used and allowing the rules to be edited. The output report can be saved.
My recommendation is for programmers to submit this final report with their completed project.
The main interface allows you to open and analyze individual program units or packages. You can open a variety of program units but the Report (on the Report tab, lower left panel) will be more general.
When these reports are run against single program units or single packages, the report contains a considerable more amount of detail.
The code review report identifies program modules that contain SQL and what that SQL does: ‘CRUD’…create/retrieve/update/delete from the database.
The Toad Code Rating is a scale of 1 to 4 where 1 is good and 4 is the worst. Just a simple rating with the following analysis giving far more detail.
The Halstead Volume is calculation/code function complexity. Items considered are any calculation, length of the calculation, flow logic, depth of flow logic, etc. The Report tab shows all the detail being considered.
0 – 1000 – an average programmer should be able to comprehend and maintain
1001 – 3000 – code is more challenging and would take more skills to comprehend and change content
> 3000 – too complex. Redesign this module.
McCabe’s Cyclomatic Complexity is a different and simpler metric for identifying program unit complexity
1 – 10 – Simple program
11 – 20 – More complex program
21 – 50 – complex program
>50 – untestable program
My personal favorite: The maintainability Index (MI). How maintainable is the code. This metric considers the output of both the Halstead and McCabes complexity scales.
0 – 64 – difficult to maintain
65 – 84 – moderate maintainability
>85 – easy to maintain
You can call upon Toad Help (Code Analysis) for assistance in running these reports. I would load this up and run the reports one at a time against each code module (procedure, function, or package) in an application or a programming assignment. The various results can easily be sorted by clicking on the heading of each report.
I find these code review reports useful. I hope you do as well.
Try Toad for Oracle nowTry Toad for Oracle free for 30 days. Already in a trial? Talk to sales or buy now online. Already a loyal fan of Toad for Oracle? Renew now. |
Related information
Webcast: How a Code Review Tool Can Help You Write Team-friendly PL/SQL [Webcast]
Video: Advanced code review using Code Analysis
Video: 'Dan's Dozen' Quick Toad Tips – Tip #9 – Code Review
Blog: Why PL/SQL Code Quality Matters
Blog:Toad Code Analysis
Blog: Analyzing Code with the Toad for Oracle Code Analysis Tool
Blog: 5 fitness tips for PL/SQL code
Blog: SQL tools – 8 ways you can’t live (or work) without them
Have questions, comments?
Head over to the Toad for Oracle forum on Toad World®! Chat with Toad developers, and lots of experienced users.
Help your colleagues
If you think your colleagues would benefit from this blog, share it now on social media with the buttons located at the top of this blog post. Thanks!
Start the discussion at forums.toadworld.com