In this article, we will learn to analyze code using the Toad Code Analysis diagnostic tool.
This tool shows a series of industry standard metrics that are very useful to determine the following:
- If the code contains errors
- The level of complexity of the PL / SQL code and any SQL code
- If the routine contains SQL and the type of SQL (as DML)
- How many lines of code there are in the routine
- If the code follows the rules
For example, this tool can be used by a project manager to assign developers for a new project. These reports can quickly assess the type of code and help the project manager decide who, in terms of skill level, would be required for the project.
On the other hand, developers can use this analysis tool to establish, for example, a reference status of the code they are about to work on and then compare it with the same elements of the report once the programming task has been completed.
This information provided by this tool can be used to help developers make sure they don’t make any mistakes. This feature can also be used to evaluate software packages based on the Oracle code and compare the code between the solutions being considered.
This feature is available in the Toad for Oracle Professional Edition and higher.
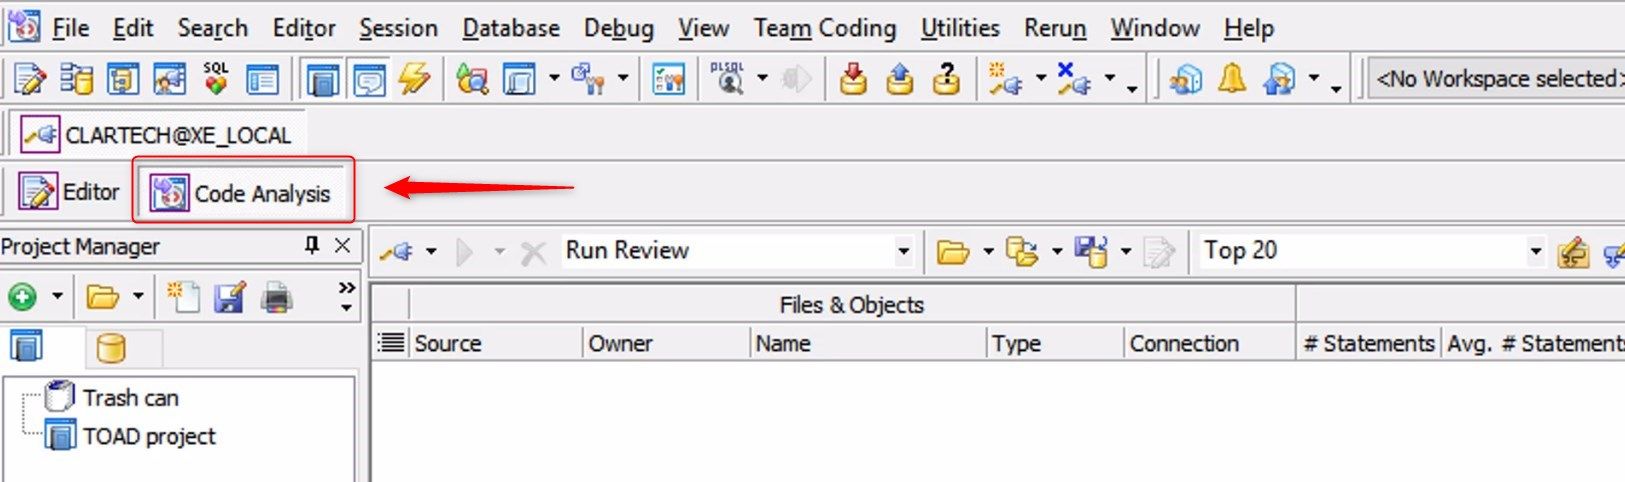
We select from the Database menu > Diagnose > Code Analysis:
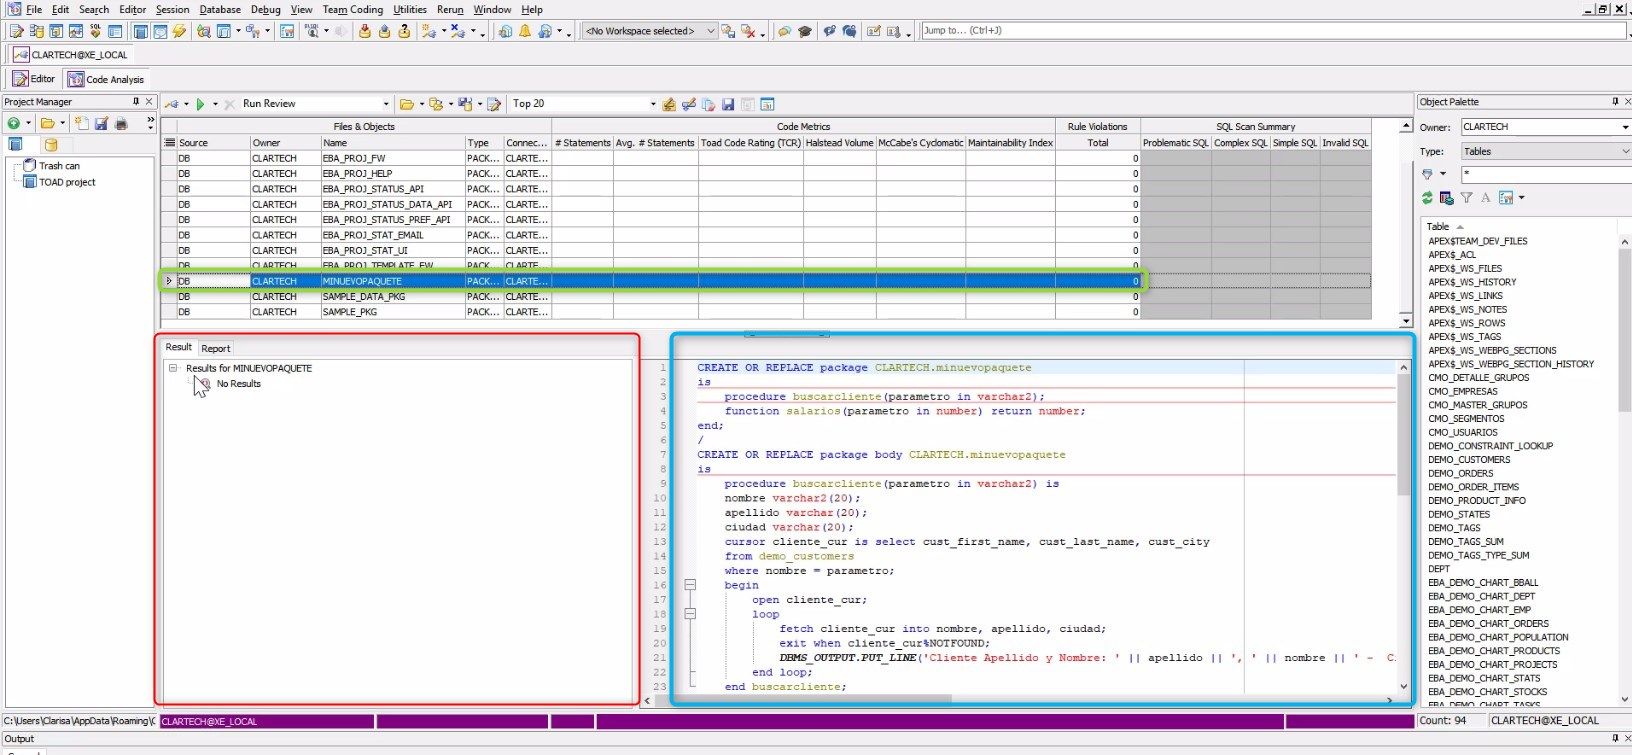
We can analyze packages, functions, and procedures. For example, for this demo we will work on the analysis of a package called MINUEVOPAQUETE.
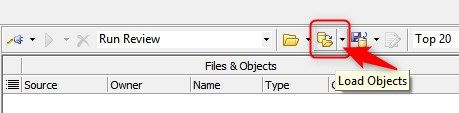
To load all the packages that we have available in our schema, we select the "Load Objects" icon.
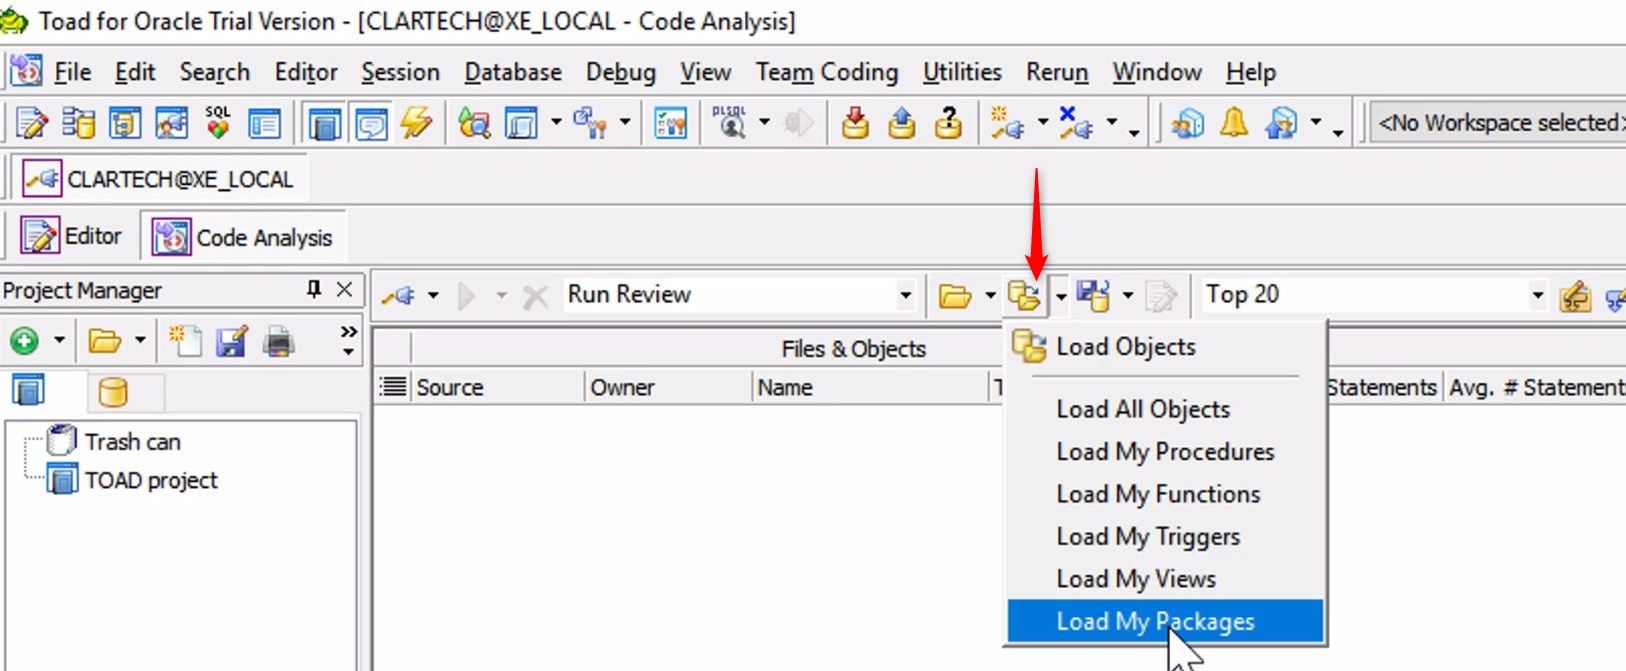
Then we select “Load My Packages”.
We select the package that we want to analyze. We can see two panels open: On the left side, we see the “Results tab” of the selected package, in which the analysis results will appear after we run the tool. On the right side, we can see the package code. In this example we are going to analyze a simple package as a demonstration.
In the “Report tab”, which is located next to the “Results tab”, we can see a Table of Contents.

This table of contents shows us the definitions of the metrics used by this analysis tool. Each of the metrics is explained in the table of contents in terms of how they are used by the tool.
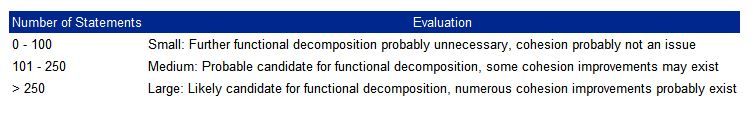
- Number of Statements: The USER_OBJECT_SIZE view contains information about the size of the source code, the size of the parsed code, and the size of the compiled code.
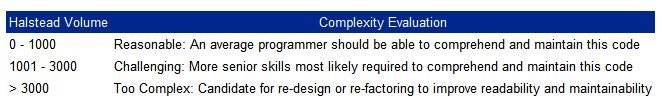
- Computational Complexity (Halstead Volume): The Halstead complexity measurement was developed to measure a program module’s complexity directly from source code, with emphasis on computational complexity. The Halstead measures are based on four scalar numbers derived directly from a program’s source code:
– n1 = the number of distinct operators
– n2 = the number of distinct operands
– N1 = the total number of operators
– N2 = the total number of operands
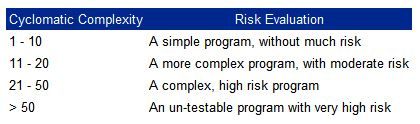
- Cyclomatic Complexity (McCabe's): The complexity of Cyclomatic is a simpler metric and provides a single ordinal number that can be compared to the complexity of other programs; in other words, it measures the amount of decision logic in a single software module. It is used for two related purposes in the structured testing methodology. First, it gives the number of recommended tests for software. Second, it is used during all phases of the software lifecycle, beginning with design, to keep software reliable, testable, and manageable. Cyclomatic complexity is based entirely on the structure of the software’s control flow graph.
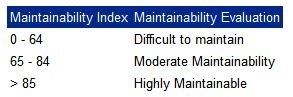
- Maintainability Index (MI): This metric aims to reflect how easy or difficult it will be to maintain the code. It is like a predictor of maintainability over time, intended to help reduce or reverse a system’s tendency toward “code entropy” or degraded integrity, and to indicate when it becomes cheaper and/or less risky to rewrite the code than to change it. This metric is the combination of Halstead Volume and McCabe.
Knowing these metrics, we are able to perform the analysis of our package.
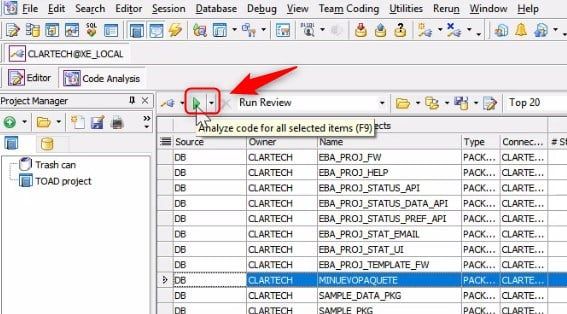
We go to the “Results tab”, having selected the package we want to analyze.
We click on the green triangle button "Analyze code for all selected items"; or, we can press the F9 key.
When executing the analysis of the package we can visualize the metrics in the Results tab:
– Halstead Volume: 27 (code easy to maintain and understand)
– McCabe’s Cyclomatic: 2 (It’s a very simple program)
– Maintainability Index: 122.17 (Easy to maintain code)
– Toad Code Rating (TCR): 1 (a simple classification by Toad that has 4 possible values: from 1 to 4, with 1 being the best and 4 being the worst)
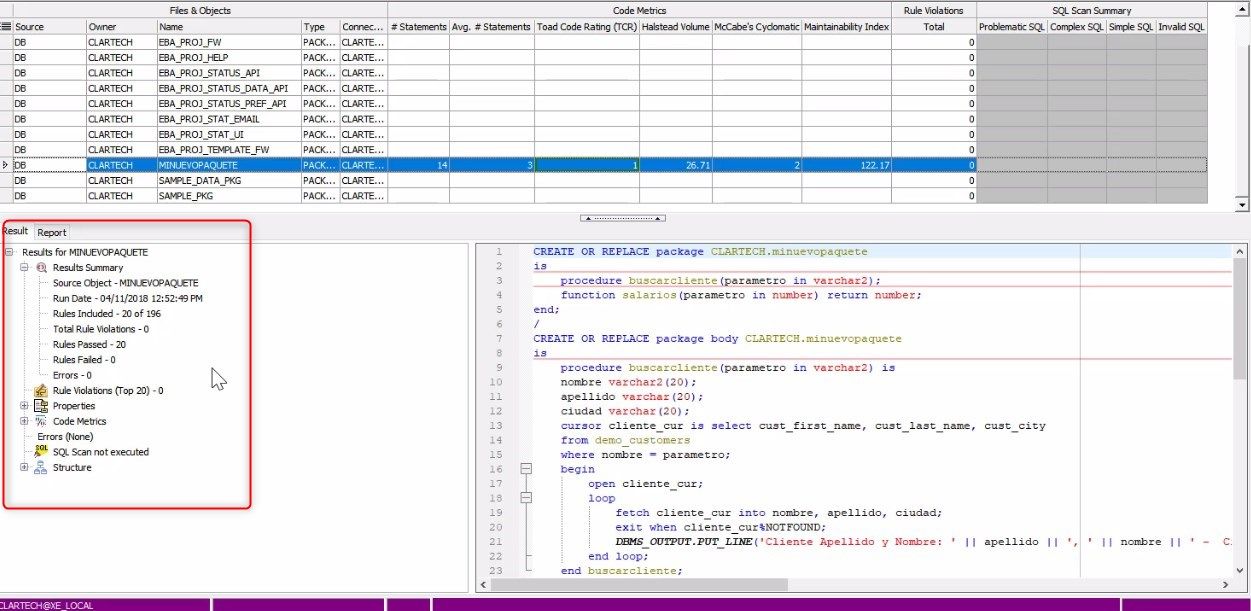
At first glance, with this analysis we can determine that this code is easy to maintain and easy to understand by the developer. Then, the project manager can select which developer is appropriate to maintain the code.
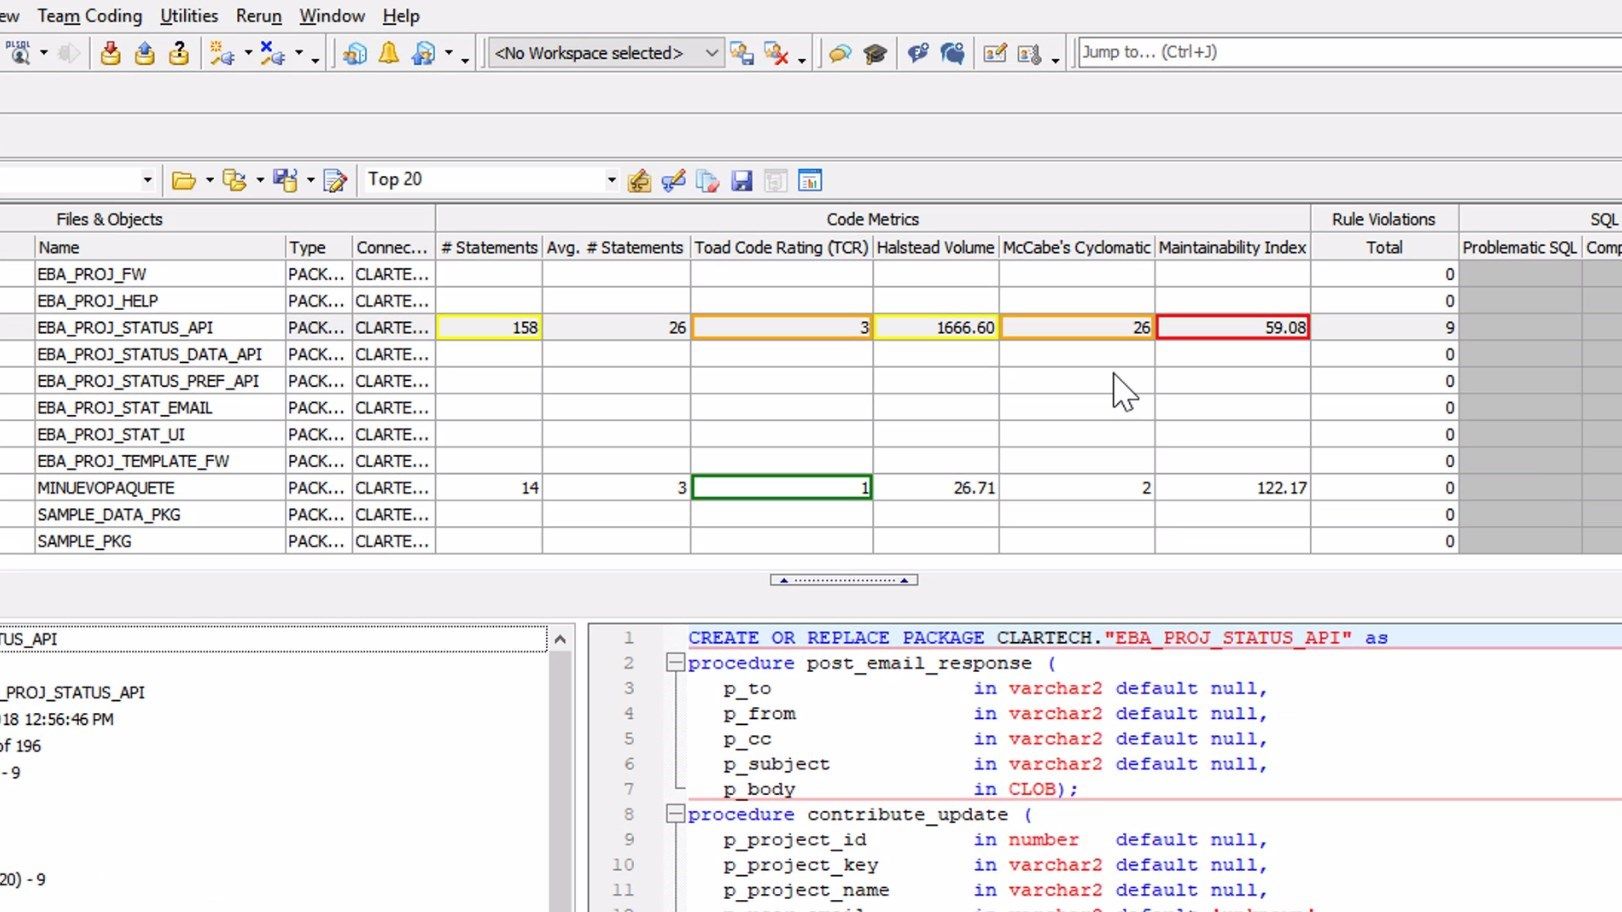
We will quickly analyze another complex code, in this case the package is called EBA_PROJ_STATUS_API.
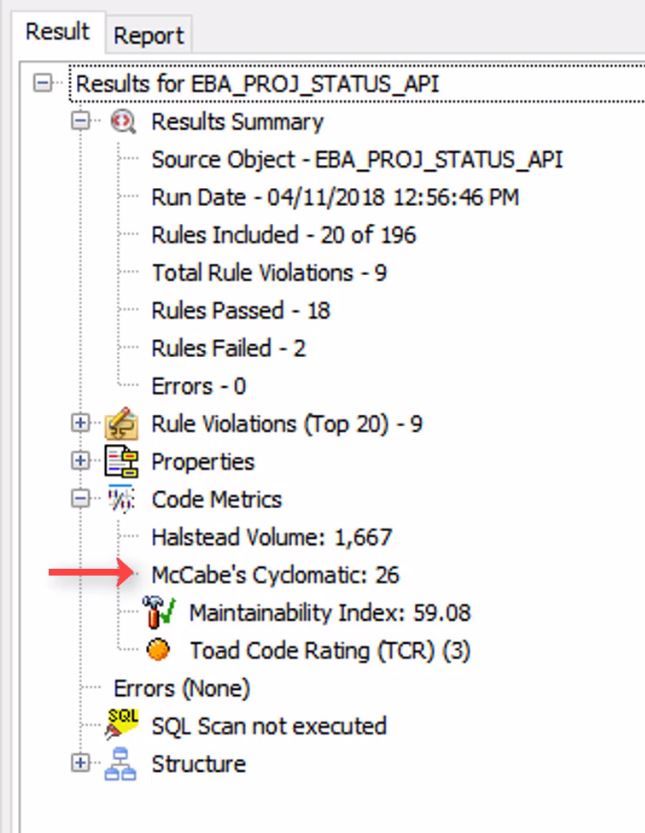
We can observe the values of the following metrics:
– Halstead Volume: 1,667 (code is a bit more complex, more challenging and it would take a bit more of the developer’s skills to be able to change the content of the code)
– McCabe’s Cyclomatic: 26 (it’s a complex program)
– Maintainability Index: 59.08 (the code is difficult to maintain)
– Toad Code Rating (TCR): 3 (Toad gives us a simple classification)
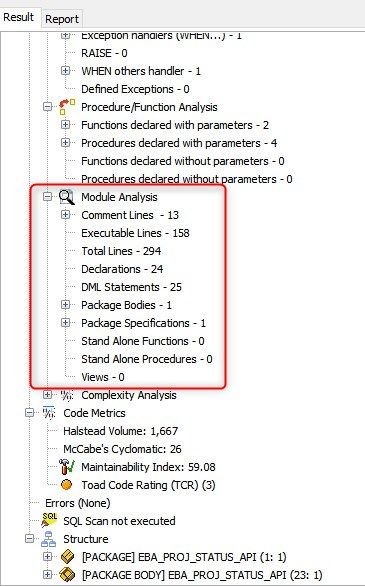
In addition to the code metrics we have a lot of information in the results tab, such as the Summary, Rule Violations, and Properties, which shows information about cursors, declarations, DML analysis, function analysis, procedures, etc.
An interesting section of the summary is the Module Analysis, which shows us at a glance the number of comment lines, the number of executable lines, the total number of lines, the number of declarations, the number of DML type declarations, etc.
Finally, we can see in the grid all the most important metrics of the packages we have just analyzed, highlighted by colors, which allows us to quickly see if the code is easy or not to maintain by the developer.
I invite you to use this great tool that Toad for Oracle provides us to analyze our code and know more about how we develop our program modules.
Try Toad for Oracle nowTry Toad for Oracle free for 30 days. Already in a trial? Talk to sales or buy now online. Already a loyal fan of Toad for Oracle? Renew now. |
Related information
Webcast: How a Code Review Tool Can Help You Write Team-friendly PL/SQL [Webcast]
Video: Advanced code review using Code Analysis
Video: 'Dan's Dozen' Quick Toad Tips – Tip #9 – Code Review
Blog: Why PL/SQL Code Quality Matters
Blog:Toad Code Analysis
Blog: Toad code review – useful to the programmer
Blog: 5 fitness tips for PL/SQL code
Blog: SQL tools – 8 ways you can’t live (or work) without them
Have questions, comments?
Head over to the Toad for Oracle forum on Toad World®! Chat with Toad developers, and lots of experienced users.
Help your colleagues
If you think your colleagues would benefit from this blog, share it now on social media with the buttons located at the top of this blog post. Thanks!
Thank you for informative post.
I have below questions, could you please help me out.