Hi,
Code Analysis has been in Toad for a while now. If you are using a slightly older version of Toad, it might be called Code Review, found under the same menu path.
Code Analysis gives you or your project team useful information about a particular routine or set of routines.
I find this information useful when starting to work on a PL/SQL routine. I can quickly assess the complexity of the routine, any issues that the review notices, and the complexity of any SQL within the routine.
A project manager can use this same information to make sure they have the right resources for each part of the project.
CREATE OR REPLACE PROCEDURE looping_example
IS
   cursor emp_cur is
        select ename
        from emp;
   loop_counter   NUMBER := 0;
   ename   varchar2(10);

BEGIN
   open emp_cur;

   fetch emp_cur into ename;

   while emp_cur%FOUND
   LOOP
      loop_counter := loop_counter + 1;
      DBMS_OUTPUT.put_line
          ('Record ' || loop_counter || ' is Employee ' || ename );
      fetch emp_cur into ename;
   END LOOP;

   DBMS_OUTPUT.put_line ('Procedure Looping Example is done');

   close emp_cur;

END;
This is my simple looping routine that I’ve used for years to demonstrate many features of Toad, including the debugger and the profilers.
I will run Code Analysis on this simple routine for my examples below.
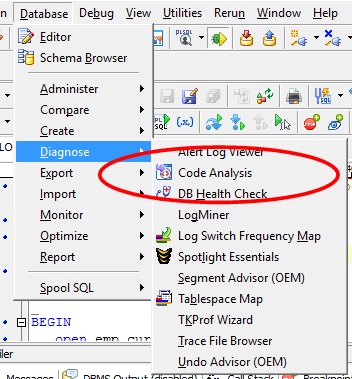
Accessing Code Analysis
To use: Database -> Diagnose -> Code Analysis.
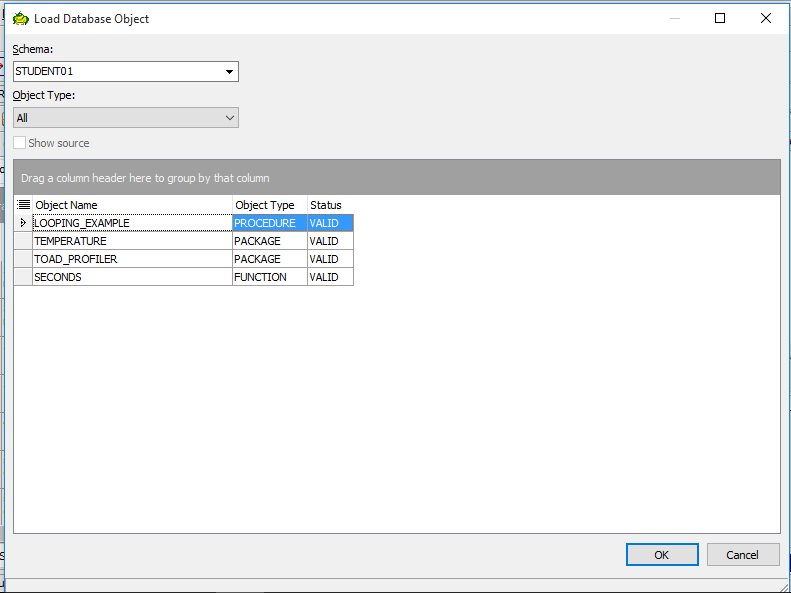
Accessing PLSQL Code
Now, click on Open from File system or Open from the database. Select your module or modules for evaluation. You can multi-select. You can select functions, procedures, and/or packages.
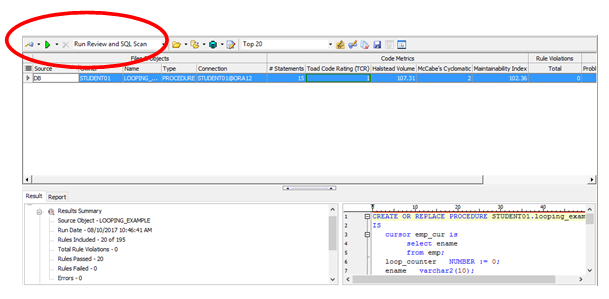
Code Analysis Panel
On the dropdown menu next to the green button, make sure you have selected ‘Run Review and SQL Scan’.
You run this report on one item at a time. Once run, you can then click and see the reports at any time. Rerun the report after making code changes on the same item to update the reports. Make sure to save the metrics from the prior run for easy comparison to make sure you improved things and didn’t make anything worse (such as code violations or invalid SQL). I would also look to make sure I didn’t accidentally make the routine more difficult to maintain next time it needs changes.
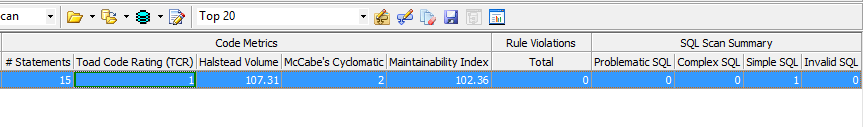
Useful Code Analysis Metrics
This report shows six main areas across the top of the interface that I would like as a manager:
- Number of statements in the code
- Toad Code Rating
- Halstead Volume – a rating of computational complexity
- McCabes Cyclomatic – a rating of overall module complexity
- Maintainability Index – a simple scale of maintainable code
- SQL Scan summary – SQL complexity has four areas:
- Problematic SQL
- Complex SQL
- Simple SQL
- Invalid SQL
A manager can use this simple scale when assigning resources to the project and to quickly see the status of a current project or an overall rating of a completed project.
The Toad rating is a simple 1 through 4 rating; ‘1’ being simple and ‘4’ being quite complex. At a minimum, any manager can see the complexity of this routine, using this simple rating, without going much further.
If I were a programmer, I would pay particular attention to the SQL Scan areas, making sure that there were no invalid SQL statements for sure, then maybe reviewing what this analysis deemed as complex.
Again, if I were a programmer, I’d review the lower left panel if there were any rule violations. I would be sure to fix these. The violations would be listed out if there were any.
And last, if I were a programmer, I would feel good about raising the maintainability index.
If I were the DBA or person in charge of code checkin/checkout… I would want to see this report for any module going into production.
This type of analysis might benefit those who are doing application evaluations. This analysis will give the person doing the evaluation very useful information about the code very quickly. I would look at the code violations, the complexity, and the results of the SQL Scan for sure.
The main interface allows you to open and analyze individual program units or packages. You can open a variety of program units but the Report (on the Report tab, lower left panel) will be more general.
When these reports are run against single program units or single packages, the report contains considerably more detail.
The report identifies program modules that contain SQL and what that SQL does: ‘CRUD’…create/retrieve/update/delete from the database.
The Halstead Volume is calculation/code function complexity. Items considered are any calculation, length of the calculation, flow logic, depth of flow logic, etc. The Report tab shows all the detail being considered.
0-1000 – an average programmer should be able to comprehend and maintain
1001-3000 – code is more challenging and would take more skills to comprehend and change content
>3000 – too complex. Redesign this module.
McCabe’s Cyclomatic Complexity is a different and simpler metric for identifying program unit complexity:
1-10 – Simple program
11-20 – More complex program
21-50 – complex program
>50 – untestable program
My personal favorite: The Maintainability Index (MI). How maintainable is the code? This metric considers the output of both the Halstead and McCabe’s complexity scales. I would always want to raise this number while working on code. Making code more difficult to maintain (lowering this number) would not be a good thing.
0-64 – difficult to maintain
65-84 – moderate maintainability
>85 – easy to maintain
I used the Toad Help and then found Code Analysis in the index for these descriptions and additional information on how to use the interface.
I find these reports useful. If your shop does code walkthroughs (not common, but I’ve been in shops that have used this technique), these reports might be invaluable for those reviewing the code, especially if they are new to the code or application.
As always, you can ask me for the scripts and sample code.
I hope you find these tips useful in your day-to-day use of the Oracle RDBMS.
Dan Hotka
Author/Instructor/Oracle Expert
Start the discussion at forums.toadworld.com