
Do you need to better understand your sales data? Quest® Toad® Data Point has powerful analytical views that allow you to extract more data value by comparing and filtering data from different sources using dimensional views. SQL allows for various data stores to be merged together for a single rowset of data. Toad Data Point allows for SQL to select data from well over 30 different data stores. So, if your client data is in Oracle and your sales data is in SQL Server, not a problem for Toad Data Point.
This blog will focus on these areas of data value:
- What is data value?
- The power of analytics
- Scenario 1: client churn
- Scenario 2: inventory churn

What is data value?
IGI Global defines it as “the value that derived from processing the data using different analytics that contributes to problem solving.”
What does this mean? It means that to realize more data value from your data stores, you must be able to compare similar data in a quick and meaningful way.
The power of analytics
Toad Data Point has a rather unique feature called Dimensional Views. This feature gives an analytical view of data across a common topic, or “dimension,” such as client data, sales data by date, sales data by product, sales data by sales rep, sales data by territory, and so on.
This example will be a simplistic look at employee data, then employee data by manager, then employee data by department. Toad Data Point allows for this data to be viewed in multiple dimensions at the same time.
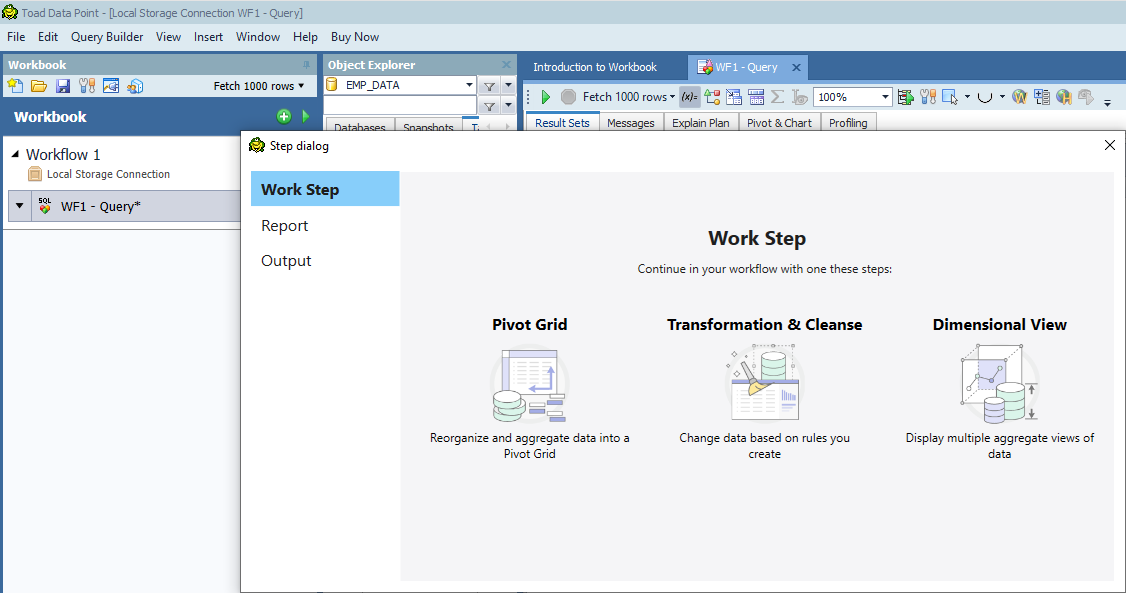
Toad Data Point building dimensional views
This is Toad Data Point Workbook. I have already built the simple query using Query Builder and have added a step. Toad Data Point knows what I can do with a data grid and I’ll choose Work Step and Dimensional View.
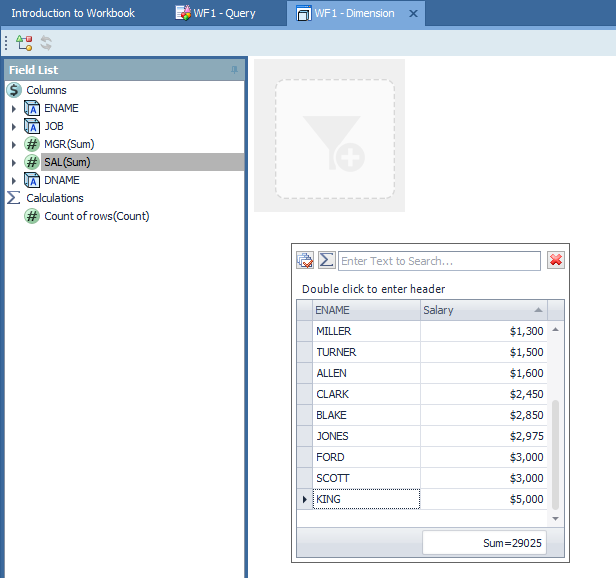
Toad Data Point single dimensional view
I simply dragged and dropped the ENAME column from the Field List to the canvas. Then, I dragged and dropped the SAL field and dropped it next to the ENAME heading. The amount and heading can be formatted. Notice I added a total under the Salary column by just clicking in that space. This took moments to do.
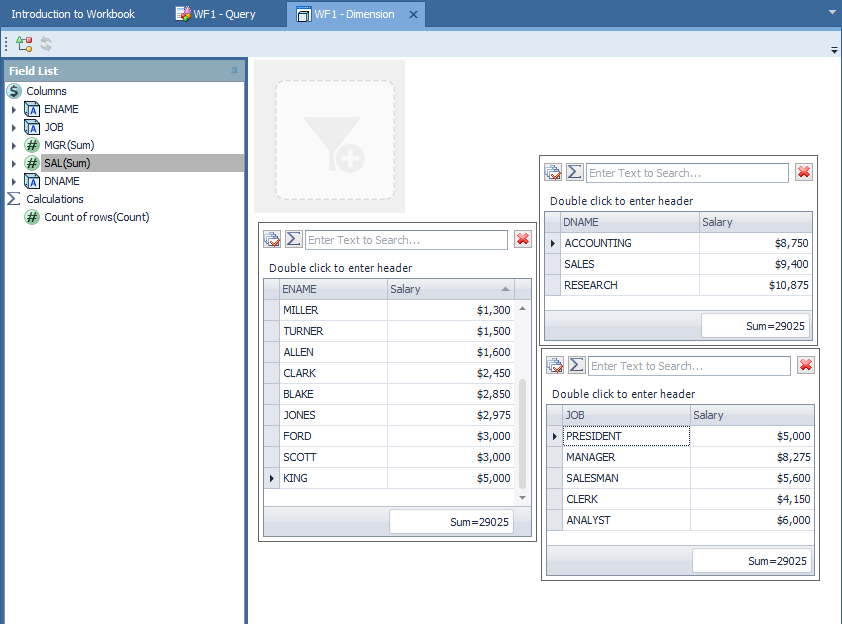
Toad Data Point additional dimensional views
Now, drag and drop the JOB column to the canvas and add the SAL column to it. Click at the bottom to add the Sum, and drag and drop the DNAME column to the canvas. Add the SAL field and totals to it as well.
Notice all three views are showing different but related data. I like the Sum at the bottom because this verifies that the amounts all add up the same.
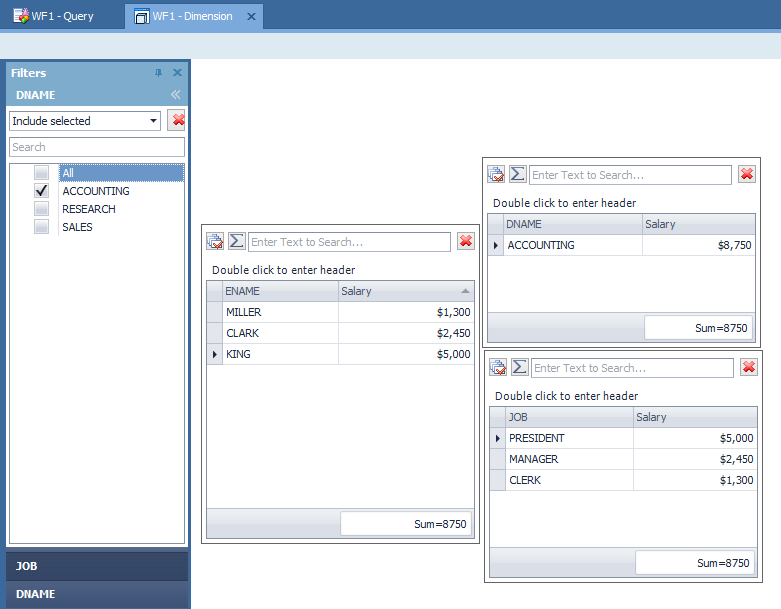
Toad Data Point filtering data
Now, drag and drop the JOB column from the Field List to the funnel box and do the same for the DNAME column. Now, you can filter on just certain items of data! All three dimensions will reflect the filter and show the correct data! You can filter on JOB or DNAME or both now.
This is a powerful feature to keep in mind as I discuss two scenarios where you can derive data value. Using this technique to do the analytics, you can easily see related data for different clients, products, date ranges, etc.
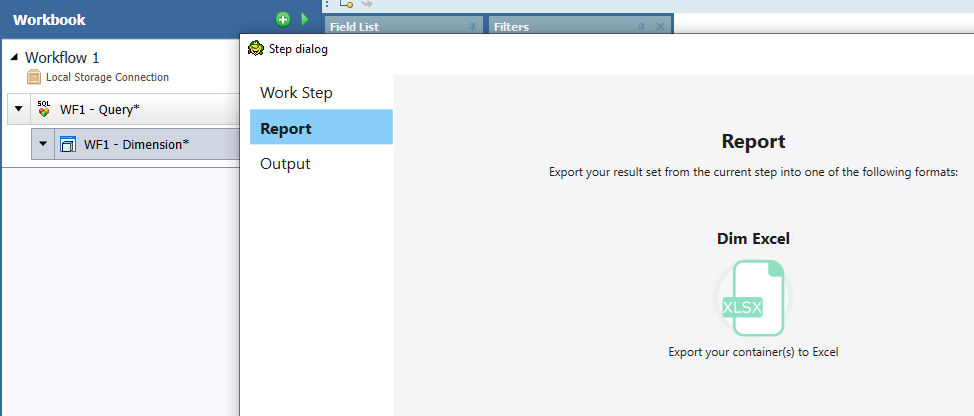
Toad Data Point Workbook saving the output
You can save the data and push it to spreadsheets. Toad Data Point Workbook makes it easy create this output. Traditional Toad Data Point has a Dimensional View menu item that allows for the same analytical views to be built and more of a manual operation to process the output.
Both Traditional Toad Data Point and Toad Data Point Workbook allow for data to be selected, analyzed in this side-by-side comparative fashion, and saved for publishing, sharing, or other analytical needs. This is one way to extract data value from disconnected data sets.
Scenario 1: client churn
If your business runs promotions to attract new customers, you’ll want to know how effective they are in terms of landing new clients (conversions) and how long the client stayed with the business (retention).
Utilizing date values and SQL, you can combine sales within a promotional period, merge prior quarter/prior year data, then set up dimensional views for the client, the promotion (linked by the client), and product sales from within the promotional period, again linked by client). This type of analysis will show you how much of the product was purchased during the promotional period.
Another dimensional view can be created that leads with the product and links to periods within and outside of the promotional dates. This data will show if there was an increase in certain products participating in the promotion versus normal sales of the same product.
SQL outer joins can be used to show data from within a period of time (appears in the promotional table) and outside of a period of time (null values on the join to the promotion show the sales outside of the promotion). Again, you can use Toad Data Point Dimensional Views to illustrate this data, allowing you to filter on specific promotions, and/or specific products.
Try Toad Data Point for freeLearn how Toad Data Point can help you access and prepare data faster. Seamlessly access more than 50 data sources—both on premises and in the cloud—and switch between these data source with near zero transition times. Get started with our free 30-day trial. Already in a trial? If Toad Data Point is helping you connect, query and prepare data for faster business insights, buy it now or contact a sales representative. |
Scenario 2: inventory churn
If your business has many products, this information could be useful for stocking and restocking your inventory with the best-selling items, identifying seasonal items, and locating products that don't sell at all.
For this example, you need access to your product inventory data and sales data. By mixing the two using SQL, you can use Toad Data Point to create Dimensional Views on sales by quarter, sales by month, and to show products with no sales data (again, the valuable outer join).
You can also add sales by territory to see which products sell better in certain geographies, and by blending in the date value, you can see which products sell better in certain geographies within a given time period.
Toad Data Point has the analytical power to compare and contrast your data to derive useful information for a variety of business scenarios and insights. Extracting value from your data can give you a competitive edge as you make faster and smarter decisions.
Related links:
Blog: How to use Toad Data Point to solve data preparation issues
Blog / video: What is data preparation and why is it key to the business analyst?
Blog: How to prepare data for machine learning
Blog: Easy data prep: Toad® Data Point v5+ new features
Quest blog: Data prep and Analysis: Using Data Efficiently in the Era of Dark Data
Webinar: Answering Your Top Five Questions About Toad Data Point Automation
Ebook: The Four Roadblocks of Data prep
Visit Quest for data prep and provisioning with Toad Data Point and Toad Intelligence Central
IDC Datasheet: Quest Software Acquires erwin Inc.
Visit Quest erwin, for enterprise data governance
Watch the video blog: How to extract more data value for competitive advantage
Have questions or comments?
Head over to the Toad Data Point forum on Toad World®! Chat with Toad developers and lots of experienced users.
Help your colleagues
If you think your colleagues would benefit from this blog, share it now on social media with the buttons located at the top of this blog post. Thanks!
Dan Hotka has several course offerings that use Toad and Toad Data Point.
Start the discussion at forums.toadworld.com