Read the blog, then watch the video. In just 13 minutes Dan Hotka, Oracle Ace, walks you through new features in Toad® Data Point v5+.

Is the process of data preparation causing delays in decisions? Companies are increasingly relying on data to guide them in making better-informed business decisions. More and more people have a need to know, a need to access and a need to easily interpret data—and they need the information now. At the same time, the people who are usually tasked with retrieving data (DBAs) are already feeling the sharp increase in database tasks and don’t have time to chase and deliver data reports.
What’s a person to do?
The good news is that you no longer need to bother your busy DBA to pull data and reports. You don’t even need to be a SQL guru or data master. Toad Data Point makes pulling together your own data sets and reports easy. Data preparation is now easier than ever.
That’s why I believe that the Quest® Toad Data Point tool is the best data analysis tool in the business. In today’s blog I’m going to highlight the following features because I think these features make data preparation easy:
- Workbook Interface
- Sharing workbooks/Sharing Internal Steps
- New Scheduling Features for Workbooks
- A hidden gem: Dimensional Views
What is Toad Data Point?
The Toad Data Point tool is a great data analysis tool for the business analyst. This tool provides excellent cross-database/data storage access of data and allows these data stores to be mixed into a single reporting step. This data preparation tool has query builder for the novice and the popular Toad Editor for those with SQL experience. This tool provides excellent support for Excel, Access, and general data reparation and sharing. This tool has several useful features such as the newer Workbook interface that has step-by-step development and superb data visualization tools such as Dimensional Views…a way to see groupings of related data easily.
This blog post and associated video blog will cover newer features of Toad Data Point found in versions 5.0 thru 5.3. Also, make sure to tune in and watch Product Manager, Julie Hyman in the webinar: How to Simplify Reporting and More with Quest® Toad® Data Point v5.3.

Workbook Interface
Toad Data Point v5.0 introduced a new interface to the tool: Workbook.
When Toad Data Point v5+ installs, it now displays two icons on the desktop: Toad Data Point and Toad Workbook. Toad Workbook is actually just a part of Toad Data Point but started with a different option to bring up the Workflow interface. The original Toad Data Point tool is usually referred to as “traditional Toad Data Point.” The new interface is referred to as ”Toad Workbook”.
Toad Data Point Desktop Icons
This feature walks the analyst thru a series of steps to produce the desired output. These steps are part of a workbook and each step doesn’t allow the user to do things out of a proper sequence. For example, you cannot save the data to a spreadsheet or PDF file until you have selected the data first.
Each step has a series of other steps under it that can be performed at that particular level.
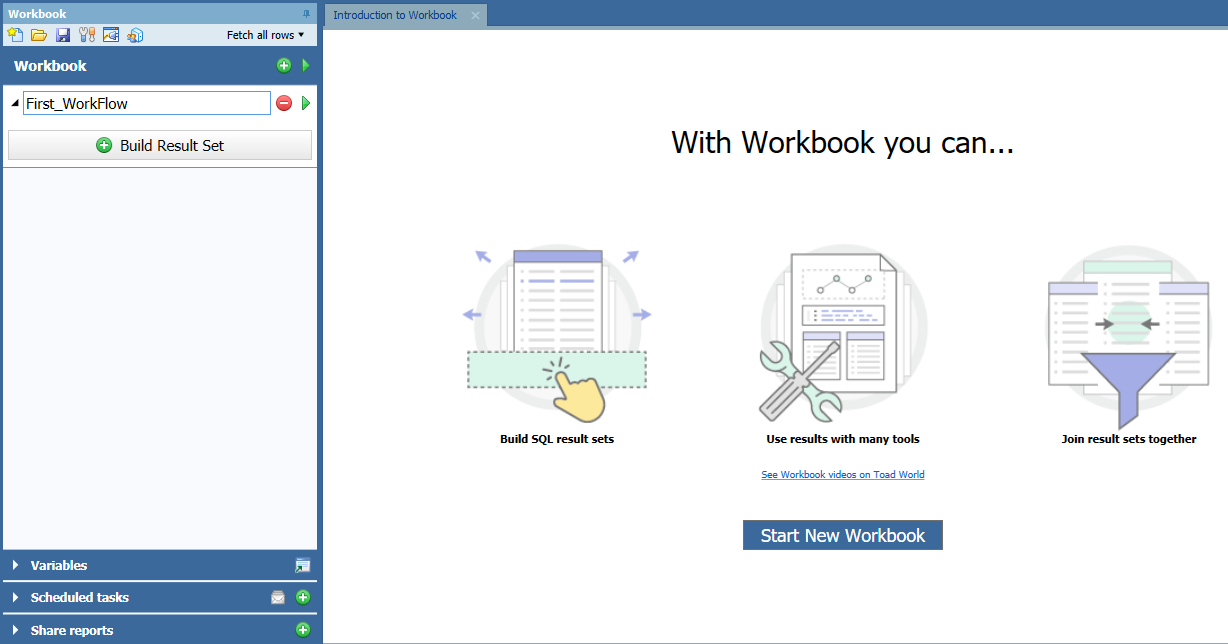
Toad Data Point Workflow Example
The above illustration shows the startup page and a workflow being started. In v5.0 of the tool, you would right-click on the steps to change the step name. From v5.1 on, you now just double click to change the name of the step. Notice this user has started a work flow and the first task is always to access some data.
In the lower left part of this screen is a Variables tab. This step was introduced in v5.2 and allows for the SQL to now contain bind variables that can be submitted before the workflow is executed. The Scheduled Tasks allows for these workbooks to be scheduled using the Toad Scheduler. This feature was introduced in v5.3. The Shared Reports allows for reports generated during this workflow to be added to email distribution. This feature was also introduced in v5.0.
Sharing workbooks/sharing internal steps
Before Toad Data Point v5.2, if you wanted to repeat a step, you had to re-enter all of your work again. Toad Data Point v5.2 now offers this right-click menu (or click on the little down arrow on the step) to Clone Workflow…right click on other steps from other work flows allows you to copy steps from say this workflow.
The next illustration shows how to copy the whole work flow. The Copy Internal Steps illustration shows the same drop down menu and this is context sensitive. Toad Data Point knows you clicked this on a lower step and offers to let you copy and paste it to another location in this workflow or to another workflow.
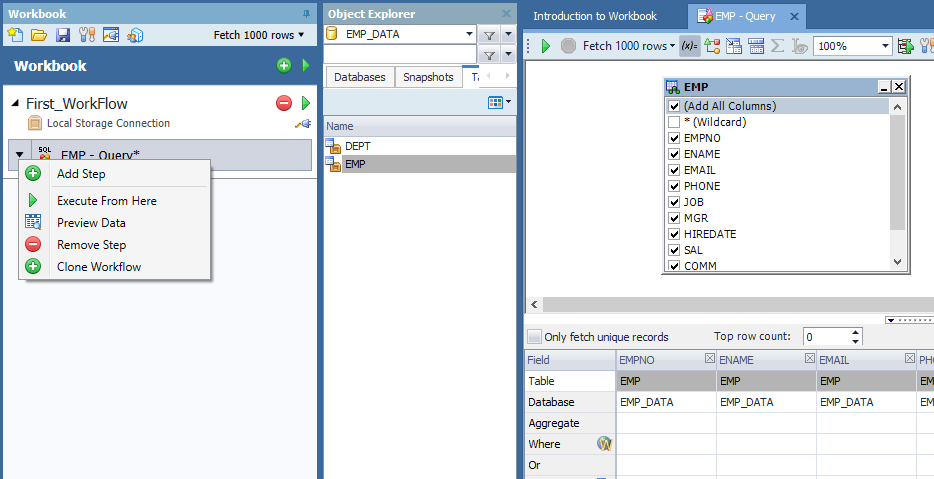
Toad Data Point Clone Workflow
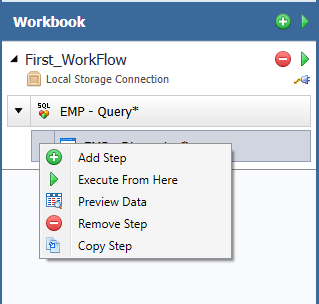
Toad Data Point Copy Internal Steps
New scheduling features of workbooks
This feature was introduced in Toad Data Point v5.2, the ability to schedule this workbook using the Toad Scheduler. Clicking the + sign on the Scheduled Tasks tab starts the wizard
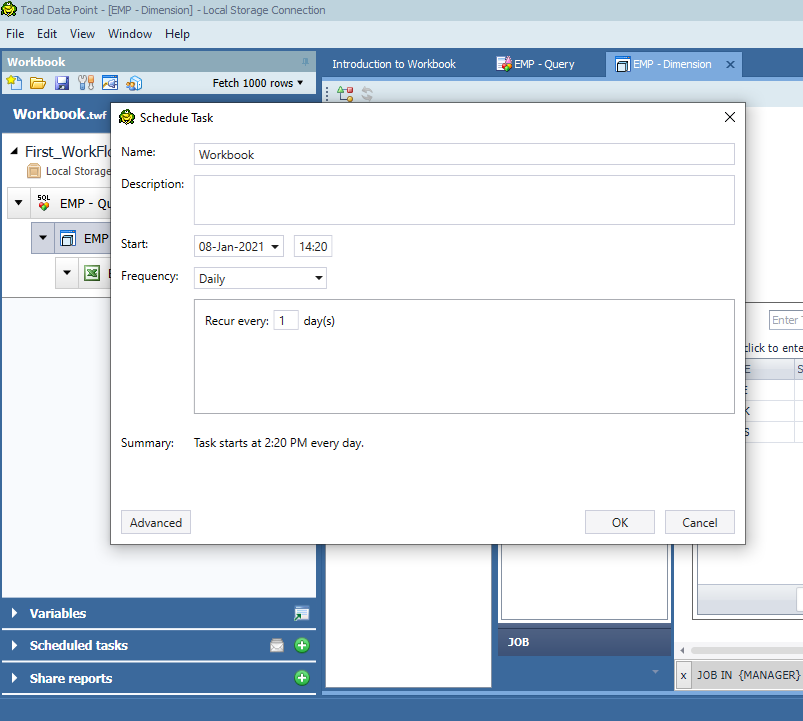
Toad Data Point Scheduling
This panel allows you to setup simple scheduling options. You click on the Advanced button in the lower left corner, and now you have complete control over when this workbook runs, how often, notifications, and more.
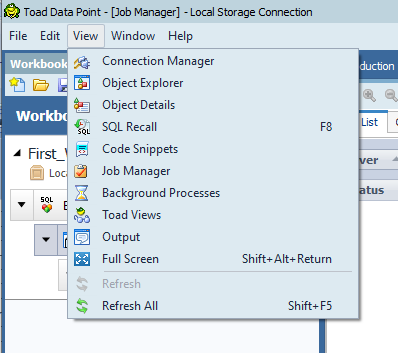
Toad Data Point Job Manager
The Job Manager is available from the menu bar as seen above. This panel allows you to see and control what is currently scheduled. This panel also allows you to see the run history.
A hidden gem: Dimensional views
Let’s go ahead at this step and select Dimensional Views. This really isn’t a new feature but something really cool within Toad Data Point, a feature I have not found in similar tools. From the drop down menu select Add Step, we picked Dimensional Views from the Work Step options. Notice I am renaming the steps as I go. This makes the workflow self-documenting and much easier for the next person making updates or changes to follow the flow of activities
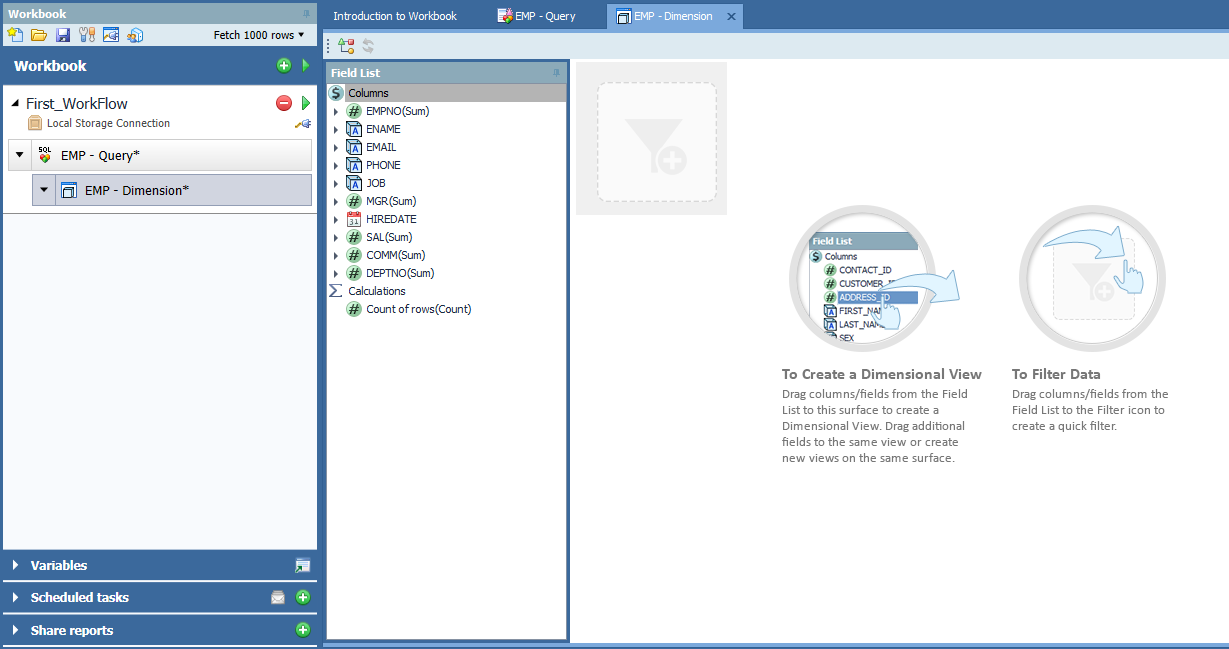
Toad Data Point dimensional view step
Dimensional Views allow for similar data to be viewed together at the same time, a dashboard per se. This step starts the Dimensional View pallet. You drag and drop columns out onto the pallet. My live demonstration illustrates how to change the data formats and how easy this is to filter the common data selections as well.
 Toad Data
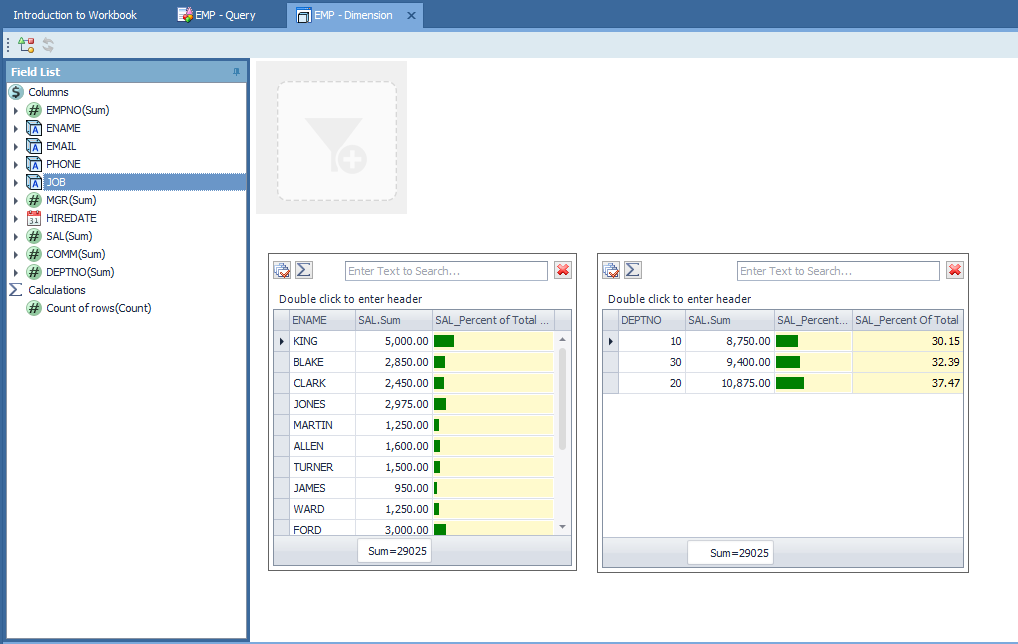
Point Dimensional View Showing Related Data
You simply drag and drop the column of info and the amount fields you wish to relate together onto the pallet. Right mouse clicks allow for you to format the data, add percentages, and percentage graphs. Notice I also easily added the summary of the salary field at the bottoms, so when we filter the items, we can see the same data is being shown.
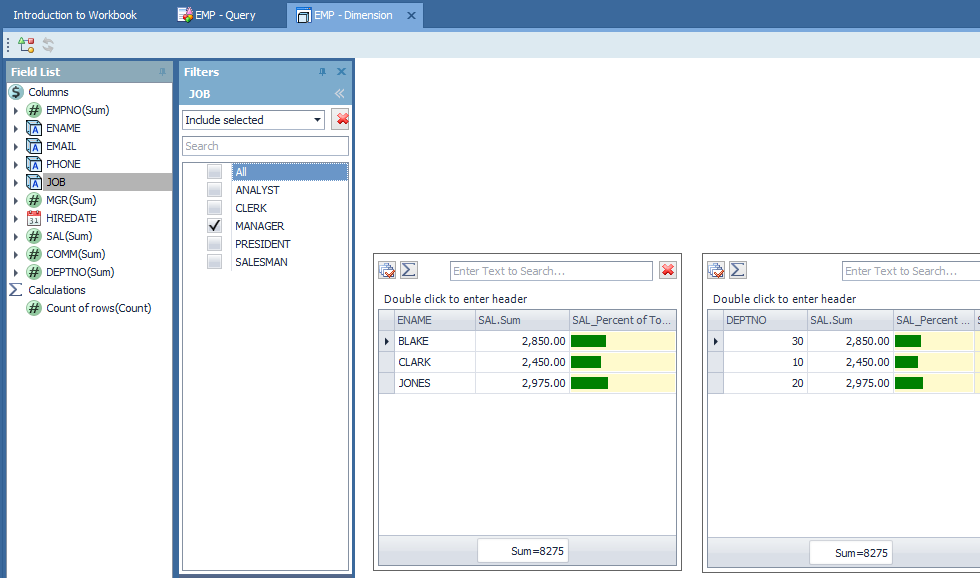
Toad Data Point Dimensional View Filtering
Now, drag and drop the fields to the gray filter area and a new box appears. You can drag several data items into the filter as well. Now, you can select how you wish to see the summary data. In this case, I chose to show the related data by Manager.
Watch the 12-minute video demo
Closing
The Toad Data Point version 5 new features is a nice update to the Toad Data Point tool. These features started with the introduction of the Workbook/Workflow concept of building a beginning to end data analysis and reporting solution. These newer features enhance the workflow output and development experience.
Read more blogs from Dan Hotka.
Attend a Dan Hotka course offering that uses Toad and Toad Data Point.
Related information:
New! Webinar: How to Simplify Reporting and More with Quest® Toad® Data Point v5.3
Webinar series: Data Preparation Made Easy: Toad Data Point Webcast Series
Webinar: Unlock Your Oracle Data: Replication to Azure
Ebook: Toad Data Point Workbook for Beginners
Ebook: The Four Roadblocks of Data Preparation
Quest blog: Data Preparation and Analysis: Using Data Efficiently in the Era of Dark Data
Toad World related blogs: Access more Toad Data Point blogs.
How to get the most out of Toad Data PointLearn how Toad Data Point can help you access and prepare data faster. Seamlessly access more than 50 data sources—both on premises and in the cloud—and switch between these data source with near zero transition times.
Already in a trial? If Toad Data Point is helping you connect, query and prepare data for faster business insights, buy it now or contact a sales representative. |

Questions?
I hope this blog is useful to you. If you have any questions, please post questions to the Toad Data Point forum on Toad World.
Help your colleagues
If you think your colleagues would benefit from this blog, share it now on social media with the buttons located at the top of this blog post. Thanks!
Start the discussion at forums.toadworld.com