
Select "BTM service" from the left panel. Business Transaction Management (BTM) is a feature of the WebLogic Server Management Pack Enterprise Edition (EE), as well as the SOA Management Pack Enterprise Edition (EE) in Enterprise Manager.
BTM is used to manage and monitor business transactions across multiple services in the enterprise.
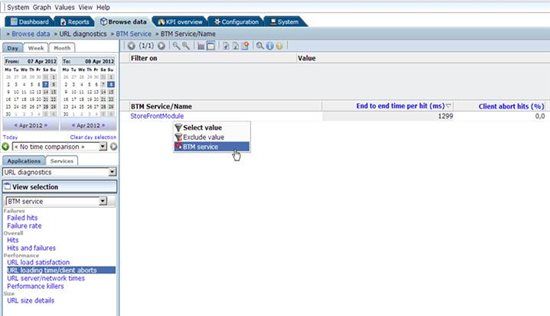
The Data set view changes to the BTM service name, which is "StoreFrontModule" for this particular application. Right click on the service name and select "BTM service" from the drop down menu.
This will drill down into the BTM feature of Enterprise Manager.
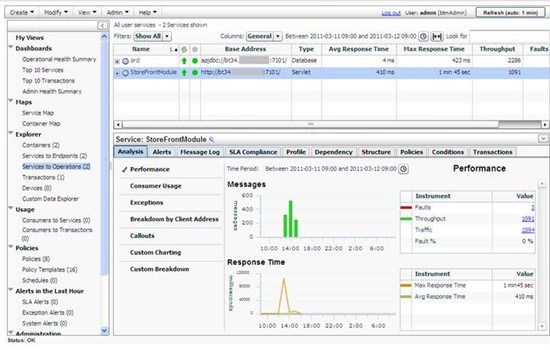
The drill down to BTM from RUEI ensures that the service that is to be analyzed is already pre-selected. You can now use BTM for an overall analysis of the interaction of this service with other services, the route taken by the transaction and the delays encountered.
We have seen how RUEI can drill down into JVM Diagnostics, ADP and BTM which are Enterprise Manager WebLogic Server and SOA management capabilities. Now, we come to another important aspect of Real User Experience Insight, which is the analysis of user sessions.
User Session Analysis
When users complain of web performance issues or errors, it is normally very difficult to reproduce and trouble shoot such issues without a sophisticated tool like Real User Experience Insight. We will now have a look at how RUEI can assist in the reproduction and ultimate solution of such issues.
Move back to the Shop dashboard in RUEI. Locate the "Top usage per user-id" widget, and click on the cube icon to browse the data set.
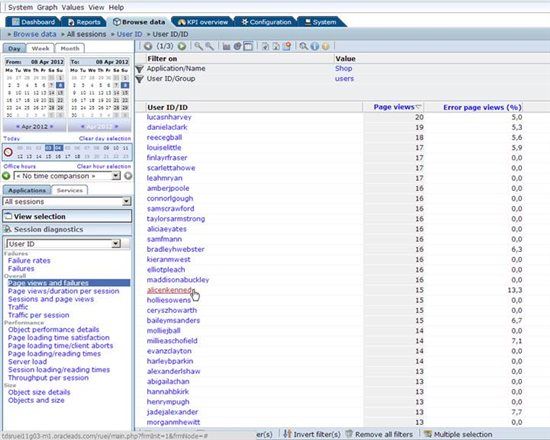
When the data set appears, you can see a list of all the User IDs for the shop application, their Page view counts and Error page view (%). Locate the User ID with the highest percentage of error page views, and click on the name.
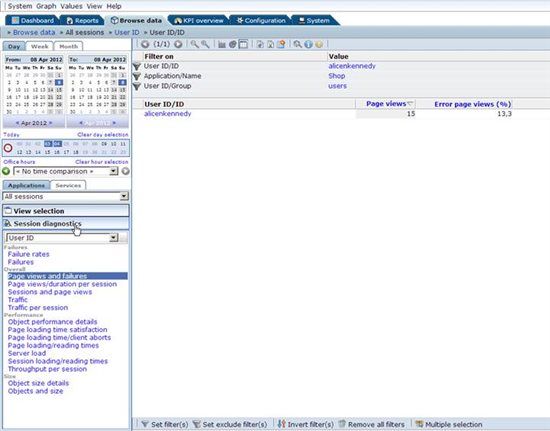
The user you have selected appears in the filter. In the left panel, you can now click on "Session diagnostics".
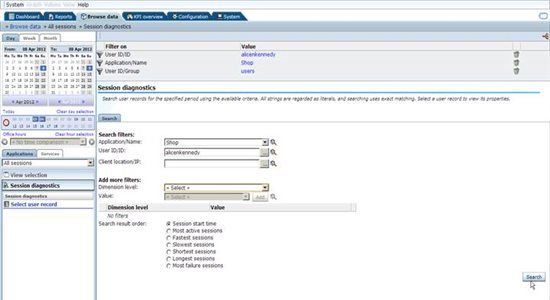
A search dialogue appears. Click on the Search button, and this will find all the relevant sessions of this user.
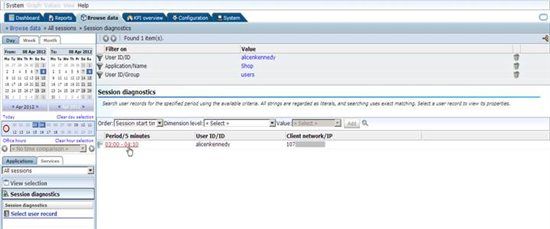
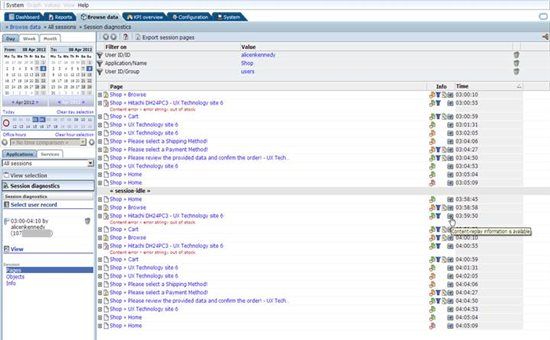
We see that there is a session of this user which lasted from 03:00 upto 04:10, from a particular Client IP.
Click on the time period. This will load the full activity of the user in the next screen.
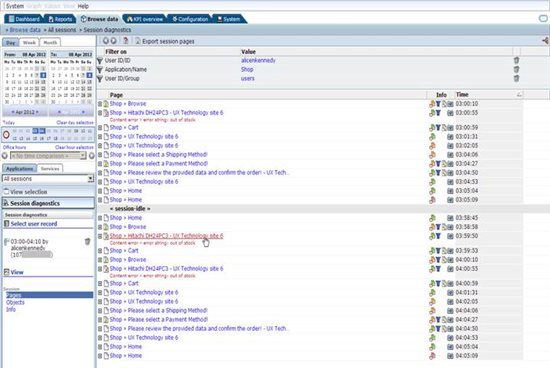
The entire session activity for the user is displayed. You can see what pages were visited by the user, one after the other and even the time of visit for each page.
Colored icons indicate the loading times of each page, so you can see which pages were slow or not. A green page icon means a satisfied loading time, and an orange page icon means a tolerated loading time. A blue funnel icon indicates a user flow page (meaning that the function is part of a business transaction).
The admin may mark a page as important, and this is signified by the key icon which means a key page. The most significant is the camera icon, which means content-replay information is available for that page.
We can see a page with a Content error. Click on the page name. This brings up the Page properties screen as shown below.
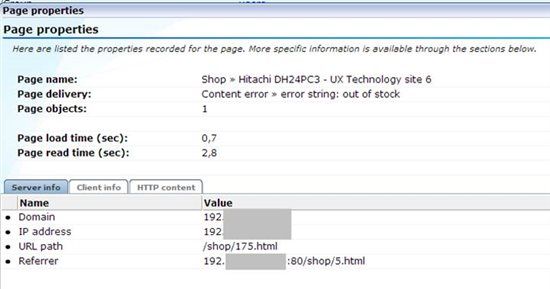
The page properties shows information such as the page name, the page delivery message (in this case, a content error), the page load time, and the page read time.
In the Server info section, the Domain, IP address, URL path, and Referrer information is shown. Click on the Client info tab.
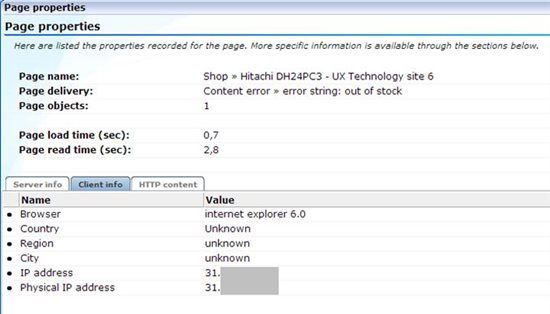
In the Client info tab, we can see the Browser version used by the client, and the Country, Region, City, IP address, Physical IP address of the client. Click on the HTTP content tab.
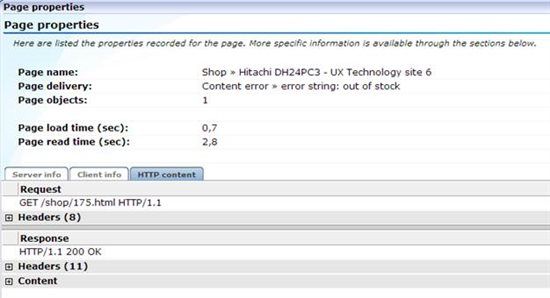
The HTTP content tab shows the Request made (in this case a GET), the Response (in this case an HTTP OK), and the related Headers and Content. All this information aids greatly in trouble shooting.
Move back to the Session Activity page.
On the Session Activity page, locate the session page with the content error and click on the camera icon (that signifies the availability of Content-replay information).
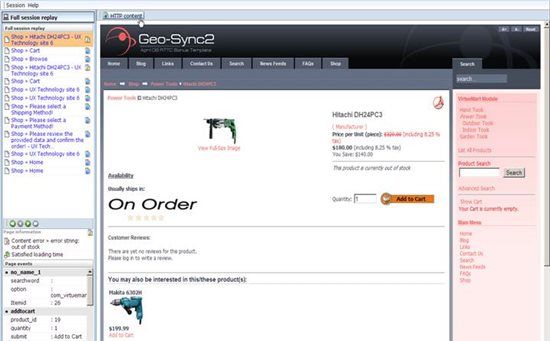
This displays the exact page the user had seen, including the content error "This product is currently out of stock". The content error has been defined in RUEI, so it is able to detect this string on any page. In a similar manner, other error strings can also be easily detected by simply defining them in RUEI.
Note that this is not a reproduction of the page but the actual page content which was saved by RUEI during the real user session.
Click on the HTTP content button.
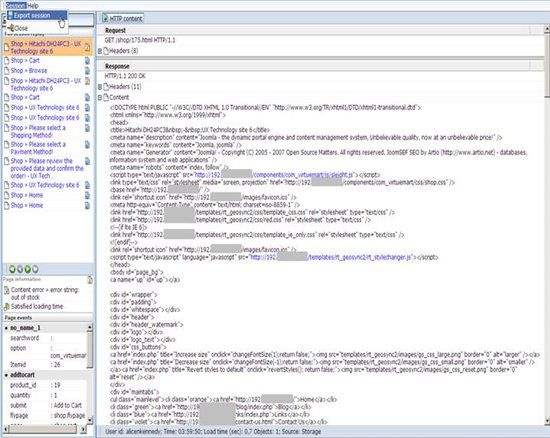
You can examine the HTTP coding for the page, and determine if there are any errors in the code. The content as well as the headers can be examined.
From the top menu, you can select Session.. Export session. This allows you to export the entire real user session, which can then be imported into the Oracle Application Testing Suite (ATS) product for functional and load testing. This integration of ATS with RUEI helps the tester to reduce the time taken for writing testing scripts.
Now, move to the EBS dashboard in RUEI.
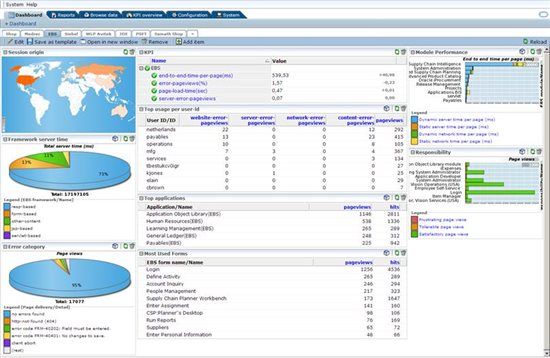
This is the E-Business Suite dashboard, showing the monitoring and performance of the E-Business application.
RUEI has Accelerators for various Oracle applications such as E-Business, Siebel, PeopleSoft and JD Edwards. The RUEI Application Accelerators allow you to set up out-of-the-box real user monitoring for these applications.
We will continue looking into RUEI in Part V of this article series.
Start the discussion at forums.toadworld.com