In this article series, we are discussing Oracle Real User Experience Insight. Part II was here. This is the third article in the series.
We looked at the creation of dashboard templates. We can see that templates are very helpful for enforcing appropriate application access. A RUEI administrator can increase productivity by saving existing dashboards as templates, and then re-using them to create dashboards for new applications simply by changing the application filter.
Move to the Publish tab.
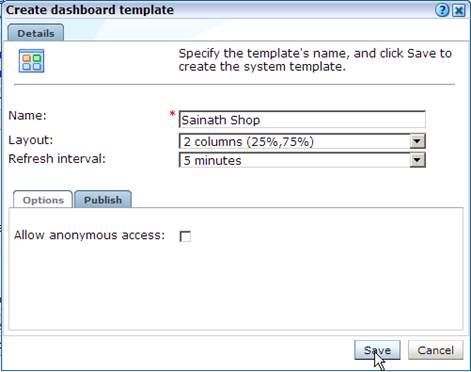
In this tab, you can specify if anonymous access is allowed or not to this dashboard template. This becomes a published template in that case, which is viewable by external users via a generated link.
In our case, we are not publishing the template. Click on Save to continue.
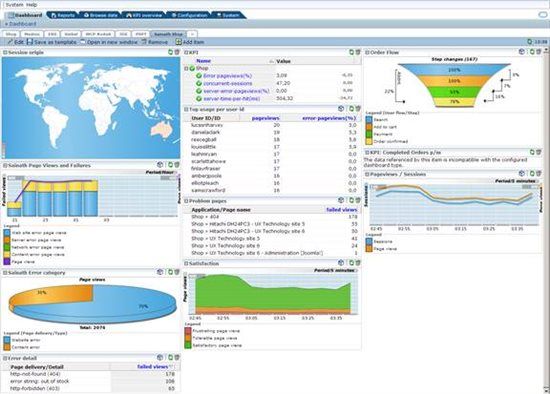
You have now created a dashboard template. After you save it, you are placed back on the dashboard for the Shop application.
Locate the cube icon in the title bar of the Error Category widget and click on it.
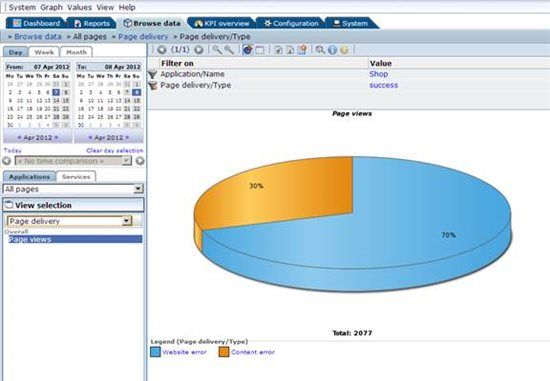
BI (Business Intelligence) capabilities are inbuilt into RUEI. All the network traffic information that is captured is placed in BI datasets, with the ability to slice and dice data in any way for the purpose of analysis.
All the filters are pre-selected so that the required information can be found easily. As we can see, the filters are on the Shop application and successful page delivery. The main data is based on the Error Category, showing the different kind of errors for this application.
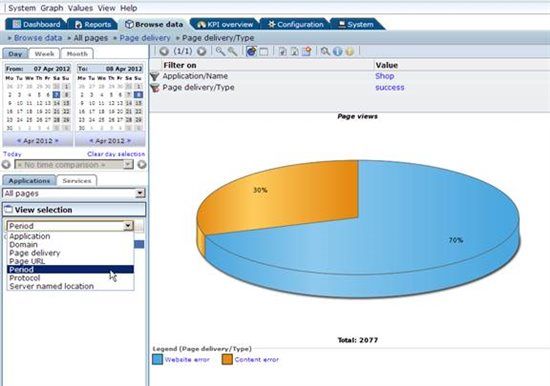
To view the same data in a different manner, select "Period" from the dropdown box under “View selection” in the left panel. The other options can be seen in the screenshot shown above.
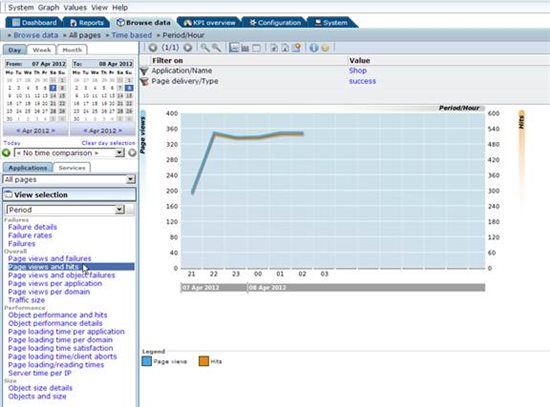
The same error category data is now displayed against time, for the last 6 hours. The left panel shows that more views are now available for the same data.
We have switched to "Page views and hits" instead of failures.
To see the data in a different manner, you can select "Page views and failures" from the left panel.
This displays the following screen.
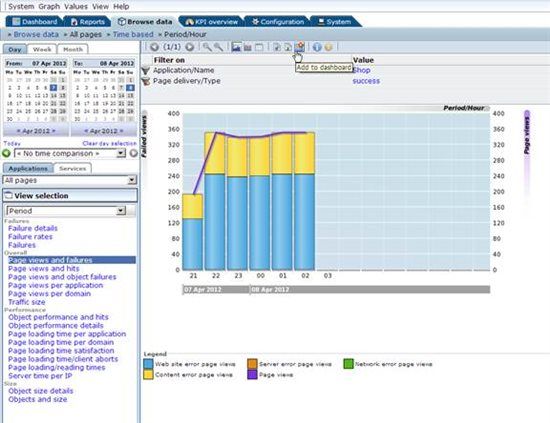
A combined stacked bar-line graph is shown with the data. Since it is an interesting report, we have decided to add it to the dashboard.
This can be done by clicking on the "Add to dashboard" icon at the top of the screen.
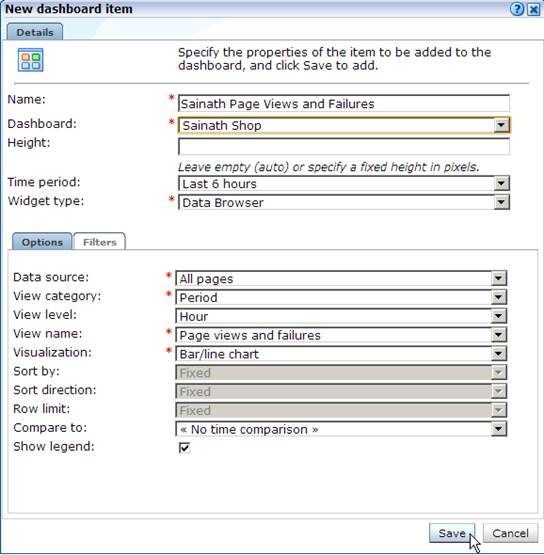
In the pop up window that appears for the New dashboard item, specify the name for the new widget, and the dashboard or template it should be placed on.
Leave all the values as default (as picked up from the report) and click on the Save button.
You are placed back on the Shop dashboard. Click on the ">>" dashboard tab to create a new dashboard.
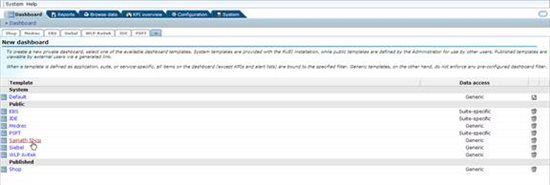
You can select any of the listed dashboard templates to create a new private dashboard.
We can select the Sainath Shop template that was previously created.
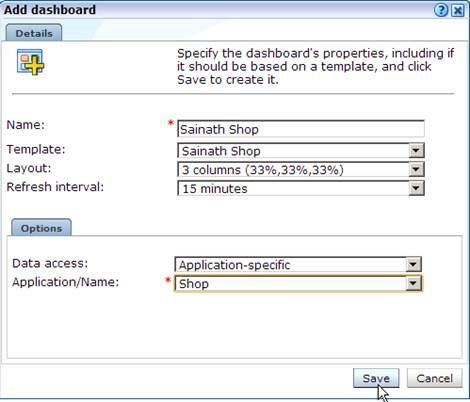
Specify the name of the new dashboard, and you can also change the layout and refresh interval at this point. The dashboard being created will be application-specific and use the Shop application.
Click on the Save button.
We can see that the new Sainath Shop dashboard has been created.
The modified widget "Sainath Error Category" and the new widget "Sainath Page Views and Failures" are also visible on this page.
Drill Down Diagnostics
Now, move to the Dashboard for the Medrec application.
The dashboard has been created specifically for IT support staff. It contains widgets that would assist in typical problem solving, such as the "slowest E-url" widget, and a "traffic per Server" widget.
Click on the cube icon to browse data in the “slowest E-url” widget.
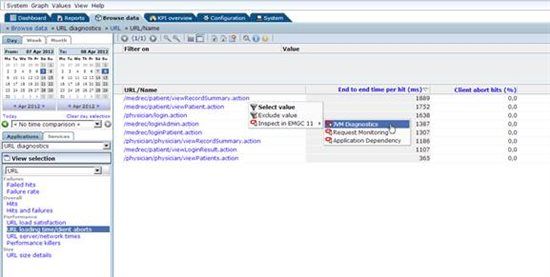
The slowest URLs in this application are now displayed.
Please note that there is close integration of RUEI with Enterprise Manager diagnostics. To analyze the slowest URLs further, you can drill down into Enterprise Manager diagnostics tools and this will help you to understand whether the bad performance was caused by a database issue or a middleware issue.
Select the slowest URL name which is the one with the highest end to end time per hit (ms). Right click on it, and select “Inspect in EMGC .. JVM Diagnostics” from the drop down menu.
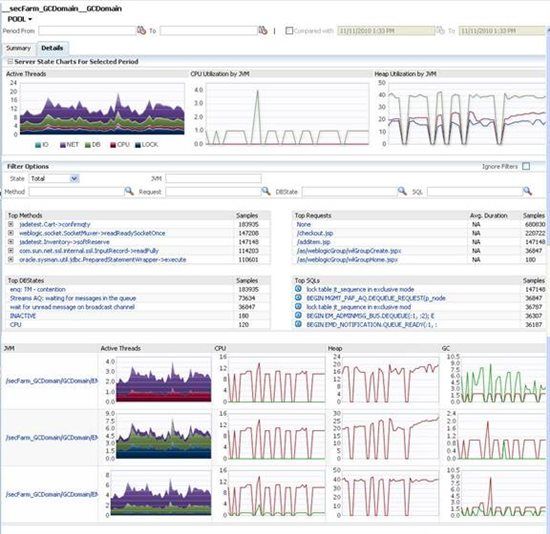
You have now drilled down into JVM diagnostics, which is a feature of the WebLogic Server Management Pack EE (Enterprise Edition) in Enterprise Manager. The drill down occurs in full context and all the pertinent details about the slowest function are passed by RUEI to Enterprise Manager.
JVM diagnostics can now be used as the next step to analyze the activity of the JVM in that period. You can look at the Active Threads, CPU Utilization and Heap Utilization by the JVM. The Top Methods, Top Requests, Top DBStates and Top SQLs can all be analyzed.
Close the JVM diagnostics window, and move back to the slowest E-url Data set in RUEI.
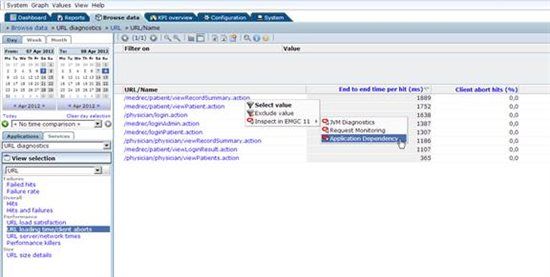
Right click on the slowest E-url again, and this time select "Inspect in EMGC .. Application Dependency" from the drop down menu.
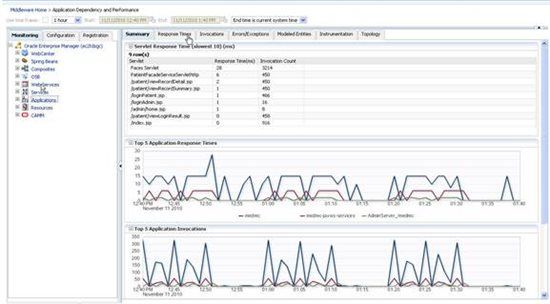
This drills down to Enterprise Manager again and displays the Application Dependency and Performance (ADP) screen. This capability allows you to model and monitor composite applications. This too is a feature of the WebLogic Server Management Pack Enterprise Edition in Enterprise Manager
The slowest requests have been pre-selected in ADP during the drill down from RUEI. Drilling down in this way will help in understanding how the slowest E-url request was fulfilled over multiple tiers of the application infrastructure, including the delay that occured at each step of the process.
Move to the Response Times tab.
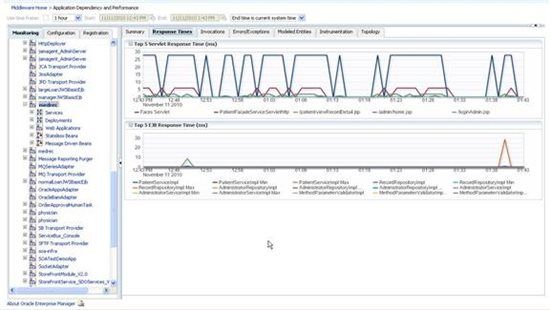
The applications hierarchy has been expanded, and the medrec application selected. In the Response Times tab, you can see the Top 5 Servlet Response Time (ms) and the Top 5 EJB Response Time (ms).
We will continue looking into RUEI in Part IV of this article series. Part IV has been published here.
Start the discussion at forums.toadworld.com