We discussed the RUEI installation requirements and other matters, and had arrived at the RUEI Executive Dashboard.
It is possible to restrict access to dashboards based on the application, so that a RUEI user can monitor one or more applications as per authorization, and not have access to the others.
At a quick glance, each dashboard provides an overall visibility into the availability and performance of your web application as experienced by the end user.
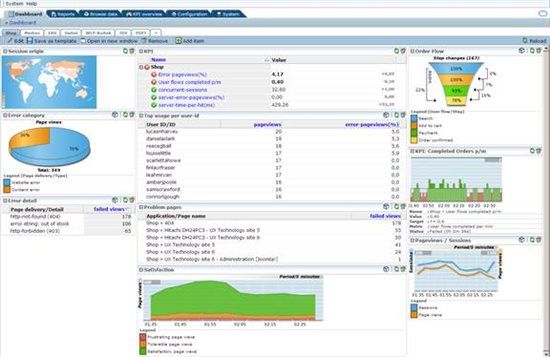
Various widgets are displayed – graphical or tabular or map views, and these are fully customizable. Widgets can be moved around, and they can be removed and new ones added on any of the dashboards (if a user has sufficient rights to do so).
So it is possible to have different types of dashboards – such as one for executives, another for IT support staff and so on, depending on the types of widgets that are created and displayed on each dashboard. For example, the Session origin widget shows a world view of the sessions in the web application. This would be useful for senior management to know where their customer sessions are coming from, and in which countries they need to re-do the marketing of their product (since they are not selling in those countries).
The KPIs set up for this application are also seen at the top of the page – the red KPIs show that these have not been met. This would also be of interest to the management and business owners.
The Order Flow widget on the right side of the page is also known as the “Transaction Funnel” since it portrays how the users are progressing on the web site in one step of the flow to the next, and you can drill down and pinpoint the reasons they are dropping off in between. This is an extremely important facet for the business owners since it directly reflects company revenue – the more the customers that follow through their order to completion, the better. Otherwise you obviously have a site that is giving a bad web experience, and it is putting off users by the droves.
The Error Category widget shows the breakdown of the main errors being experienced, and this is useful for trouble-shooting. Likewise, there is a list of Problem pages as well as the Top Users.
We will now customize the Error Category Widget. Click on the name of the widget, and the following pop-up window appears.
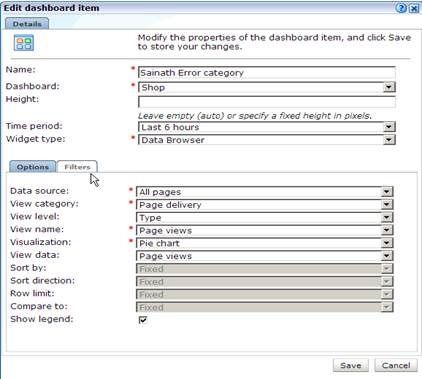
Rename the widget to "Sainath Error Category". You can place the widget on any of the dashboards by simply selecting a dashboard from the drop down box.
Leave the height field empty (not zero) for auto-sizing of the widget, otherwise specify a fixed height between 40-1200 pixels.
Change the Time period to "Last 6 hours". The other options are Last 5 minutes, Last hour, Last 12 hours and Last 24 hours.
The Widget type for the Error Category defaults to "Data Browser". The other widget types possible are Alert Log, Map, Multiple KPIs, Multiple SLAs or a Single KPI.
In the Options section, the Data source is set to "All pages". This can be changed to either of All sessions, All user flows, Key pages, URL diagnostics or All functions. To aid in problem analysis, you can select Failed pages, Failed URLs, Slow URLs or Failed functions. Optionally the data source can be Oracle Suites such as Weblogic Portal, Siebel, E-Business, PeopleSoft, JD Edwards or their respective URL diagnostics.
The View category, by default is Page delivery. This can be changed to Page URL, Application, Domain, Period, Protocol, Server named location.
The View level can be set to Type or Detail, and the Visualization to either Pie chart or value list. View data only has Page views.
Move to the Filters tab.
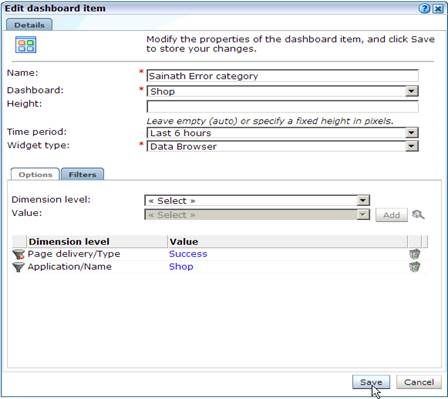
In the Filters tab you can choose the Dimension level to be used in the filter. The current dimensions used to filter out the traffic for this widget, are seen to be the Application Name of "Shop", and the Page delivery type of "Success".
You can select and add different dimension levels from the dropdown box such as Application Name / Page group / Page name, or Domain Name, or Page delivery type / Detail, or Page URL Group / URL / Full URL. You can also select Protocol Type, or Server named location Group / Name / IP.
Click on the Save button. The modified widget appears as follows.
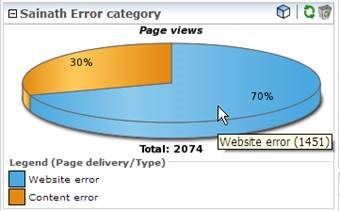
The new name is visible, and more errors are displayed since we have specified the last 6 hours.
Click on the “Save as template” button at the top of the dashboard. This allows you to save your current dashboard as a template.
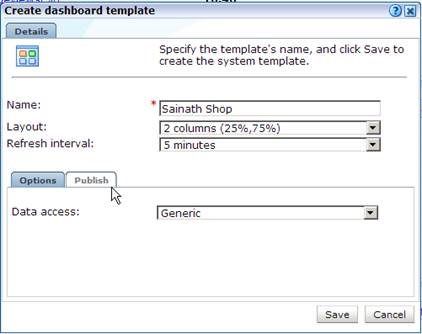
Name the template appropriately. You can change the layout at this point to 1,2 or 3 columns with different width percentages. The Refresh interval of the dashboard template can be changed to Manual, or to refresh automatically at intervals of 5, 10 or 15 minutes.
In the Options tab, Data access can be changed to Generic, Application-specific, Suite-specific or Service-specific. In the case of the latter three specific templates, all dashboard items are bound to the specified filter except for KPIs and alert lists. This is not the case for generic templates, that do not enforce any pre-configured filter.
In this way, if the administrator has created an application specific template, the template will have a pre-configured and enforced application filter since it is only allowed to see one application. A RUEI user with rights to this application will be able to use the new dashboard and access the application data, however it is not possible for the same user to re-use the dashboard for monitoring the network data of other applications.
We continue looking into the RUEI dashboard in Part III of this article series. Part III is here.
Start the discussion at forums.toadworld.com