In many organizations, the IT department and its administrators monitor the performance of the database servers, databases, web servers and application servers. They are happy when these are working normally, and show no signs of performance degradation.
However, even at such times of perfect performance, the actual web site users may be experiencing slow speeds or errors on the web site pages. The IT department would not have any idea about what the users are experiencing – since the administrators would only be considering the database and server performance, and not the experience of the real user.
Understanding user experience is critical for any business relying on web applications, either external or internal. If a company has an online store selling some products on the internet, they can lose a large number of customers if the user experience on the web site is poor. The company will only know about this experience much later, when the users start calling the helpdesk and report the problems they are experiencing on the web site.
Even after the issue has been reported, the helpdesk spends an inordinate amount of time in trying to reproduce the issue, in an attempt to solve it and help the user. Many different problems can be experienced by an end user, such as being kicked off a page, unable to proceed, error messages, slow response time, difficulty in navigation, and so on. Reproducing such issues takes a lot of guess work and is very time consuming. And all the users may start calling in at once, adding to the chaos.
There may also be external users – customers – who do not bother to report any issue, but just cancel the transaction and go to a competitor web site. This scenario is worse, since the company loses the customer at that point as well as for the future, since such customers usually do not come back again to the web site where they have had major performance issues, or have been unable to navigate with ease.
The service levels of the application are not met, and they are not measured properly in the first place – by just monitoring the availability and performance of servers and databases, and ignoring the real user experience.
Real User Monitoring
The business therefore needs to start monitoring the experience of the real user. They need to set up Key Performance Indicators (KPI) that reflect the experience of the end user. Service Level Agreements (SLAs) also need to be set up particularly at the business services level, in addition to the normal SLAs set up for the infrastructure availability and performance.
Oracle Real User Experience Insight (RUEI) is an Oracle Enterprise Manager product, that allows the business to do just that. Although it is installed separately, it has a close integration with Enterprise Manager capabilities, such as diagnosing issues with web applications.
RUEI can be used to monitor end user activity and business services, so as to ensure that web applications perform to expectations. RUEI also provides analysis and notifications when the performance of the web site is not as per expectations, and allows you to drill down and analyze the end-user behavior on the web-site, page by page, to understand exactly what the user went through – which of the pages were slow, had acceptable performance, if any errors were received, and so on.
This can lead to an improvement of the business processes by streamlining the flow and removing bottlenecks. User retention can be increased. In many cases, IT is alerted before the users start complaining, and they can start working on the resolution and prevent further loss, such as in the case of more and more users cancelling their transactions in the event of a bad experience or error on the checkout page.
Every company would normally have one or more firewalls shielding it from the internet. Behind the firewall, there are network switches that route the traffic to the appropriate web servers, which in turn are connected to the application servers and database servers. This is a simplified version of a network configuration which in real life would tend to be much more complex, but it would suffice for understanding.
Oracle RUEI works at the switch layer, by capturing network traffic via a span or tap port (a network tap is preferable and recommended). The software sits on a separate Linux box and has its own Oracle database.
The sizes are large. For a stand-alone RUEI server installation, a minimum of 700 GB will be required. For more details about requirements and installation, please refer to the Oracle RUEI Installation Guide here.
RUEI starts capturing network data including information such as the client IP address, server / gateway IP address, cookie / session ID, client browser type, GET & POST requests, requested URL (page / object), referrer and so on. The response to the request is also noted – whether the page hit was ok, or there was a web site or server error. RUEI also collects the content of the page such as any functional errors or shopping cart details, and whether the page was delivered, aborted or there was a network timeout.
The technology used by RUEI is called Network Protocol Analysis (NPA) Technology. This does not impact the performance of any web application being monitored, since it is passive monitoring and network data is collected non-intrusively.
The applications do not need to be modified in any way to enable RUEI monitoring. If the client network has SSL traffic enabled, this can be captured and decrypted as well.
Executive Dashboard
Once installed, you can login to Oracle RUEI as admin. The following screen appears.
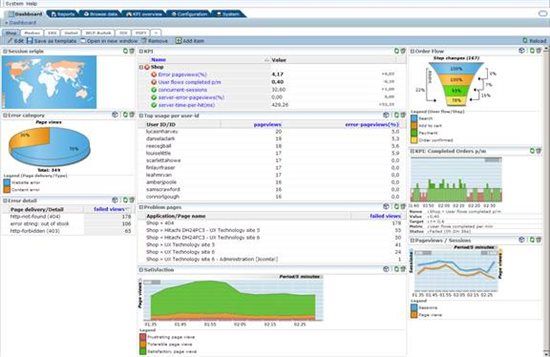
This is the RUEI Executive Dashboard. As we can see, there are different dashboard tabs for each web application being monitored by RUEI for the Sainath company.
We will continue discussing the dashboard in Part II of this article series. Part II is here.
Start the discussion at forums.toadworld.com