Did you know that you can predict the future performance for individual SQL statements and use these predictions to mitigate future performance issues using the Toad® for Oracle Spotlight® on Oracle feature?
Available in the Toad for Oracle DBA Edition, Spotlight on Oracle not only helps you mitigate any performance issues today but, also empowers you to be proactive and prevent any potential performance issues down the road.
This blog has 3 parts. Part 1 will remind you to configure Spotlight on Oracle Predictive Diagnostics so you can collect and analyze performance metrics in order to predict the future behavior of the Oracle database. Part 2 will teach you how to identify performance issues you're having today and may be able to help you identify future issues with problem SQL statements that don't scale, potential bottlenecks and predict when data resources could reach full capacity. Part 3 will connect you to another blog that will teach you how to fix the identified SQL statements in SQL Optimizer.
Part 1: First-time users, configure Spotlight on Oracle Predictive Diagnostics — Quick Start
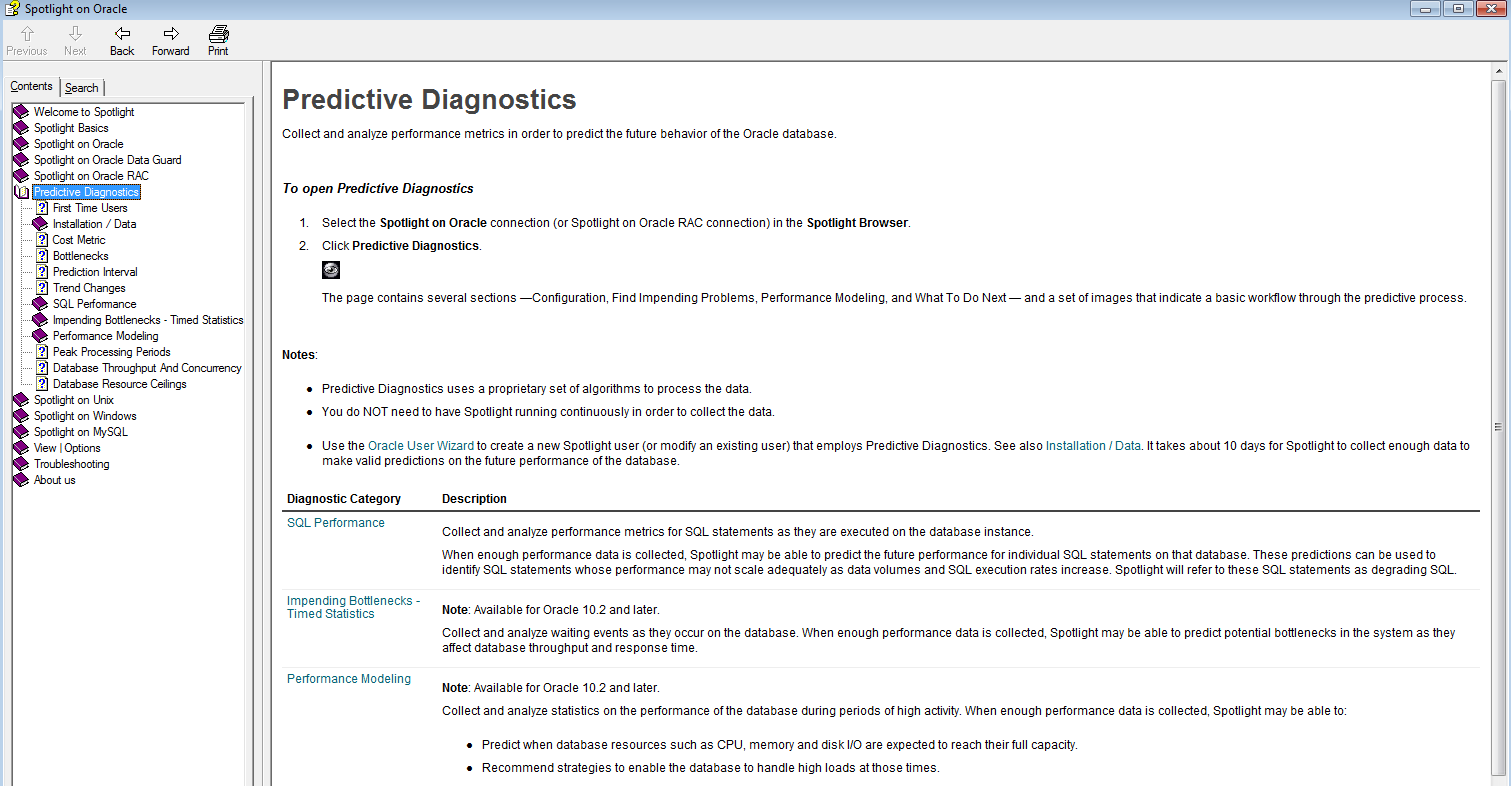
Predictive Diagnostics is one of the many powerful features available in Toad for Oracle’s Spotlight. It will enable you to collect and analyze performance metrics in order to predict the future behavior of the Oracle database. If you have never used it, you need to configure your system. This takes just a few minutes by following the easy automatic set up instructions. If you need additional help, refer to the product Help. Below is a screen shot of the help screen. Right below Predictive Diagnostics is First Time Users additional help.
Part 2: Predict the future performance for individual SQL statements
Note the "eye" icon circled in red in the top menu bar in the picture below.
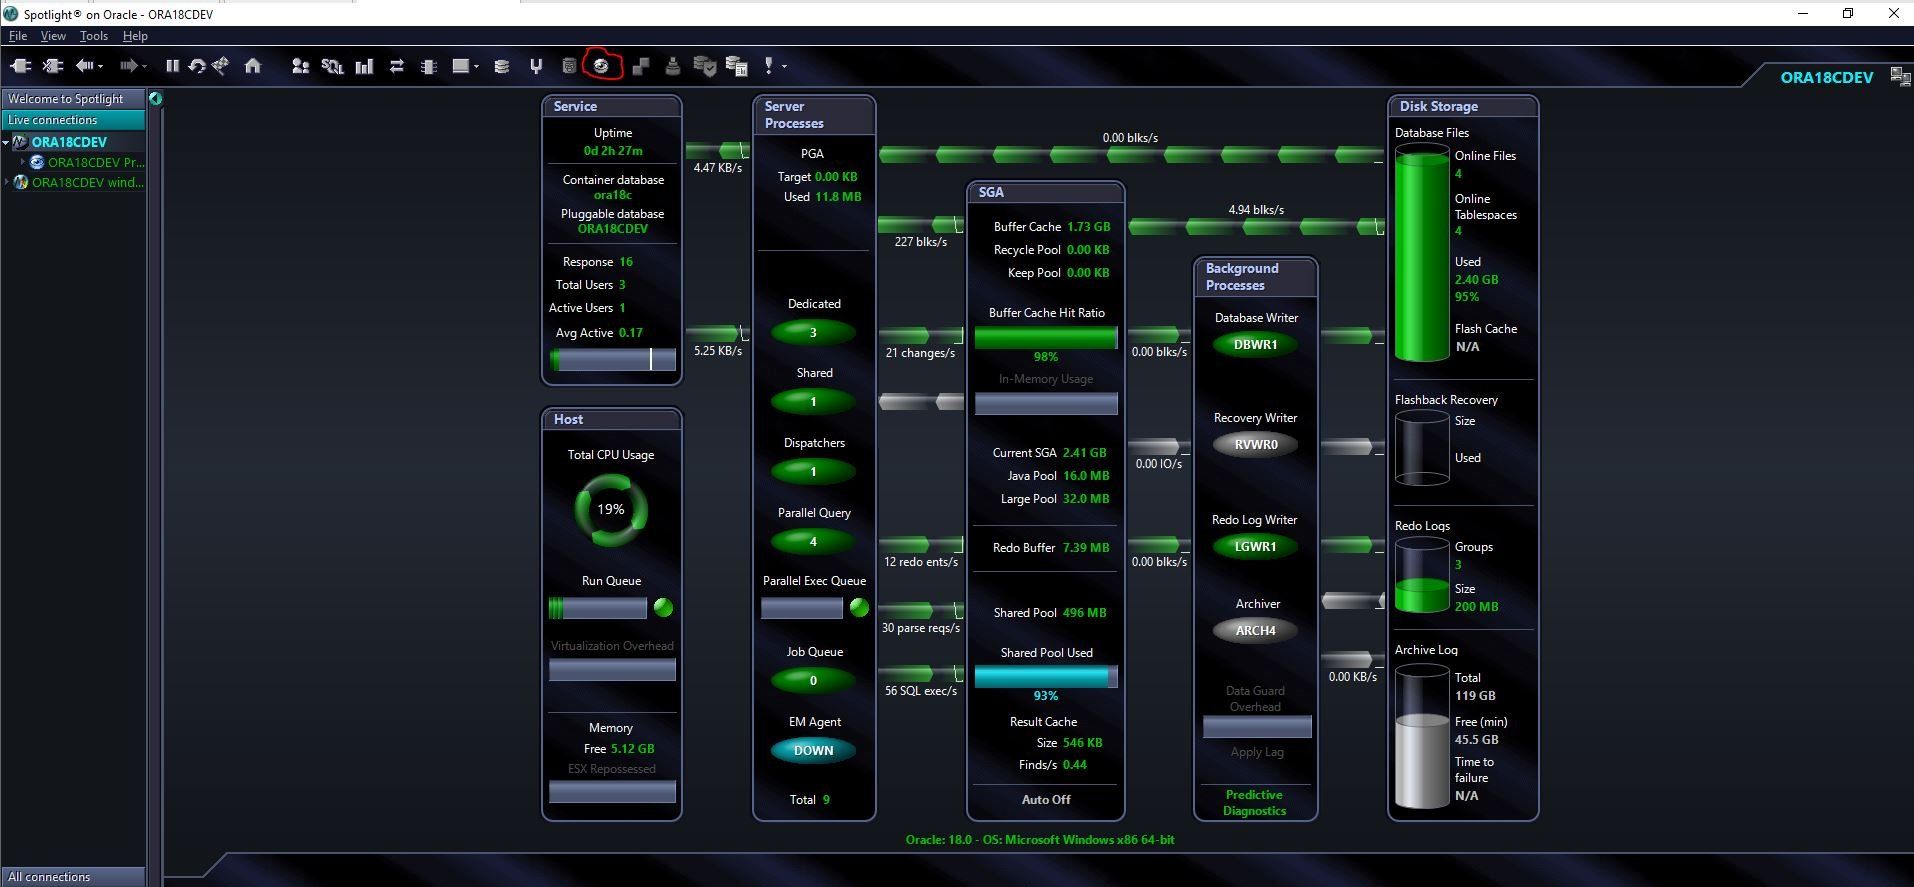
By clicking on the "eye" icon, you will be brought to the Predictive Diagnostics wizard and presented with a list of alternatives to choose from. (Pictured below.)
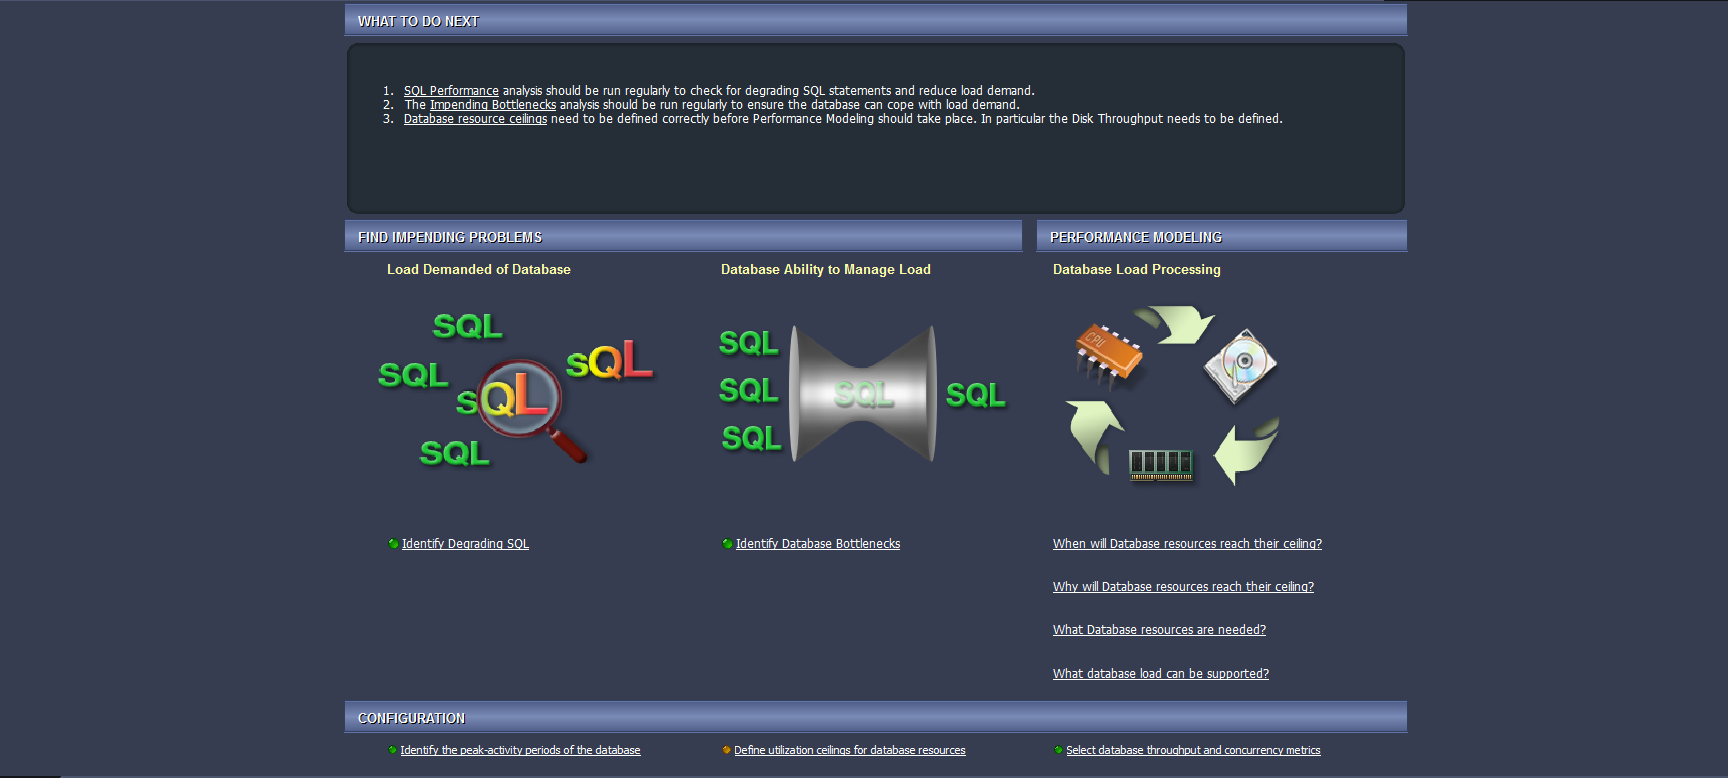
As you see, the Spotlight Predictive Diagnostics feature allows you to do much more than Identify Degrading SQL statements — it can:
- Find impending problems
- Identify Degrading SQL
- Identify impending Database Bottlenecks
- Do Performance Modeling
- When/why will the database resources reach their ceiling?
- What database resources are needed?
- What database load can be supported?
Identifying degrading SQL
In our example, we will focus on Identifying degrading SQL.
Let's begin by configuring your data collection.
In the left column on the Predictive Diagnostics screen, click on Identify Degrading SQL. You will be able to walk through the following wizard.
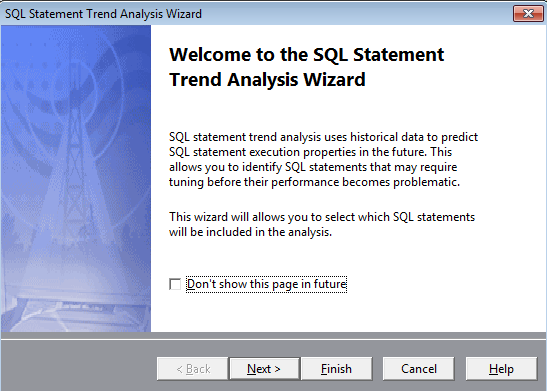
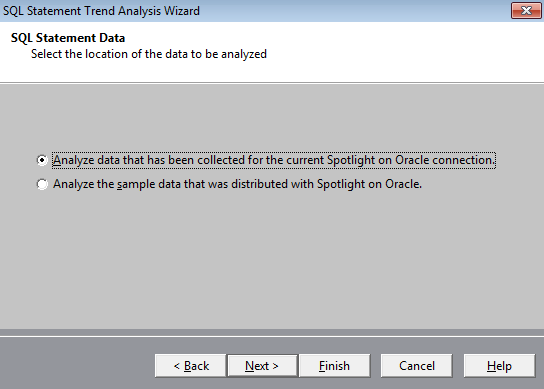
After reading the brief explanation of the SQL Statement Trend Analysis Wizard, click on Next and you’ll be able to Analyze data collected for the existing Spotlight on Oracle connection or just the sample data. See the below screen shot.
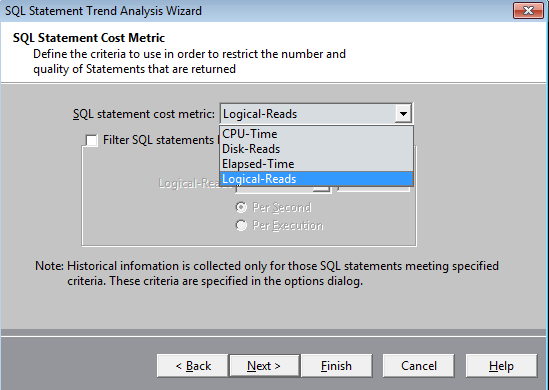
Clicking on Next, you can refine your search criteria for SQL statements that will be returned.
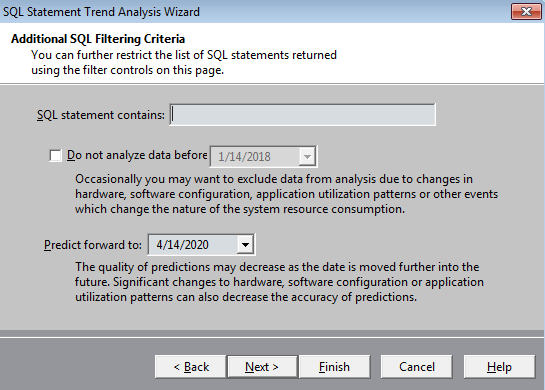
On the next screen, you can further restrict the number of SQL statements and …
…define a date for your prediction.
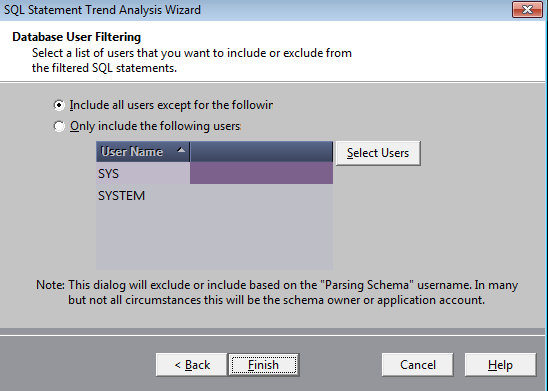
On this last screen, you can select a list of users you want to include or exclude.
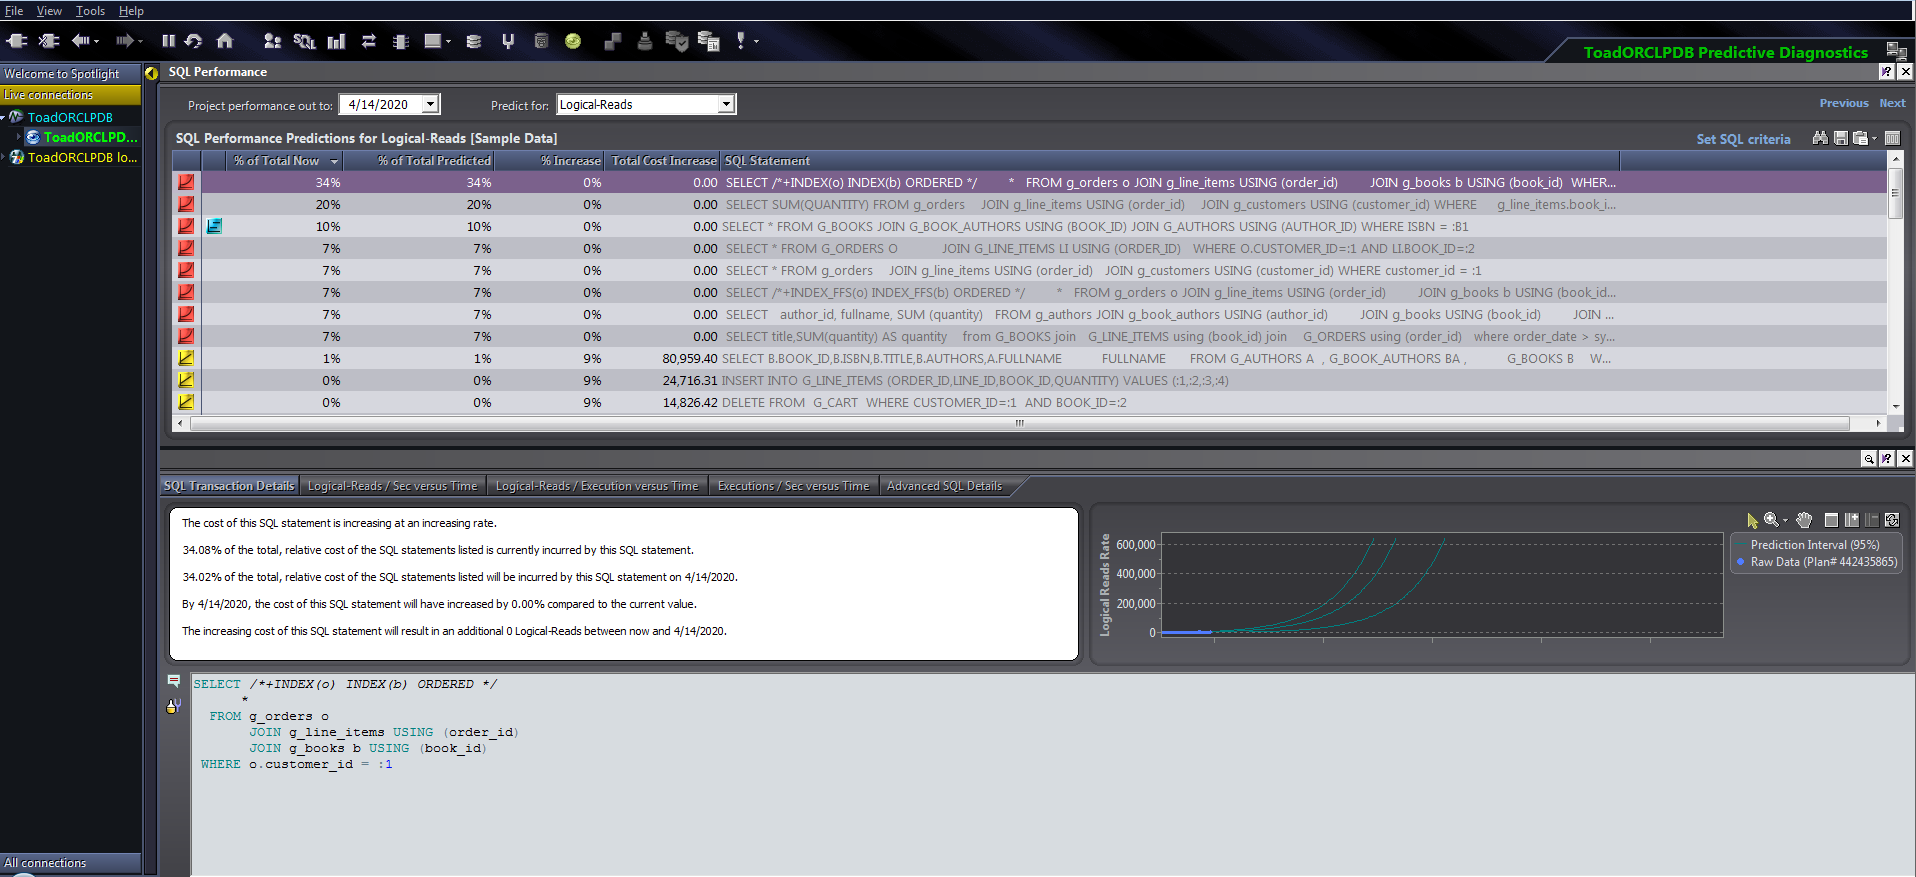
Once you click on finish, you will see a list of all your SQL statements that are degrading over time with the most severe being in red and bubbling to the top.
For each statement, you can see more detailed information along with trending graphs.
You can even alter the date on this screen as you can see it the top left corner.
Now that you've configured the collection, you should give it enough time to gather meaningful metrics (around 10 days).
After waiting about 10 days, Spotlight will have gathered enough data and may be able to predict the future performance for individual SQL statement on that database. These predictions can be used to identify SQL statements with performance that may not scale adequately as data volumes and SQL execution rates increase.
If you're using Oracle 10.2 or later, you can collect and analyze waiting events as they occur on the database. When enough performance data is collected, Spotlight may be able to predict potential bottlenecks in the system as they affect database throughput and response time.
Lastly, if you're using Oracle 10.2 or later, collect and analyze statistics on the performance of the database during periods of high activity. When enough performance data is collected, Spotlight may be able to predict when database resources such as CPU, memory and disk I/O are expected to reach their full capacity. And, recommend strategies to enable the database to handle high loads at those times.
With Spotlight on Oracle, you can ensure your databases are performing optimally now and into the future!
What are you waiting for—try Spotlight on Oracle out today, available in the Toad for Oracle DBA Edition!
Part 3: Bring the highlighted statement into a SQL Optimizer session and tune it
From here, you can bring the highlighted statement into a SQL Optimizer session and tune it. Follow this link to
Try or upgrade Toad for Oracle DBA Edition |
Useful resources
Datasheet: Spotlight on Oracle
Related Toad World blog posts
Questions?
Have questions, comments, or an idea for a new feature? Interact with experts on theToad for Oracle forum on Toad World®.
If you think your colleagues would benefit from this blog, share it now on social media with the buttons located at the top of this blog post. Thanks!
Start the discussion at forums.toadworld.com