As a former DBA, I don’t like surprises. DBAs always want to know ahead of time if an issue is about to occur or is occurring, and we never want to be surprised by hearing there is an issue. When a developer or someone else tells us “Hey, there is something wrong with the database,” we immediately wonder what is going on and why didn’t I know about it? Had I known about the issue, we could have begun the research. How many times have we gone through this scenario, only to find out that everything was running normally and that the issue was “X” minutes ago or longer? This scenario always leads to the infamous phrase: “If it happens again, let me know.” But if we’d had Spotlight running during the time of the issue, we could have avoided this breakdown in communication.
NOTE: Spotlight on Oracle is meant for real-time diagnostics and not monitoring, so the tool will need to be running in order for us to use the following features.
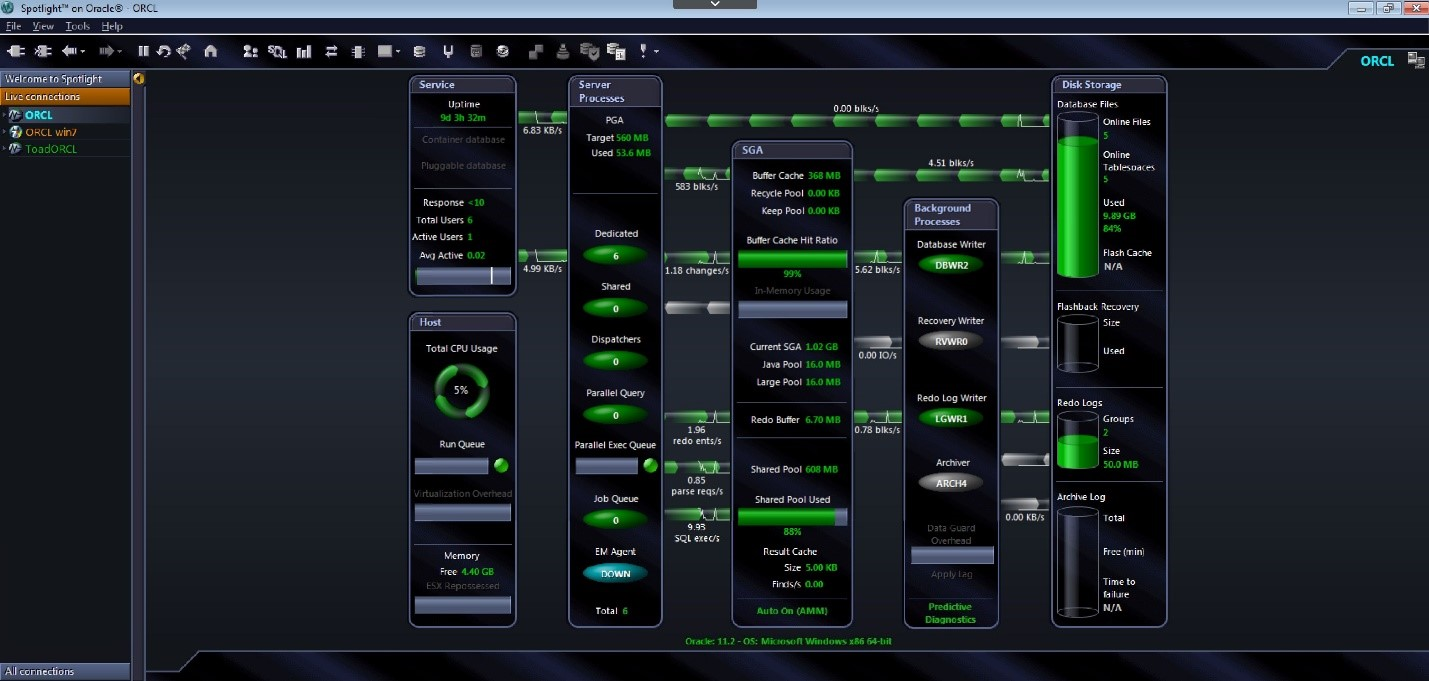
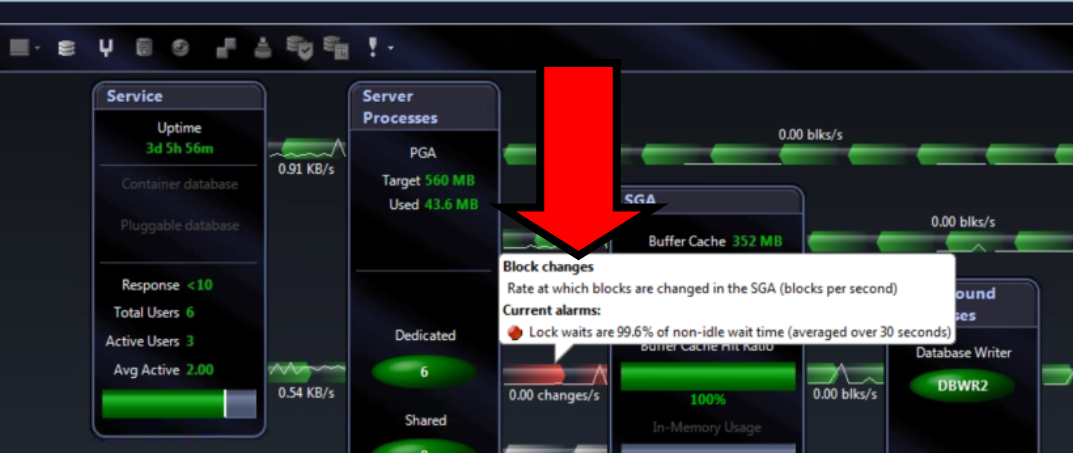
Let’s say someone reports an issue, we can go to Spotlight for Oracle to see what the issue may be. We have Spotlight open and we see that all is normal.
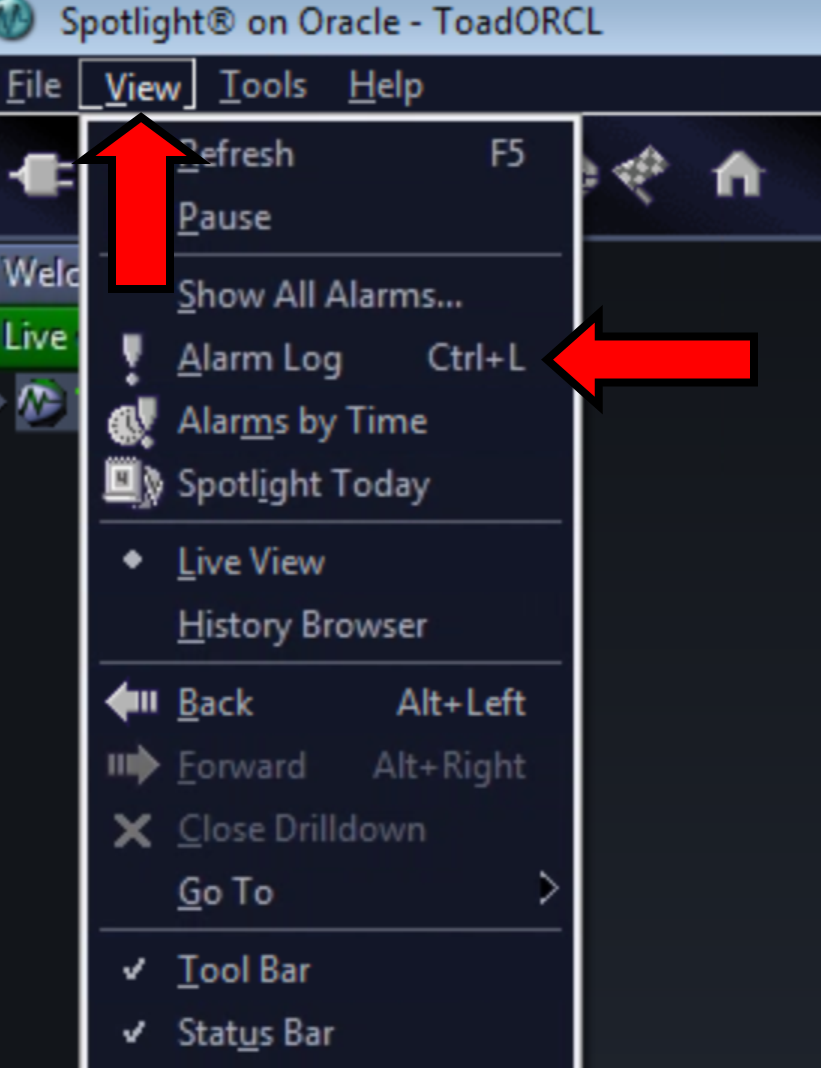
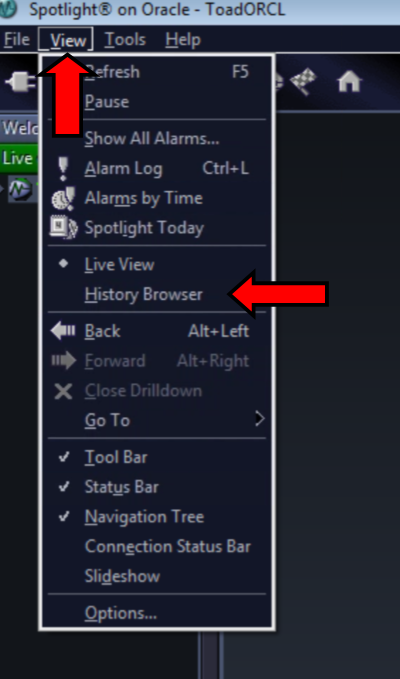
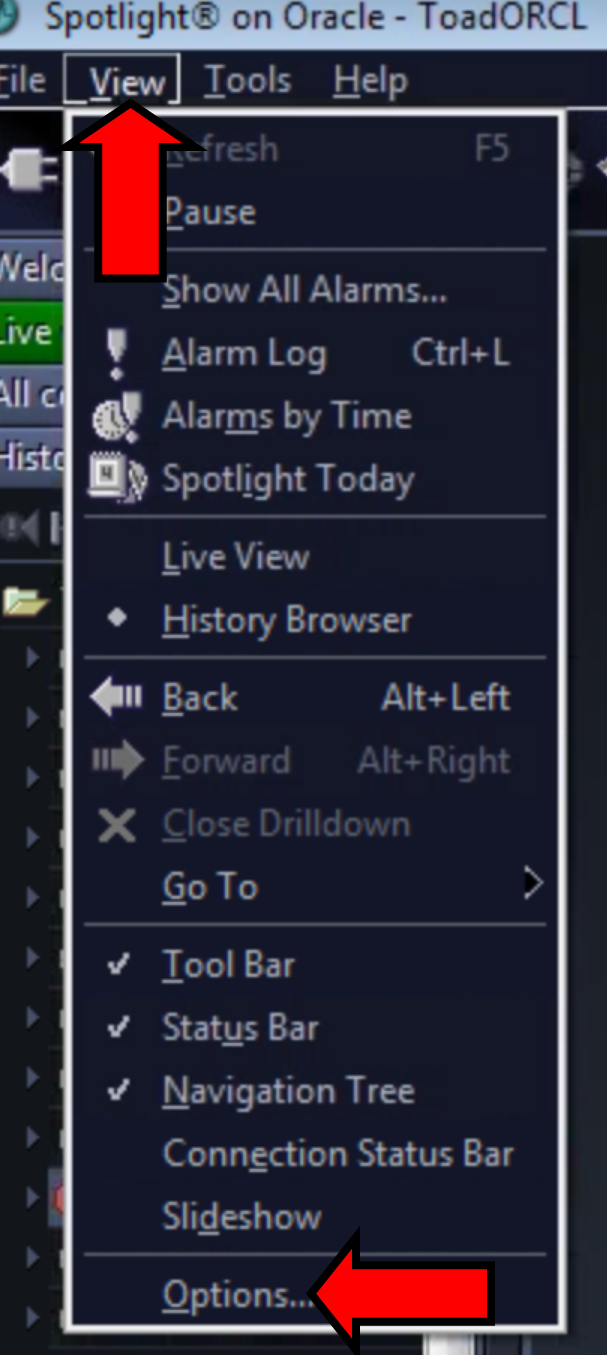
However, there was an issue that occurred 20 minutes ago. We can then go to the Alarm Log by doing a Ctrl+L command or pressing the Alarm Log button:
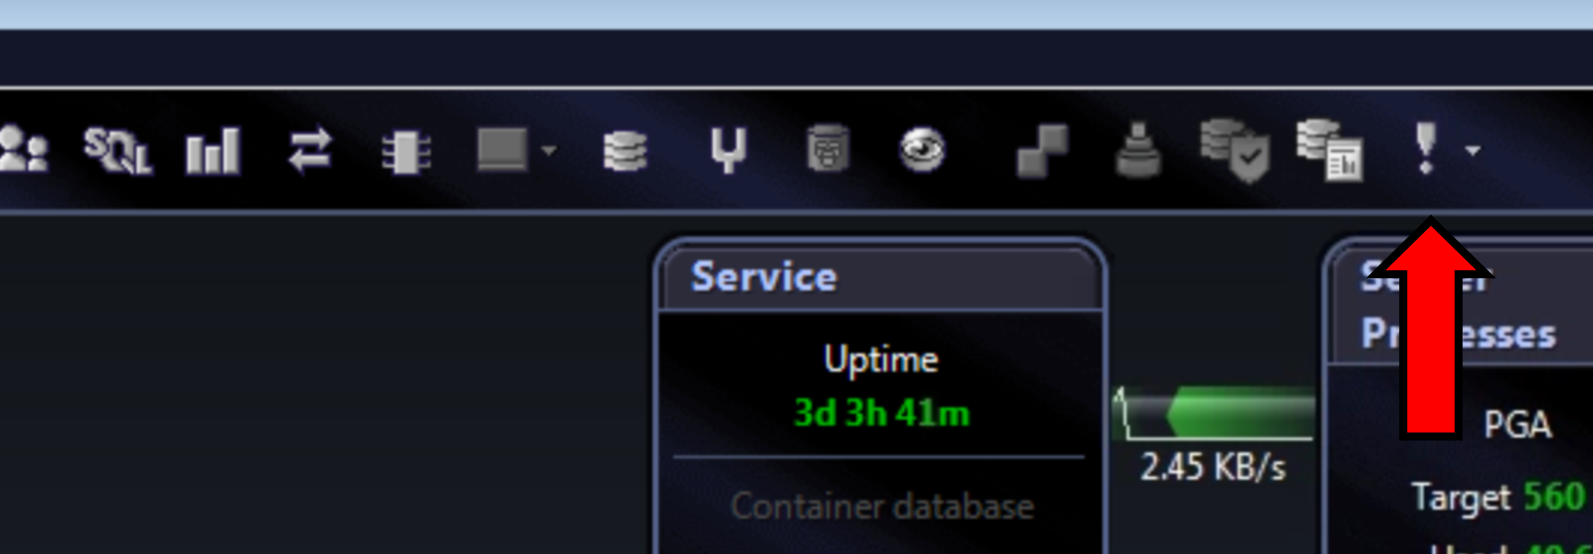
Another way we can go to the Alarm Log is by using the toolbar:
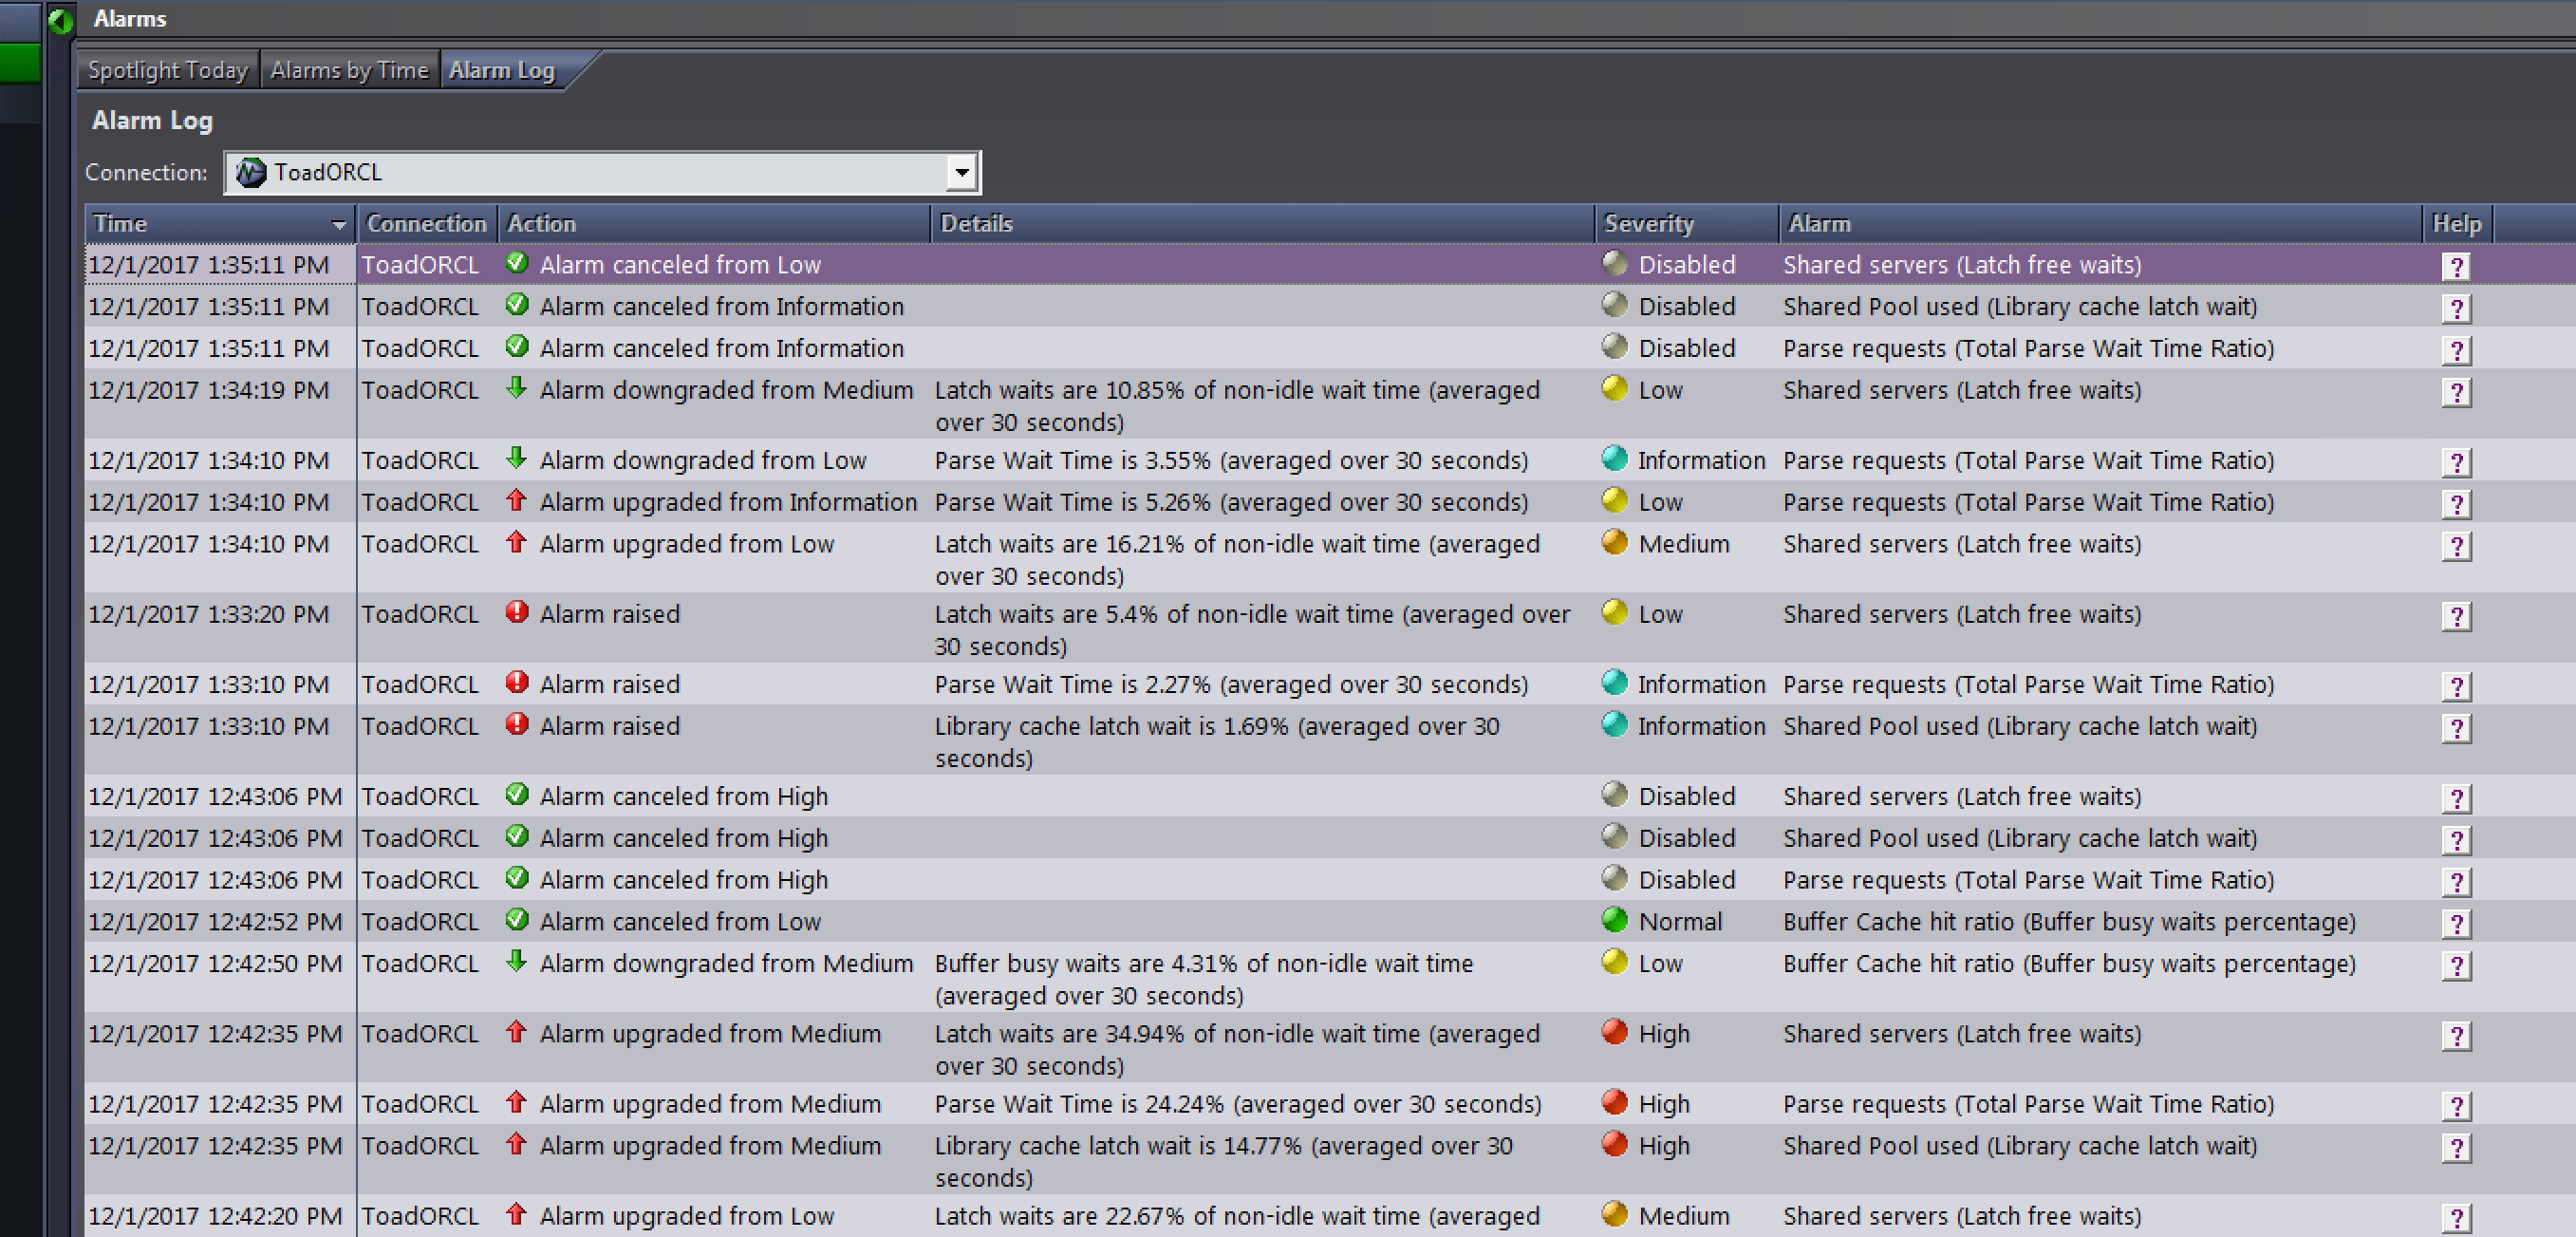
Once in the Alarm Log, we can see all the alarms that have occurred and even go to the specified time to see what might have occurred.
But you are probably thinking “There has to be a nicer, more appealing way to see the alarms than going through logs.” Well, there is!
We can look at the History Browser and get a visual presentation of what was occurring.
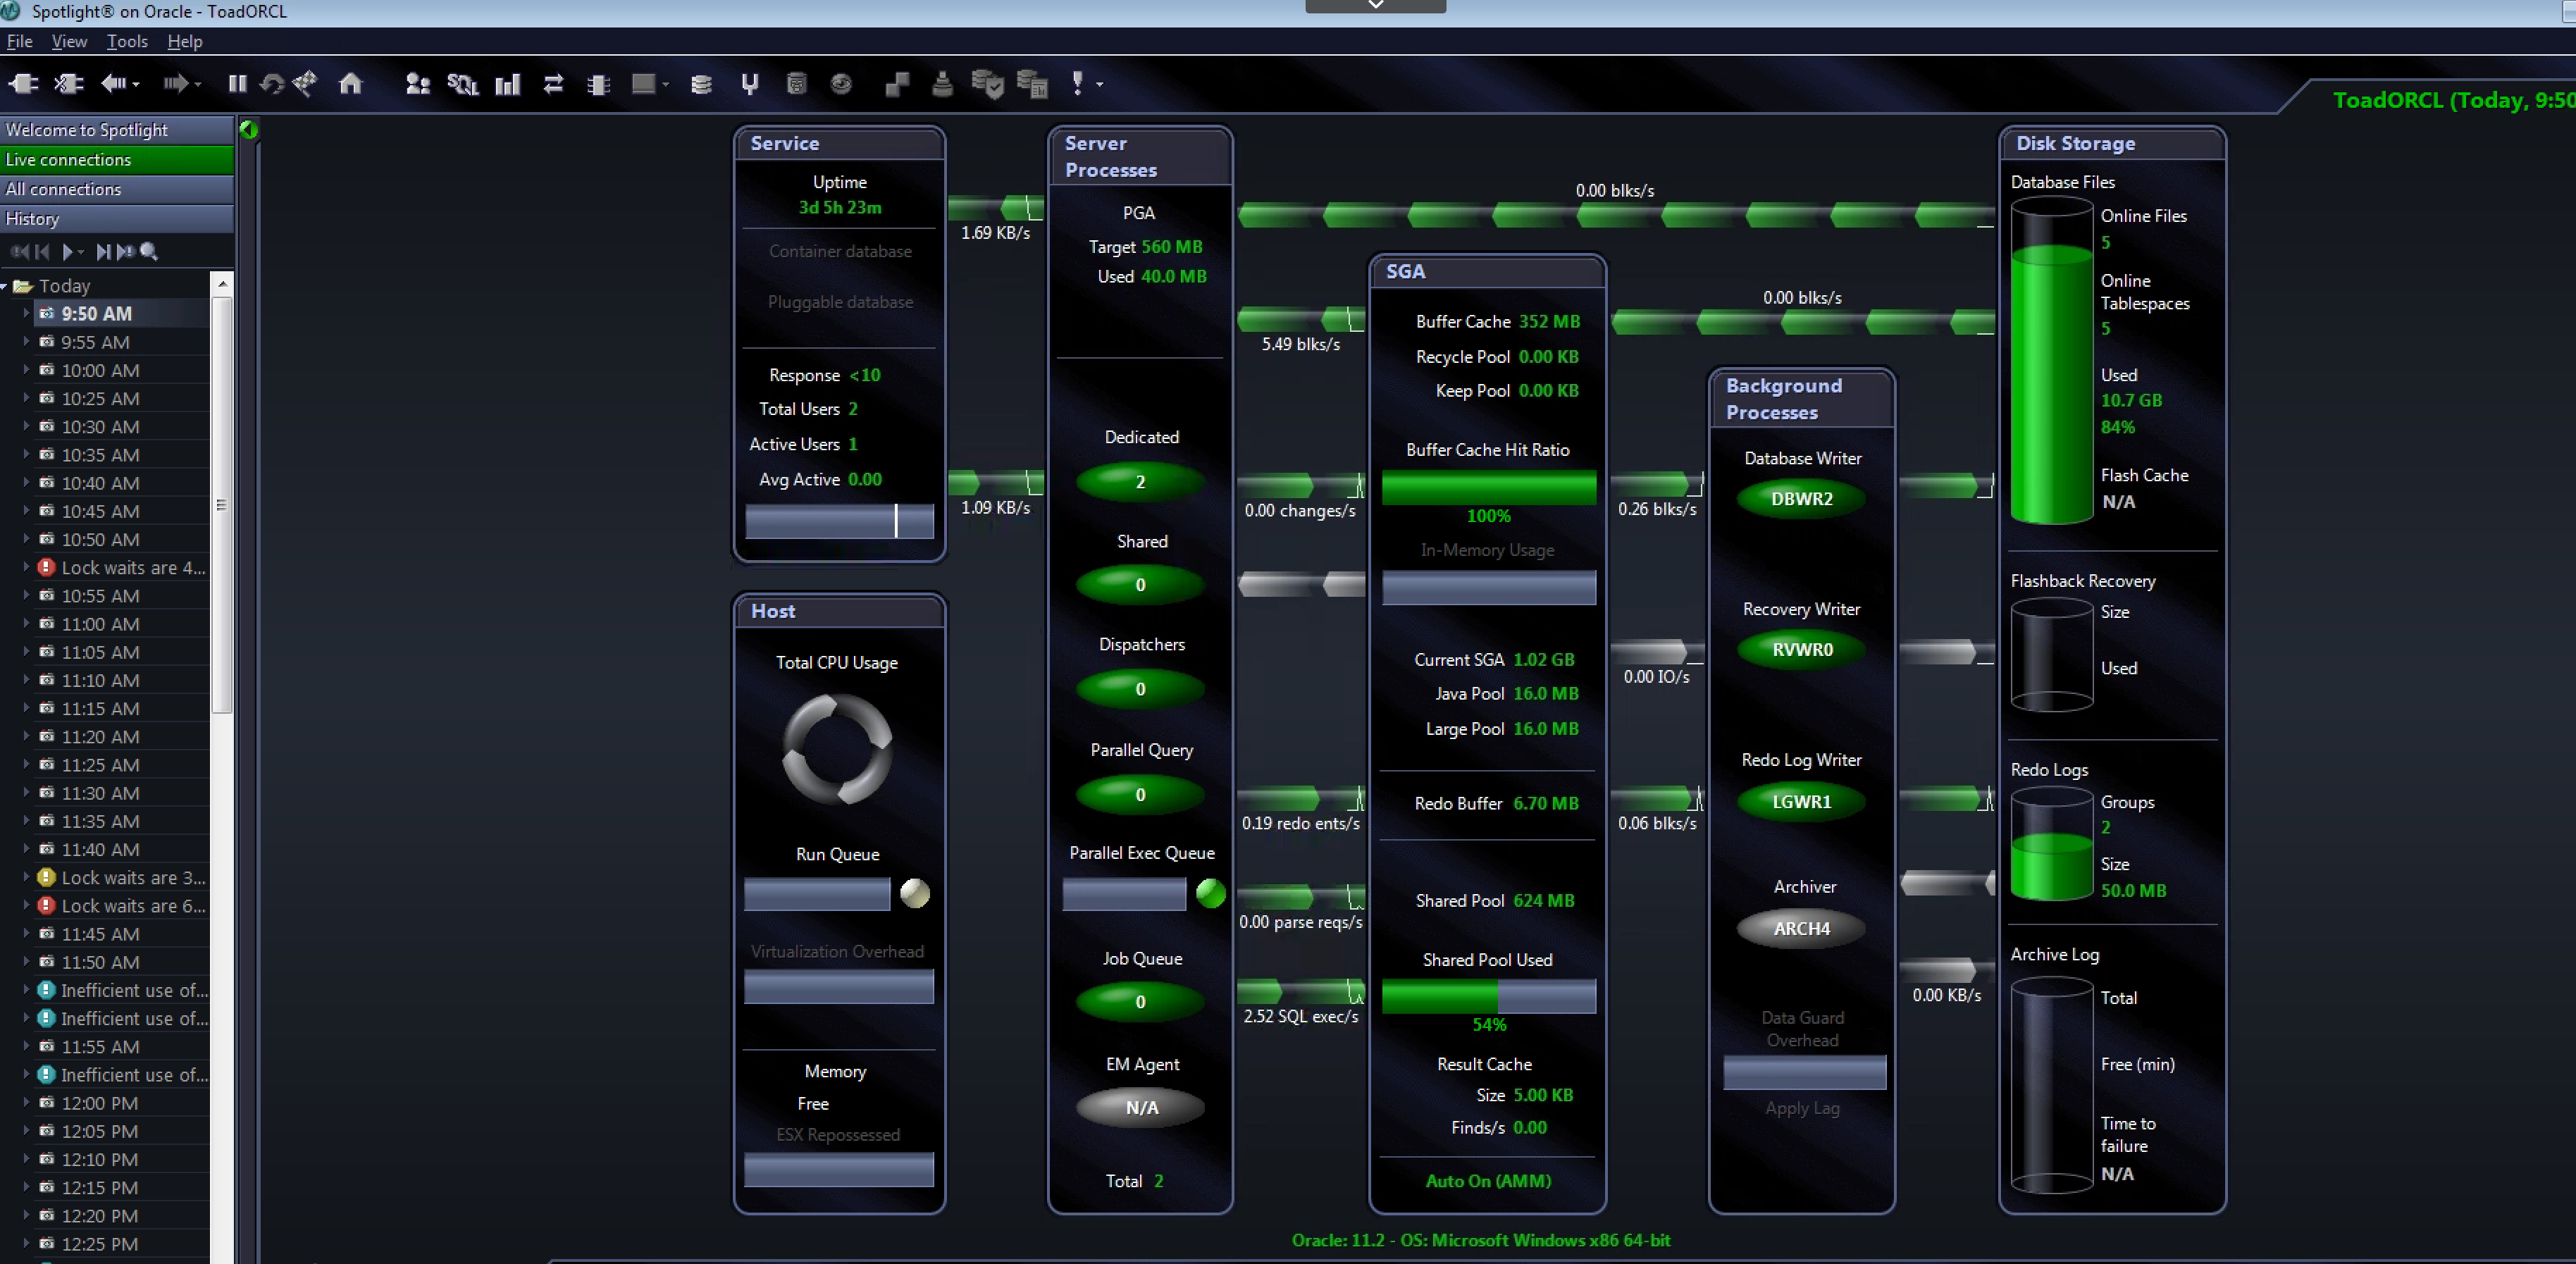
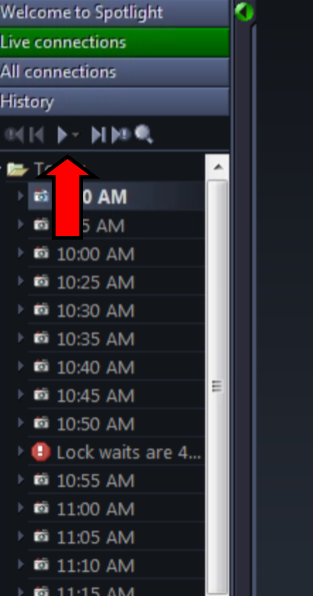
In my opinion, one of the great features of the History Browser is the ability to replay, pause, forward, and rewind through the history. This feature allows you to see the different states of the database, giving you the ability to see when and where the issues began.
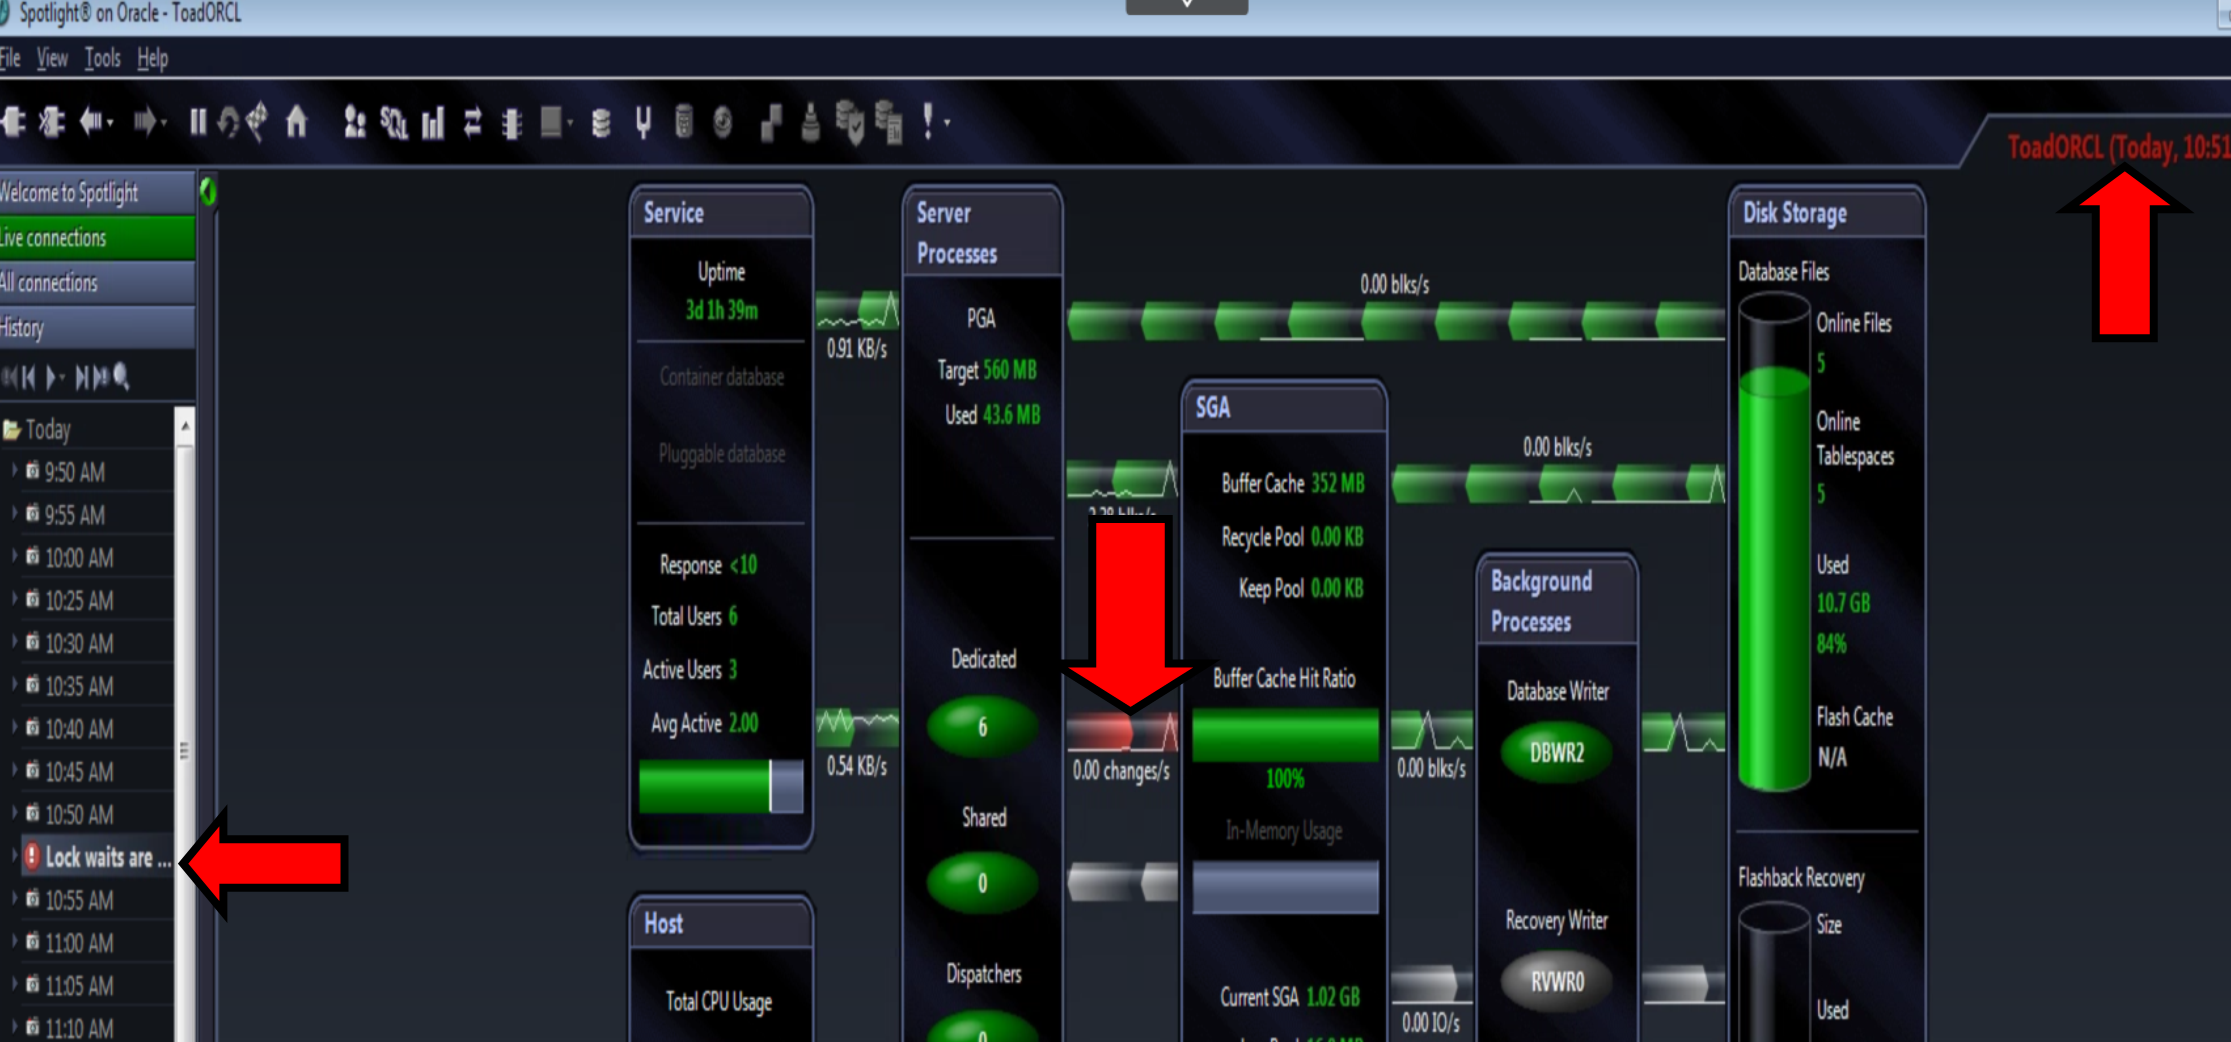
NOTE: Because we have gone back in time/history, using Spotlight we will not be able to drill down and see the actual statements that were causing the issues. However, we will be able to get more information that will help us narrow things down and to help us determine if this is an issue that needs to be investigated further.
With this information, we can now go to a specific Oracle Snapshot and determine what statement(s) may have been the issue.
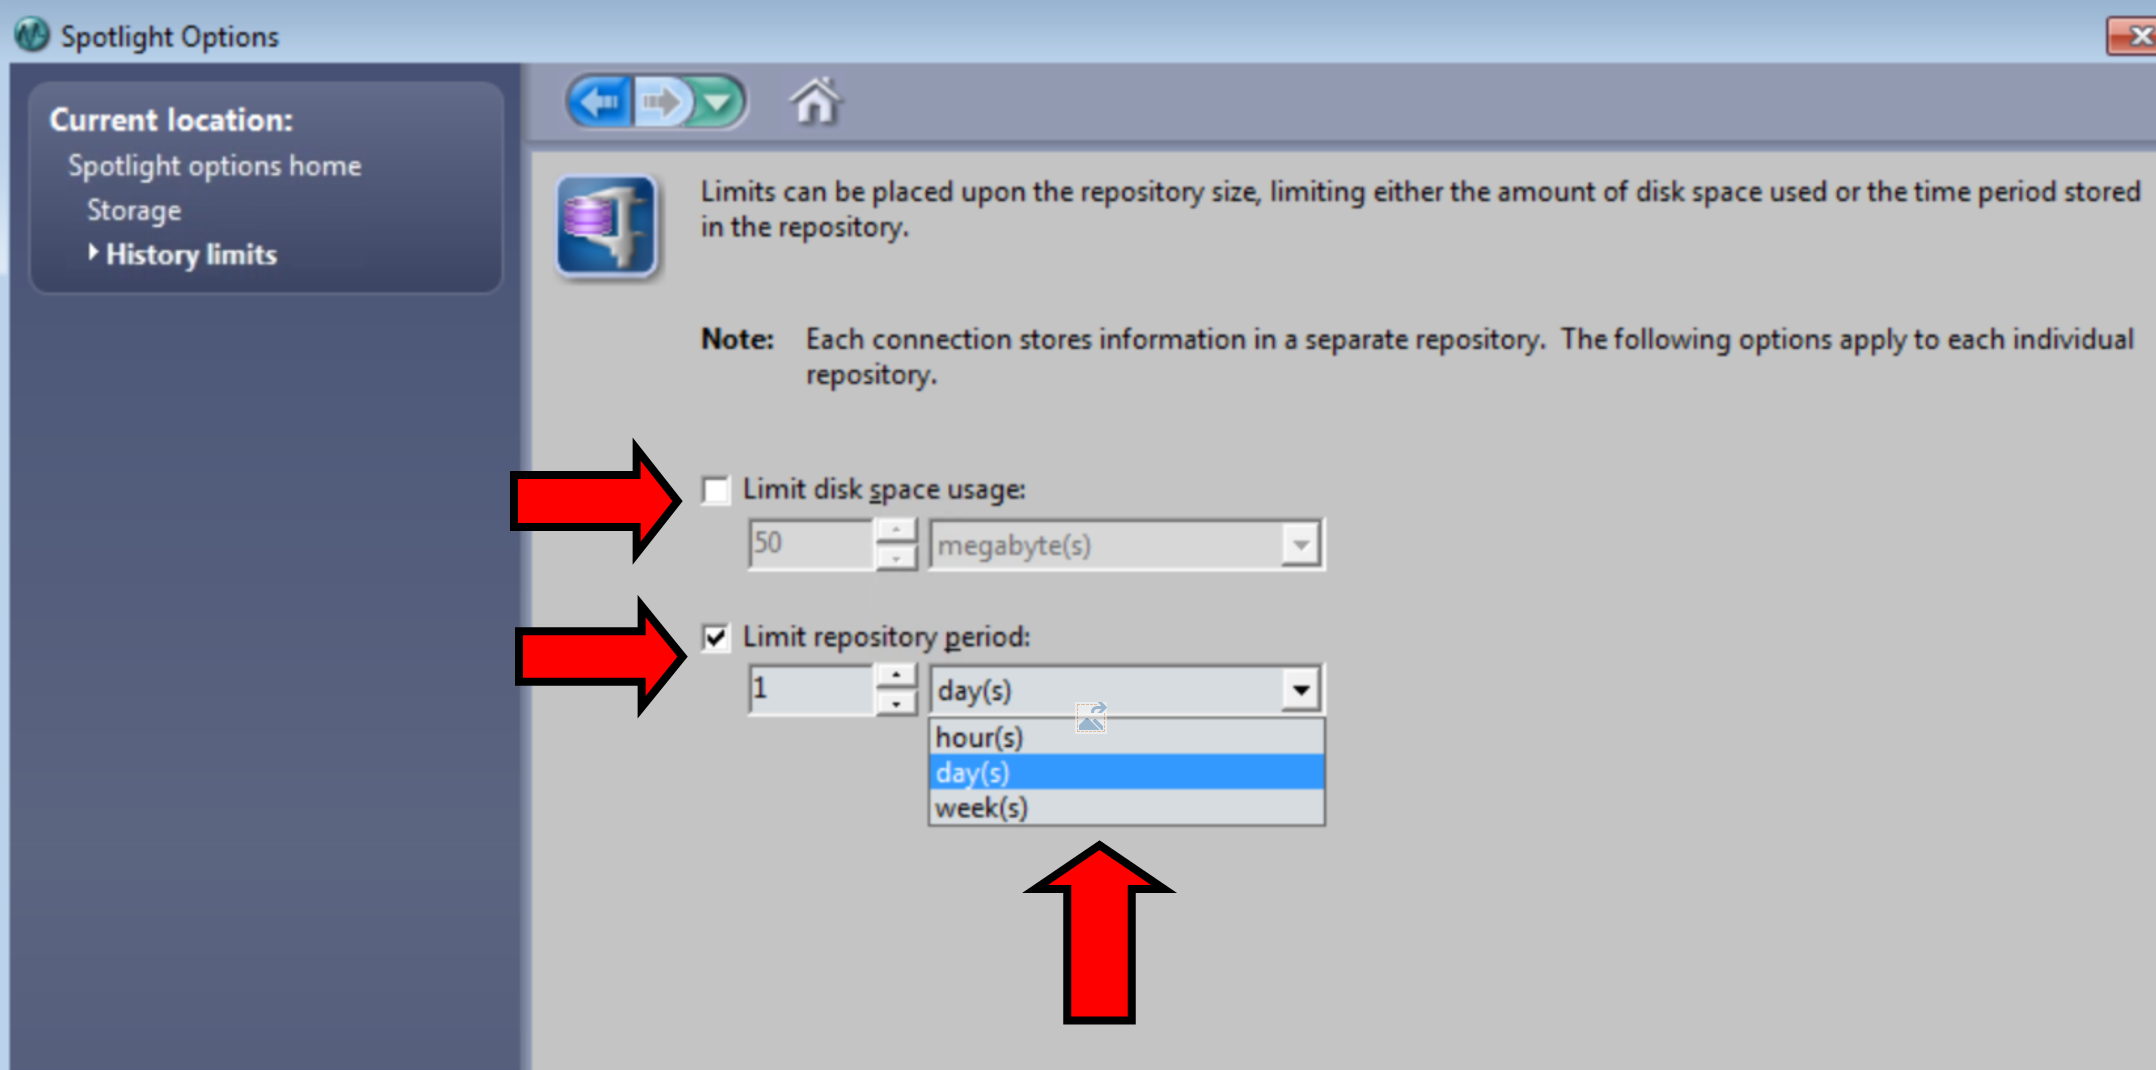
NOTE: The History Browser can be set to retain the history log for a certain size or time period.
To modify the history settings, go to the Options menu.
Under Storage, select the History option.
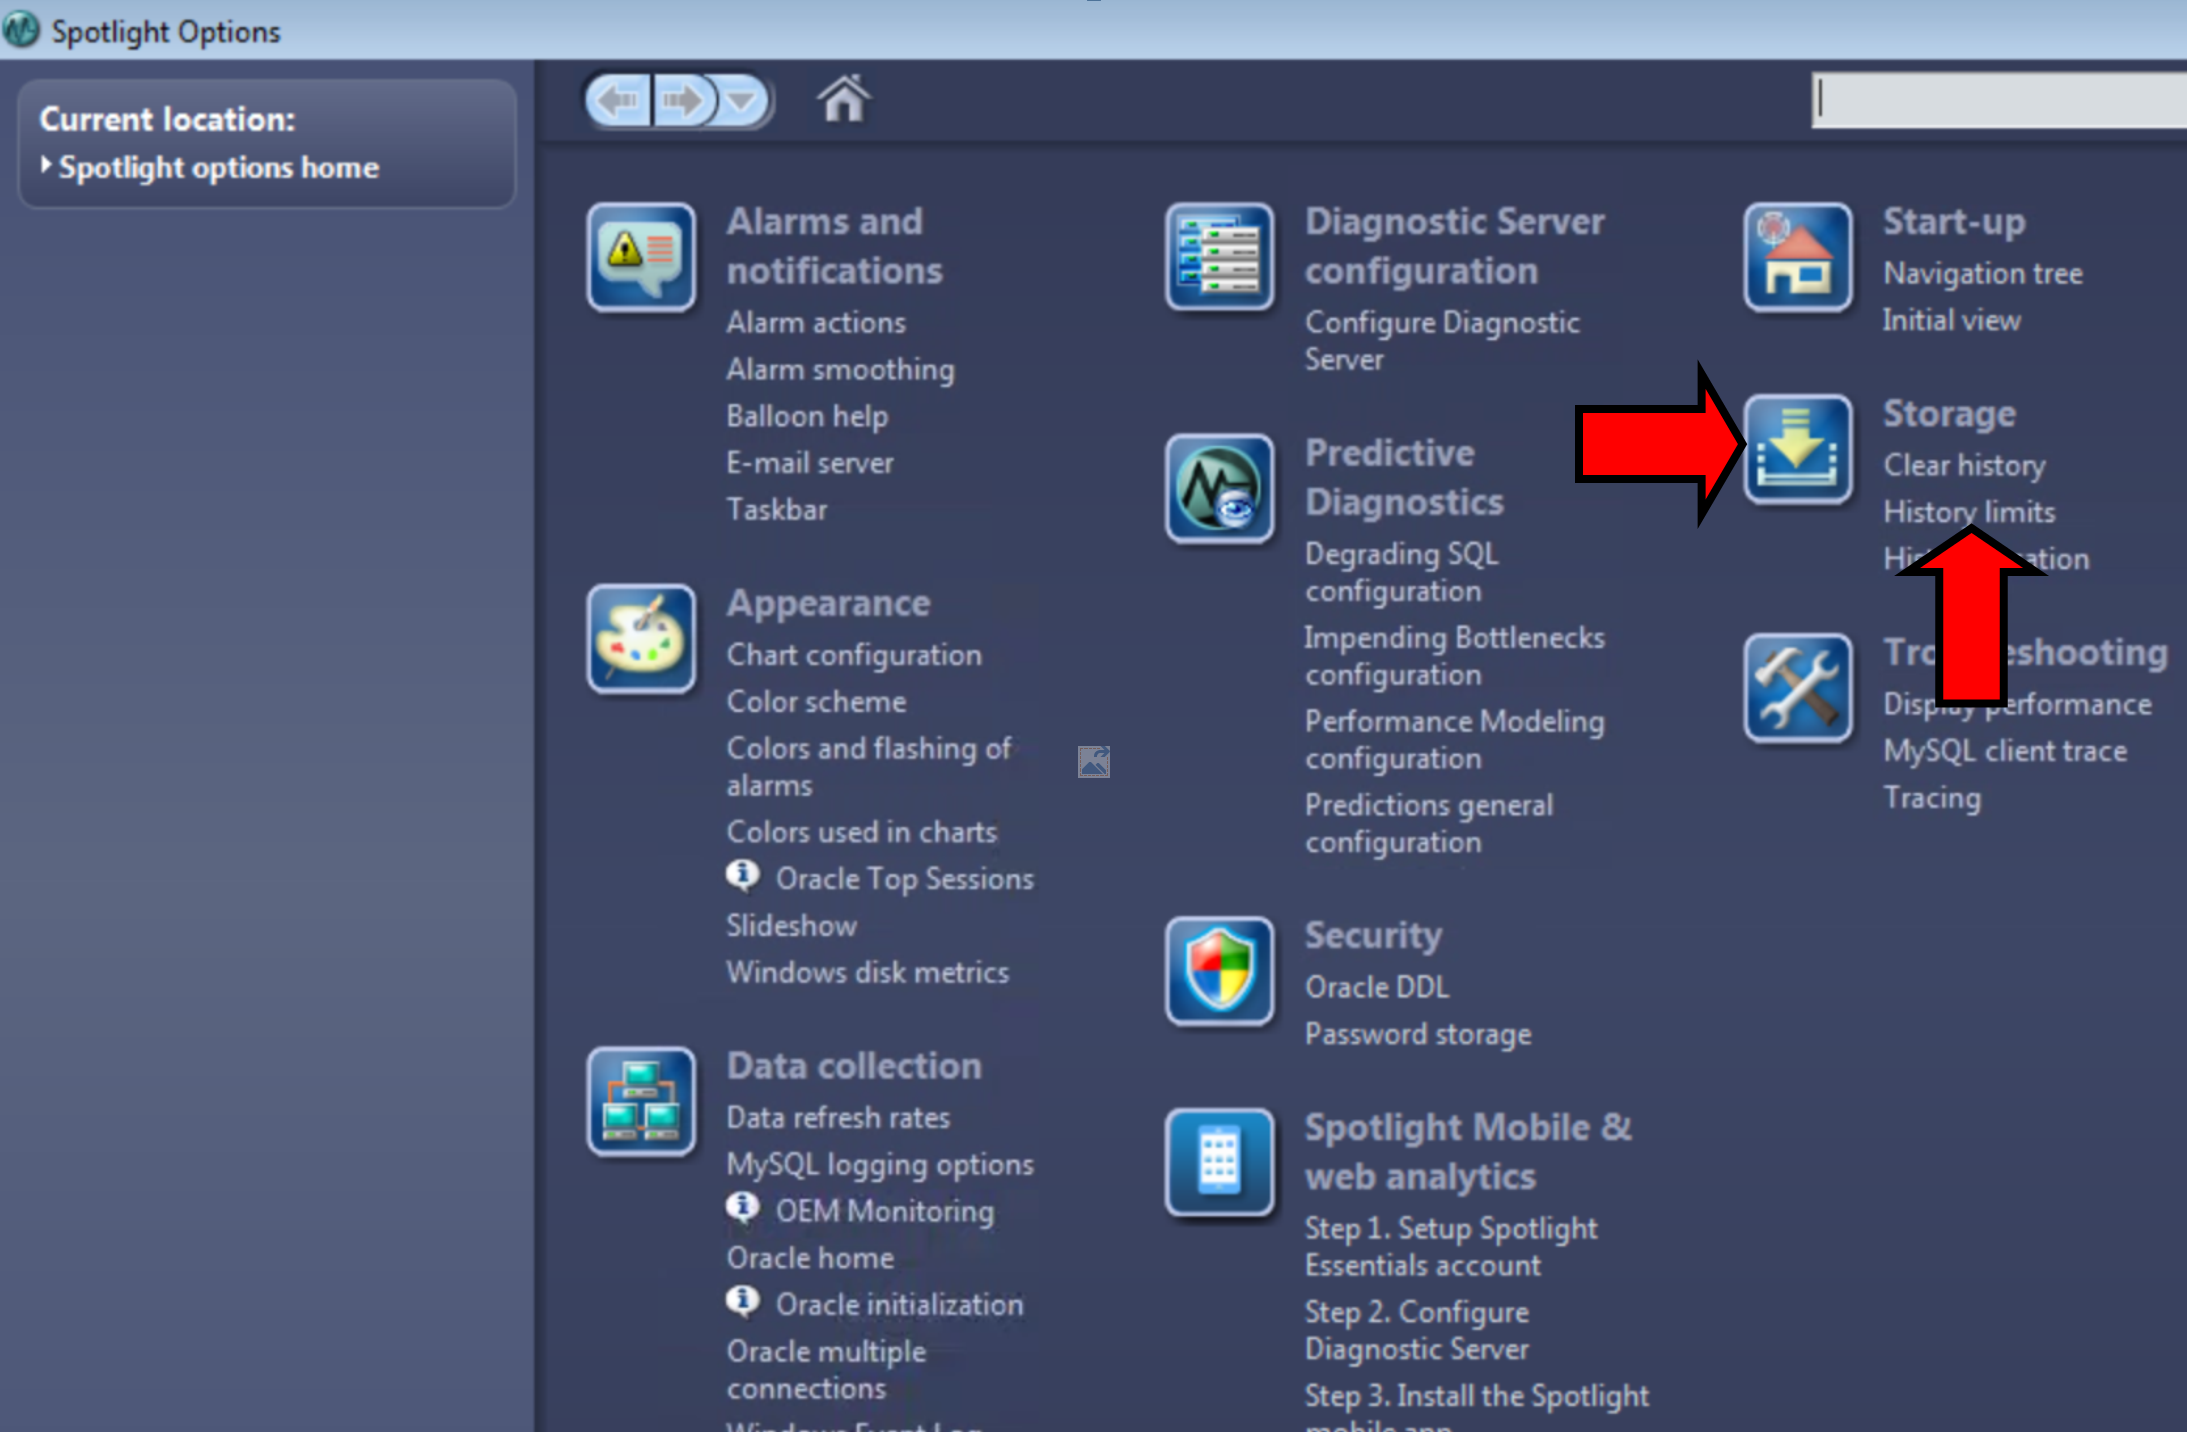
Then modify the parameter.
By using the Alarm Log and History Browser features of Spotlight on Oracle, we can save valuable time by not having to wait for an issue to repeat itself before we can diagnose and correct it. We have essentially gone back in time and saved ourselves a future headache!
You can find more about Spotlight on Oracle by going to our product support page or you can post questions in our Spotlight on Oracle Forum in Toad World Forums.
Start the discussion at forums.toadworld.com