Real stories. Real people. Real situations. With Toad solutions.
Blind-sided. Again.
It’s another beautiful day in Southern California. I am on site at an insurance company for a one-day proof-of-concept for one of Quest Software’s Toad for Oracle solutions; in this case, the DBA Edition. Prior prep calls with management and our kick-off meeting earlier in the day are making a couple things very clear. For one, the DBA team frequently gets blind-sided by database issues in Production. The tools that team members currently use are not always helping them resolve issues in a timely manner. Secondly, management wants to boost internal confidence in the DBA team’s ability to fix issues.
So now I am sitting, this morning, next to Frank (not his real name) in his cubicle, initiating the installation of our software and chatting about what a DBA’s life is like in Frank’s organization. Neither of us realize how quickly Frank will be showing me this firsthand instead of merely talking about it. A service engineer interrupts our chat to let Frank know that Helpdesk is starting to get calls: Users are complaining that an important customer service web application is running very, very slowly. The technician suspects it’s a database issue, and describes for Frank the application module and specific web page affected. This is all the information that Frank gets.
“I’m on it”, Frank says, matter-of-factly. He swivels away from me to his third monitor, logging onto a UNIX box where that application’s Oracle database resides. Frank is pretty calm at this point. He explains that many times he just needs to prove that the database is NOT the problem, and that it must lie within someone else’s jurisdiction to investigate.
I know what these moments are like, as I used to work in IT myself. I make it clear that I will give him lots of breathing room while he is investigating the issue.
Frank mumbles his appreciation. As I wait for the Toad DBA Edition installation to complete, I can’t help but sneak occasional peeks at Frank to see how he tackles troubleshooting. I am particularly impressed by his organized approach. The first thing Frank does is execute a shell script that displays a menu of database script choices, each of which fetches relevant database info. Frank quietly talks to himself as he makes conclusions about each script’s output. It’s clear that he’s got his routine down cold: Hit ratios are high enough, there are no hot objects, no read-consumptive queries, datafile IO distributions are normal, etc. Frank executes a few more scripts in the following minutes. Everything seems OK.
The Blame Game.
Since the Helpdesk team is just around the corner, Frank excuses himself, explaining that he’s going to let Helpdesk know it doesn’t appear to be a database issue. But as he turns around, Frank is greeted by the same Helpdesk technician, and with him are the Network Admin and the Systems Admin. A few more troubled users have called in, and the issue is still not resolved. The two admins conduct a two-minute triage with Frank. The Network Admin states emphatically that there’s no issue whatsoever on the network lines. As for the server, the Systems Admin notes that all operational metrics are within normal ranges, except for unusually high CPU usage, which the admin thinks is traced to the Oracle database.
Frank is still not convinced that the database is to blame, but since high CPU usage is allegedly tied to the database, he promises to investigate further. I watch Frank as he continues using his organized scripts and command-lining to probe deeper into database metrics. I see Frank cutting/pasting several script output grids into a single file to get a better, blended perspective. He is trying to piece together patterns about what is happening on the database.
Hysterics.
Five minutes pass. The same Helpdesk guy returns to Frank’s cube for a third time, nearly hysterical. His hyperventilation is air-brushing for us a grim picture: Customer service reps are not able to look up info for inquiries, quotes, and claims being called in. The hold queue for incoming calls is at its max. Customers and agents are calling into other numbers within the organization, complaining that they can’t get through the usual service lines.
“I am on it!” Frank exasperates scatter-of-factly this time. He returns to his UNIX monitor and his numbers. His fingers are now working twice as fast.
I feel helpless as I watch Frank’s witch-hunt for problems begin to make his face glisten with perspiration. From my previous IT career experiences I know the awful feeling when things aren’t working right and every minute of downtime costs money or ruins reputations. My heart bleeds for Frank and urges me to leave his area: It’s devastating to see a professional crumble under pressure. But my mind convinces me to stay in Frank’s cubical: I’m rooting for Frank, curious to see how he gets out of a jam. I stay.
Shining on the Blind Spot.
Since our Toad Edition software had finished installing minutes ago, it occurs to me that this real-world issue might be the ultimate proof-pudding for our POC. I whisper to Frank as unobtrusively as possible that our solution may help him. I bring up the Spotlight component of Toad for Oracle’s DBA Edition and ask Frank if he can just quickly log into that database for me. Frank mumbles, swings over to my monitor, enters in credentials as quickly as possible without even looking over at me, and returns to his scripts and command line.
After the initial one-time setup process, Spotlight displays the real-time dashboard for Frank’s production database. The dashboard looks busy with a rainbow of Spotlight colors, showing database bottlenecks of different severities. But after several refreshes, the Spotlight dashboard calls my attention to two persistent red zones on Frank’s database: the flow representing Change Throughput (updates/inserts, etc. over time) is red and nearly stagnant, and the redo log write flows are also red.
I choose to click on the red Change Flow first, where Spotlight drills me down to a page with more details about the problem area. I gasp. I am almost sure that I’ve stumbled upon at least one issue that’s causing Frank’s rear end to sizzle. Spotlight has quickly discovered a big problem: One database user is currently blocking 62 other sessions. That number forever stays in my memory, as I’ve never seen a blocking lock wait chain that long. One or two more sessions get added to the wait list every 15 seconds that Spotlight refreshes the page display.
“Uh, Frank? I think you need to look at this.” I say this with a sheepish gravity. Frank is clearly annoyed with the interruption. He starts adjusting his chair toward me, but his eyes are still riveted to data appearing on his own screen. I explain that Spotlight is displaying a session that at this moment is now blocking over 60 other sessions. The words “blocking” and “sixty” immediately yank Frank’s eyes over to my monitor.
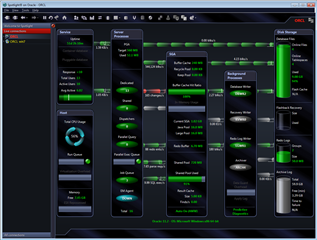
A Spotlight dashboard display similar to the one for Frank's database.
“Blocker? What’s he executing?!” I had already highlighted the blocking session, showing the blocker’s current SQL query, along with other operational metrics and wait info. Frank takes only a few seconds to look at the info before I see his eyes narrow. The brow tightens up. Teeth are clenching. Tensed fingers run arduously through his hair, as if their purpose right now is to dig deep trenches into his scalp. Frank lets out a few choice words that are not suitable for blog posts. He is super angry.
“That [guy] should NOT…” Frank abruptly stops his loud rant, as if he suddenly remembers he is a professional and has neighbors, including a guest in his cube. He reboots the attitude, trying to deliver his messages with more control. “He cannot be running this right now.” Frank explains that this [user] has been routinely chastised for executing these types of analytical queries during business hours, although it’s been a while since he’s done so. But today, the analyst has sneaked in a long-running query. We can see that the query isn’t a super-heavy consumer of disk reads or data buffer blocks, but its heavy analytics execution profile is causing high CPU levels, and it has an exclusive lock on an important table, preventing now over 70 other sessions from using it.
Mission Accomplished.
“What’s the SID? I need to kill this guy.” I wonder if Frank is aware of his double-entendre. I point to the session ID from Spotlight’s display, but I explain to Frank that Spotlight allows a right-click “kill” in context. And that’s what we do; we kill the blocking session. After the kill, Frank and I both watch the list of waiters dwindle by tens of sessions each time Spotlight refreshes its page display. Frank excuses himself momentarily to walk over to the helpdesk area. Minutes later, he returns to his cube to gush out the good news to me. The helpdesk calls have stopped, at least for this customer service issue. Things are now apparently back to normal. Spotlight has saved the day.
The excitement of the story doesn’t end here, but this is probably enough intensity for one reading. Suffice it to say that Frank was so excited at how the issue was pinpointed and resolved, that he pulled his reluctant manager out of a meeting in progress and brought her over to his cube so I could show her how Spotlight came to the rescue so quickly. The three of us spent almost an hour with Spotlight as I answered their questions and showed them a bit more of the product in action. Later that afternoon, I presented a demonstration of the DBA suite of Toad products to Frank, his manager, and a few other DBAs. Two weeks later we returned on site to present our solution set to the broader DBA teams. More than a decade later, they are still using Toad and the DBA Edition components.
How does a solution like Spotlight make a difference? Because underneath the covers of Frank’s Oracle 11g database lies over 500 dynamic performance views that track everything about the database’s activity and operational performance. There are even more of these views for an Oracle 12c instance. Oracle RAC within Exadata appliances have over 1,300.
Which of those performance views are most likely to point to the database problem(s) at hand? It can be a (calculated) guessing game in many cases. Frank wasn’t given much information to help him troubleshoot. So he probed with a vengeance those V$ views with his library of scripts. And probed. And probed. Spotlight assists DBAs by probing the database for them at periodic intervals. It graphically organizes and blends the plethora of performance metrics into graphical dashboards that color code anomalies and bottlenecks. Spotlight is all about minimizing problem resolution times. And that’s critical when issues threaten revenue streams and reputations.
Start the discussion at forums.toadworld.com