
While Microsoft Excel is the workhorse of many business analysts, some of the data manipulation, reporting and pivot data that analysts need can also be produced within database tools. Quest® Toad® Data Point can help analysts to arrange and pivot data, and it also works well with Microsoft Excel.
The Pivot Grid is the specific feature within Toad Data Point that offers this functionality and allows analysts to drill down and see details for line items. The Pivot Grid can be saved as an Excel Pivot Table, and this feature can be automated to refresh this data as needed or on a regularly scheduled basis. The output can be managed on your workstation or published to Quest Toad Intelligence Central for shared use.
This blog will focus on these areas of pivot data value:
- What is a Pivot Grid?
- How to drill down on data
- Saving to Excel

What is a Pivot Grid?
A Pivot Grid in Toad Data Point (known within Excel as a Pivot Table) allows for a data set to be easily summarized and manipulated to see data in different ways and uncover insights.
The user drags and drops column headers to X and Y positions with the data displayed in the resulting grid. By rearranging the header columns, the numeric data is adjusted, or “pivoted.” The user can quickly pivot data to see any potential issues or trends.
Let’s work through some sample data to explore the Toad Data Point Pivot Grid and how it can be used to arrange and analyze data further.
You start your Pivot Grid from any data grid. Run SQL that you’ve built with either the Editor or the Query Builder, right click on the data grid and select Send to à Pivot Grid.
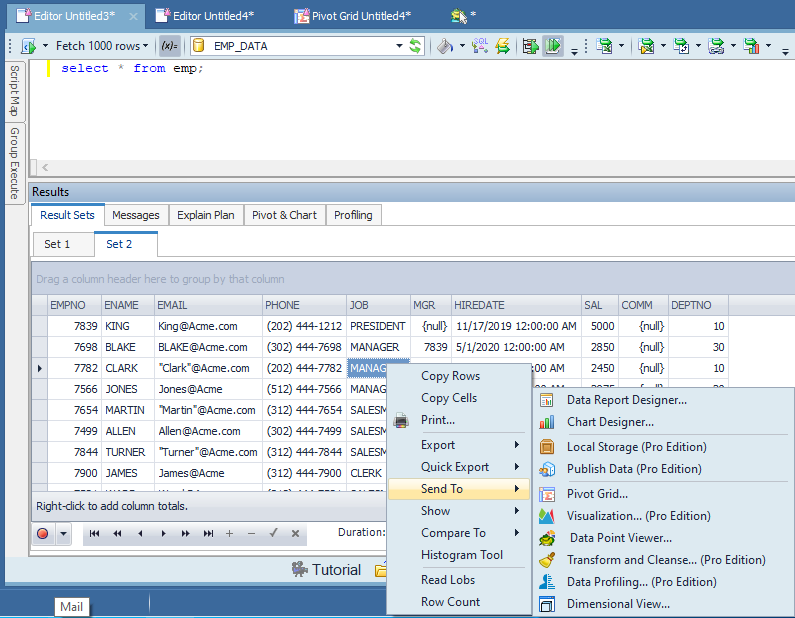
Sending data to a Pivot Grid in Toad Data Point
Now you simply drag and drop the columns from the list on the upper right to the appropriate areas on the Pivot Grid itself. You can also quickly see the relationships of the different areas in the lower right part of the Pivot Grid. You can move columns to and from this lower left area to repivot the data.
To save data for future reference, you can easily export it to an Excel Pivot Table.
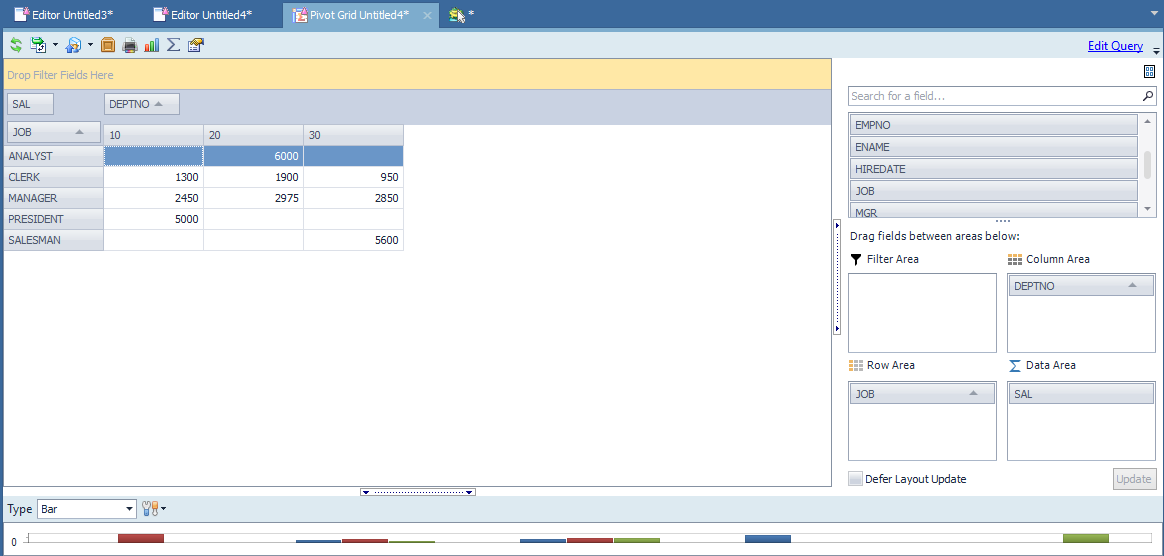
Building a Pivot Grid in Toad Data Point
How to Drill Down on Data
The Pivot Grid panel is a robust data analytics tool. Bar charts, graphs and graphics automatically appear. Within this view, it is easy to manipulate and pivot data for more effective analysis.
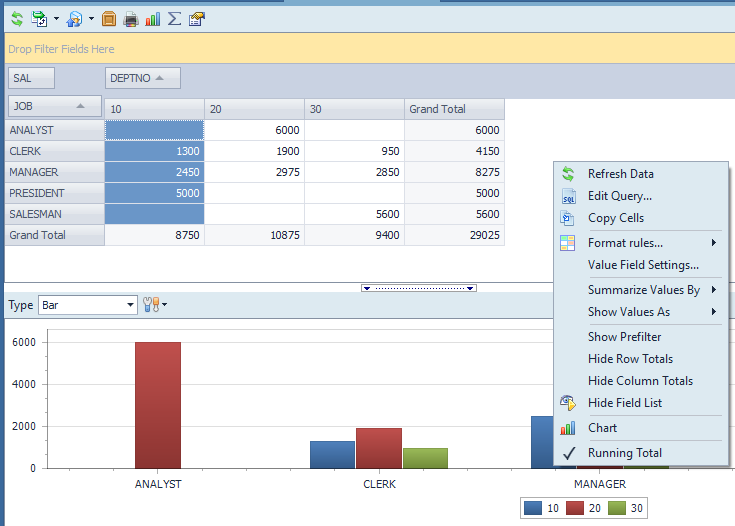
Working with pivot data
To get the grand totals at the ends of the columns and rows, right click and select Row Totals, then again for Column Totals.
Getting row and column totals
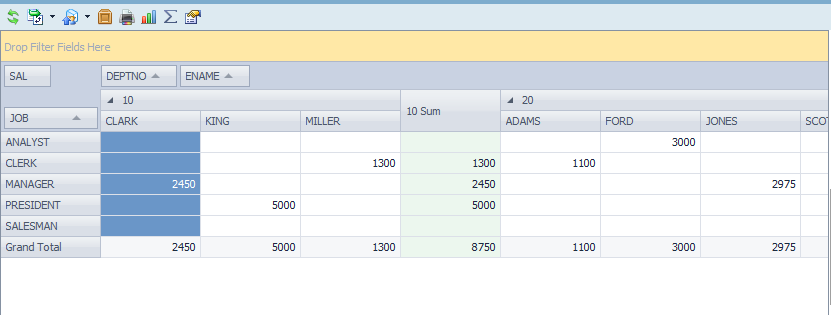
Let’s take a look at some details for these numbers. For example, to look at the employees that make up these numbers by department, add ENAME next to DEPTNO. You can now close the ENAME data from the data grid. This is nice if you only want to expose certain data items. Use the little triangle (that appears in the DEPTNO column header). This is called a drill point and allows subordinate data items to be expanded or condensed.
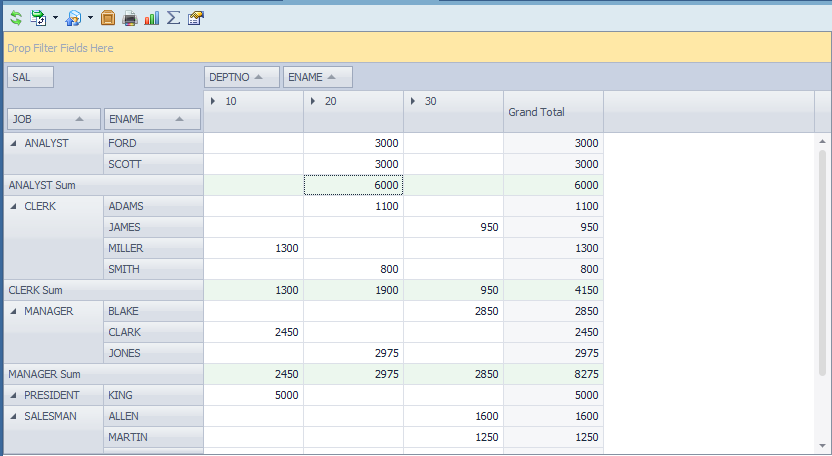
Examining pivot data details
Now you can see which employee has which job title.
This is not a lot of data, but using this kind of analysis combined with the charts and graphics, it’s possible to sort by which departments have the largest salaries. You could also see trends in salaries if we viewed the data year to year or quarter to quarter, etc.
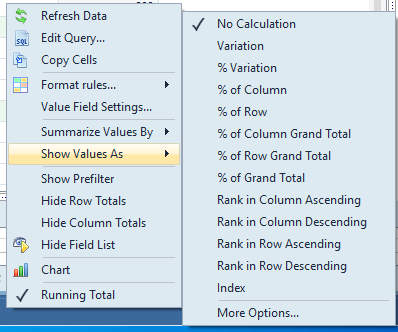
Toad Data Point data operations
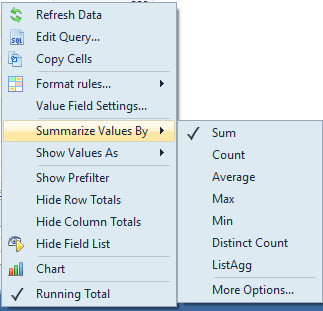
You can change the data values to various counts and aggregate functions.
Toad Data Point data display options
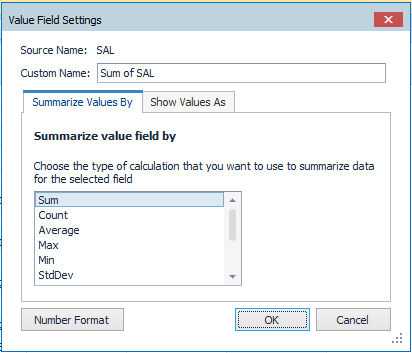
Toad Data Point value field settings
The Value Field Settings allow you to change the above-mentioned features and also to assign a better column header name.
Saving to Excel
Toad Data Point has the ability to save nearly any data to Excel. As Pivot Grids from Toad Data Point become Pivot Tables in Excel, they will retain the totals, drill points and column headers.
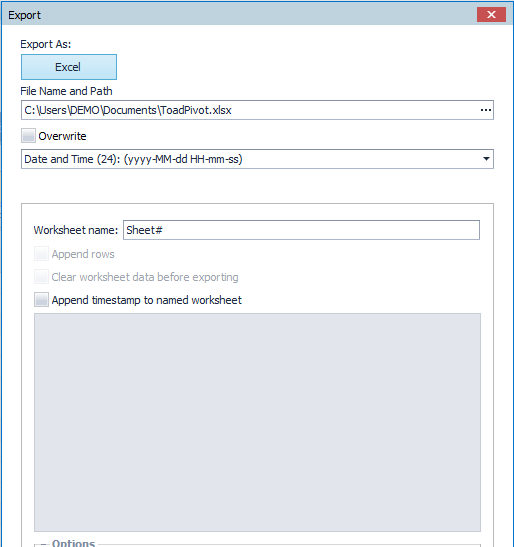
Toad Data Point Export Wizard
By pressing the Export Pivot button (second on the tool bar), you can start this wizard. Notice you have options for adding a date/time stamp to the file name. You can also rename the sheets and overwrite an existing spreadsheet. Note that this process is easy to automate (to regularly schedule and distribute data) by using Toad Automation.
Try Toad Data Point for freeLearn how Toad Data Point can help you access and prepare data faster. Seamlessly access more than 50 data sources—both on premises and in the cloud—and switch between these data source with near zero transition times. Get started with our free 30-day trial. Already in a trial? If Toad Data Point is helping you connect, query and prepare data for faster business insights, buy it now or contact a sales representative. |
For every business analyst, there are vast sums of data that need to distilled into useful insights and communicated quickly and effectively. By using Toad Data Point Pivot Grids to arrange and pivot data, analysts can easily compare and contrast data values, and quickly derive useful analytics for a variety of business scenarios.
Related links:
Blog: How to use Quest® Toad® Data Point to improve data integrity
Blog: How to use Toad Data Point to solve data preparation issues
Blog / video: What is data preparation and why is it key to the business analyst?
Webinar: Answering Your Top Five Questions About Toad Data Point Automation
Ebook: The Four Roadblocks of Data prep
Visit Quest for data prep and provisioning with Toad Data Point and Toad Intelligence Central
IDC Datasheet: Quest Software Acquires erwin Inc.
Visit Quest erwin, for enterprise data governance
Blog: How to prepare data for machine learning
Blog: Easy data prep: Toad® Data Point v5+ new features
Quest blog: Data prep and Analysis: Using Data Efficiently in the Era of Dark Data
Help your colleagues
If you think your colleagues would benefit from this blog, share it now on social media with the buttons located at the top of this blog post. Thanks!
Dan Hotka has several course offerings that use Toad and Toad Data Point
Start the discussion at forums.toadworld.com