In three articles we are discussing using Toad for Oracle with Oracle Database Exadata Express Cloud Service. In the first article we created an Oracle Database Exadata Express Cloud Service instance and in the second article we discussed connecting to the database with Toad for Oracle to create and compare tables. In this third article we shall discuss some of the features of Toad for Oracle. This article has the following sections.
Finding Data Duplicates
Using Schema Browser
Exporting dataset to HTML
Running a Query
Finding Data
Exporting Result set to Excel
Creating a Report
Modifying a Report
Deleting Exadata Instance
Finding Data Duplicates
Finding data duplicates may be of interest for several reasons, including the following:
– To find out whether the same data value such as same primary key value has been added to multiple rows in error.
– To find groupings in data, if any.
– To verify whether data that is supposed to be the same, is the same.
To find data duplicates select Database>Compare>Data Duplicates as shown in Figure 1.
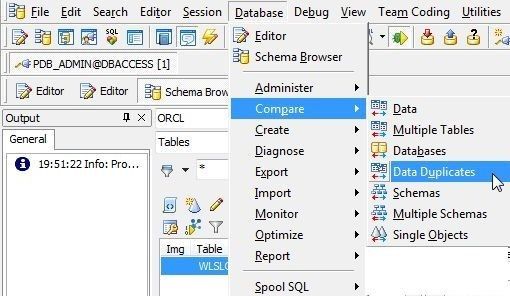
Figure 1. Database>Compare>Data Duplicates
The Data Duplicates wizard gets started, as shown in Figure 2. The Table Selection tab is selected by default. Select from the two options Find duplicates in all columns and Find duplicates in selected columns. Find duplicates in selected columns is shown selected in Figure 2. Select schema as PDB_ADMIN. Select Object Types as Tables.
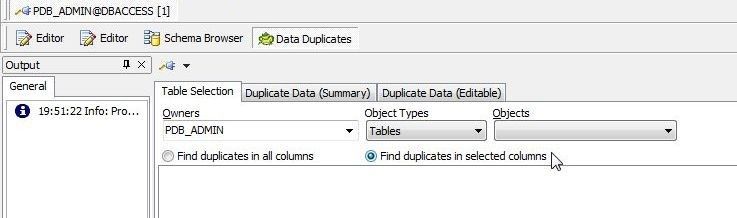
Figure 2. Data Duplicates wizard
Next, select the objects, which would be tables in this case because Object Types is set to Tables. Select the WLSLOG table as shown in Figure 3.
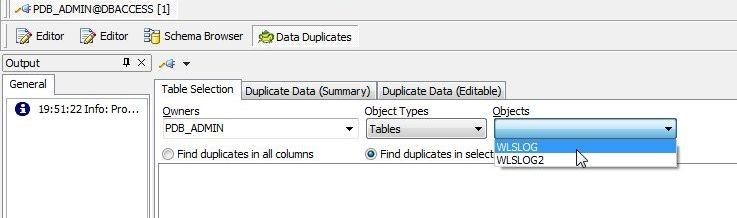
Figure 3. Selecting Objects
Select the columns in which to look for duplicates as shown in Figure 4. Multiple columns are selected with Shift+column.
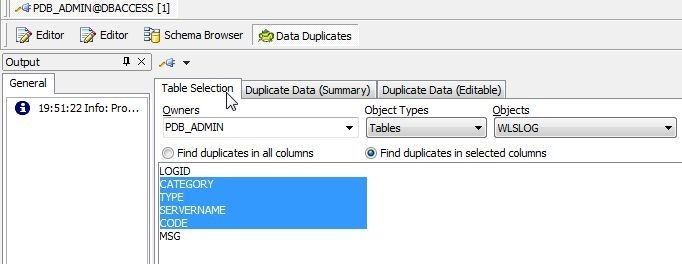
Figure 4. Selecting Multiple Columns
Select the Duplicate Data (Editable) tab to display the duplicate data, as shown in Figure 5.
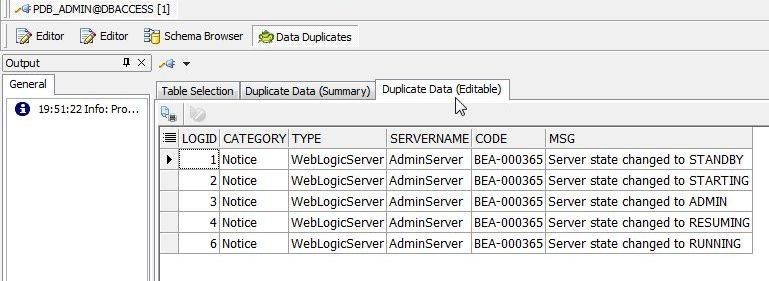
Figure 5. Duplicate Data
Select the Duplicate Data (Summary) tab to display the summary as shown in Figure 6.
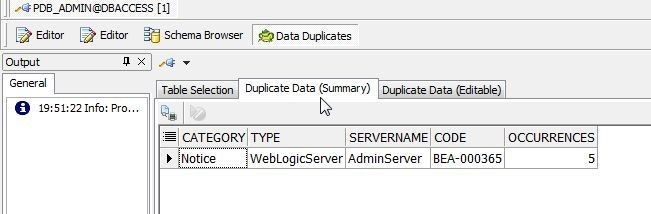
Figure 6. Duplicate Data (Summary)
Using the Schema Browser
The Schema Browser is used to browse database data and other database objects. Select Database>Schema Browser to start a Schema Browser, as shown in Figure 7.
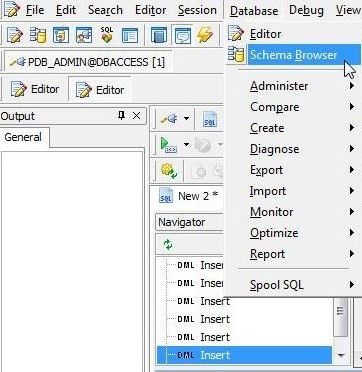
Figure 7. Database>Schema Browser
The Schema Browser gets started, as shown in Figure 8. Select a Schema; the PDB_ADMIN schema is shown selected in Figure 8. Select the object type; Tables is shown selected. Select a table; WLSLOG table is shown selected. The Columns tab is selected by default, and tabs for other database objects that are defined on the table are provided.
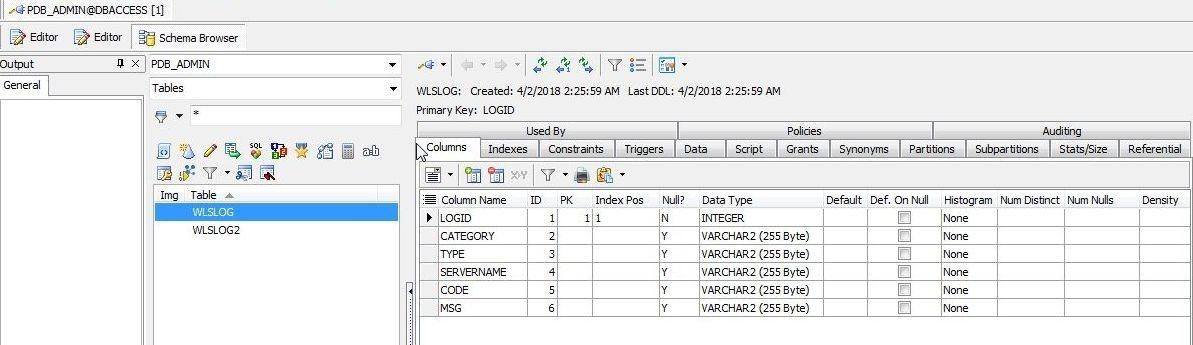
Figure 8. Schema Browser
The Data tab displays the table data, as shown in Figure 9.
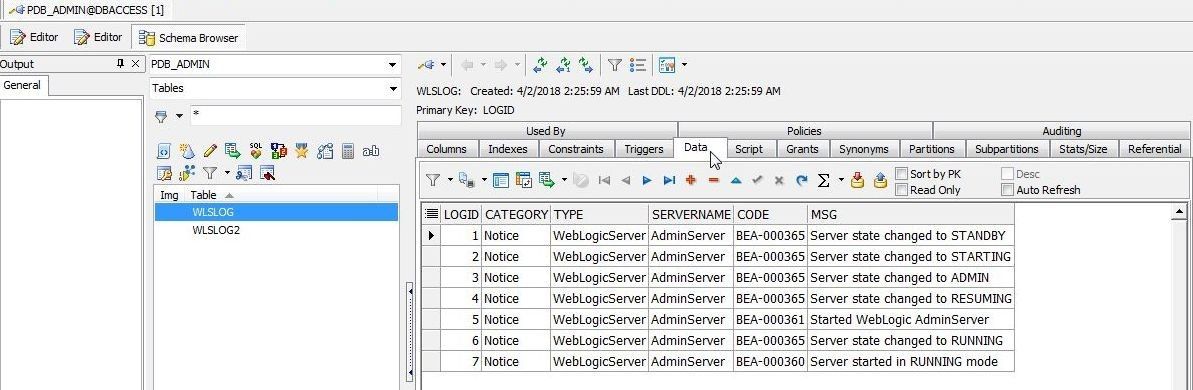
Figure 9. Table Data
Exporting Dataset to HTML
To export dataset to one of the supported output formats click on Export dataset as shown in Figure 10.
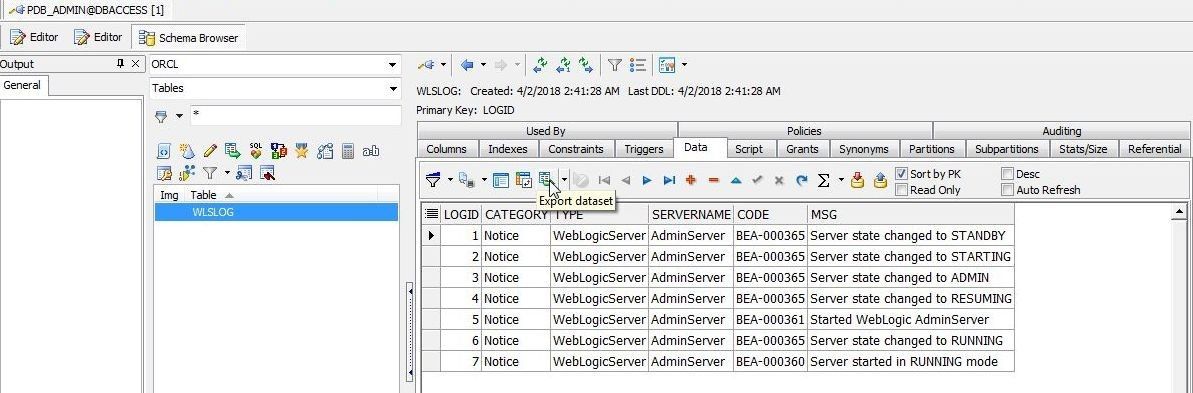
Figure 10. Export Dataset
In the Export Dataset wizard select from the Export format drop-down; HTML Table is shown selected in Figure 11.
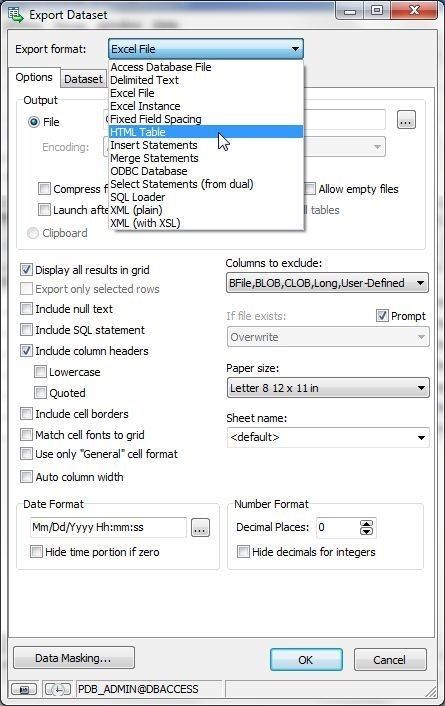
Figure 11. Selecting Export format as HTML Table
Select an Output File and click on OK as shown in Figure 12.
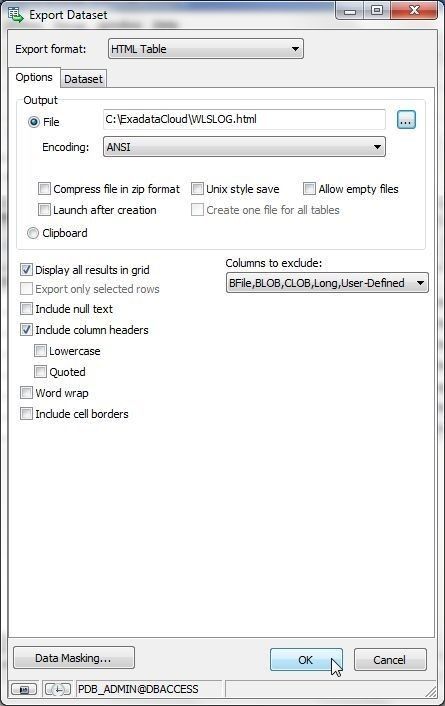
Figure 12. Export dataset>OK
The dataset gets exported. The WLSLOG.html file exported is shown in Figure 13.
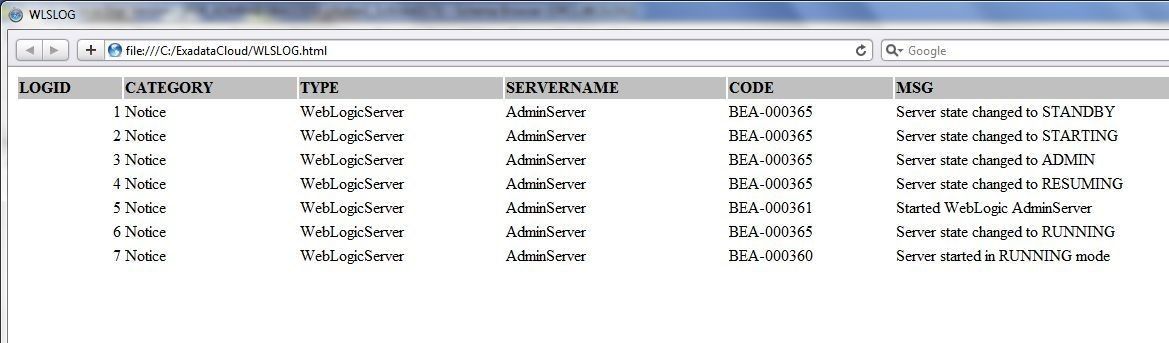
Figure 13. HTML Table Exported
Running a Query
To run a SQL query specify a SQL SELECT statement in an Editor, position caret at the beginning of the SQL statement, and click on Execute/compile statement at caret as shown in Figure 14.
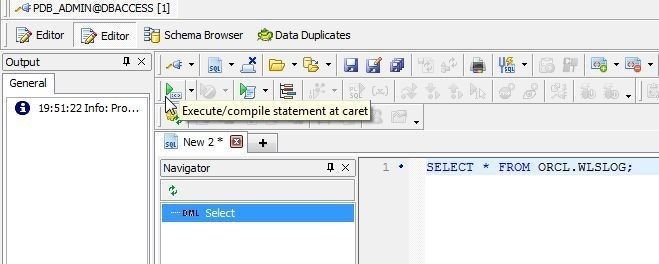
Figure 14. Running a SQL Statement
The SQL query result set shown in Data Grid gets displayed, as shown in Figure 15.
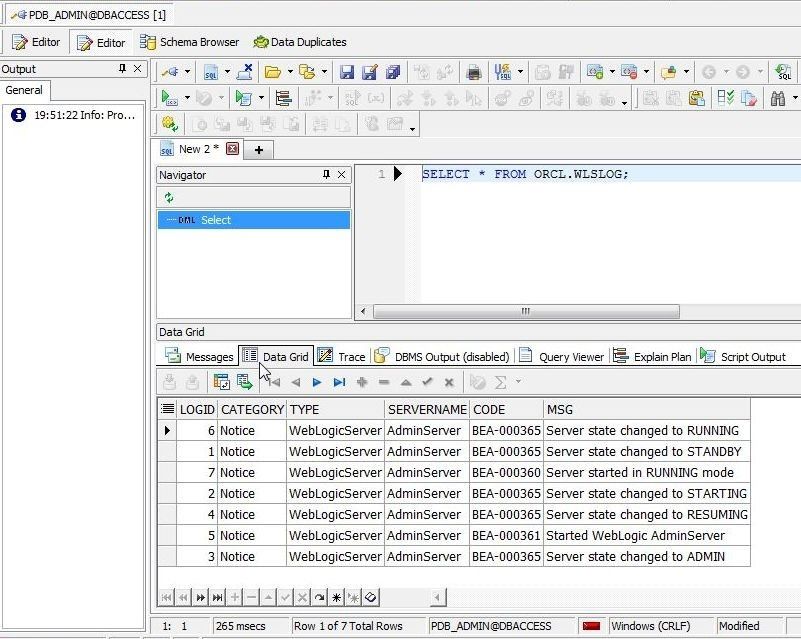
Figure 15. Data Grid
Several options are provides for a Data Grid; for which, right-click on the Data Grid as shown in Figure 16. Select Sort Columns as an example.
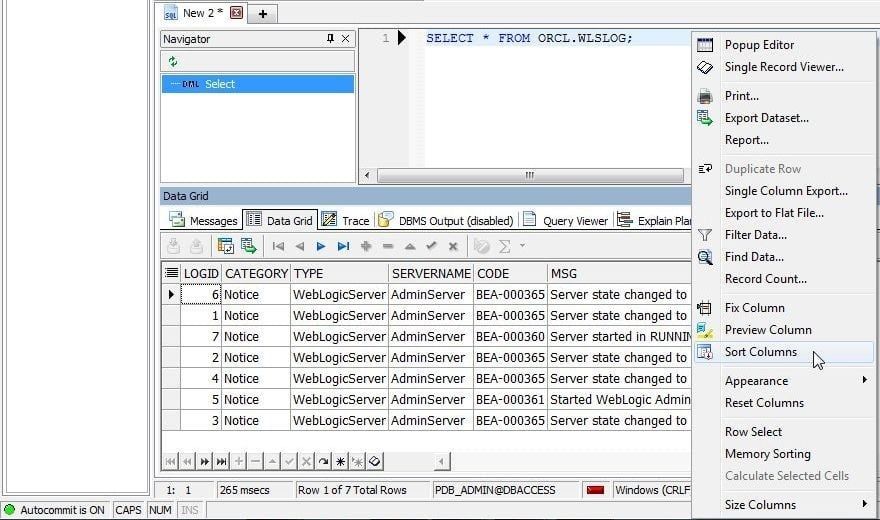
Figure 16. Data Grid Options
The Sort Grid Columns dialog gets displayed, as shown in Figure 17. Arrows are provided to shift a column up/down. The option (button) to Alphabetize the columns is also provided.
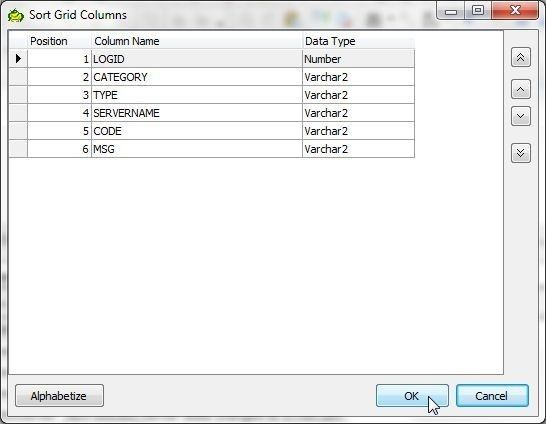
Figure 17. Sort Grid Columns
Finding Data
To find data select Find Data from the Data Grid options as shown in Figure 18.
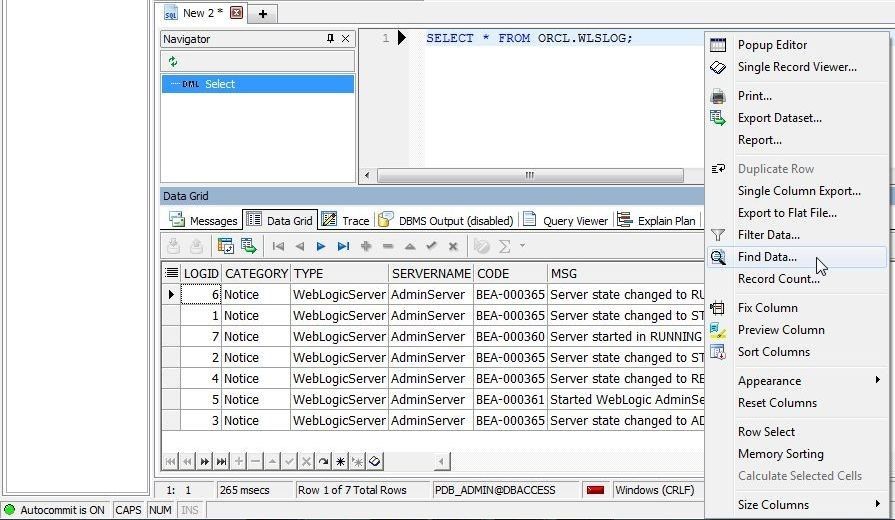
Figure 18. Data Grid>Find Data
The Grid Column/Data Find wizard gets started, as shown in Figure 19. As an example, search for data with the CODE value as BEA-000361. First select CODE in Columns and with the Find Data radio button selected specify Value as BEA-000361. Click on Add as shown in Figure 19.
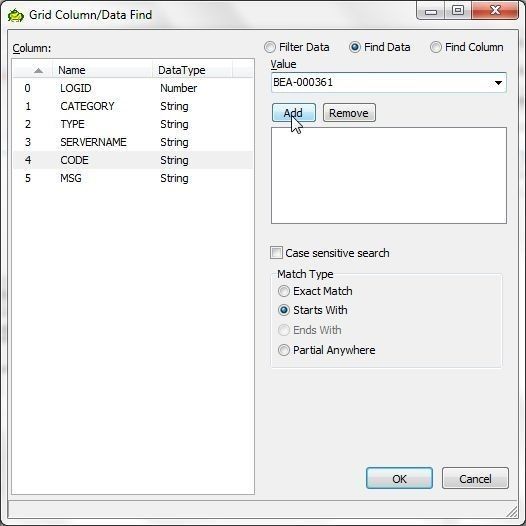
Figure 19. Grid Column.Data Find
Select the option (checkbox) for Case sensitive search. For Match Type select Exact Match. Click on OK as shown in Figure 20 to find the data.
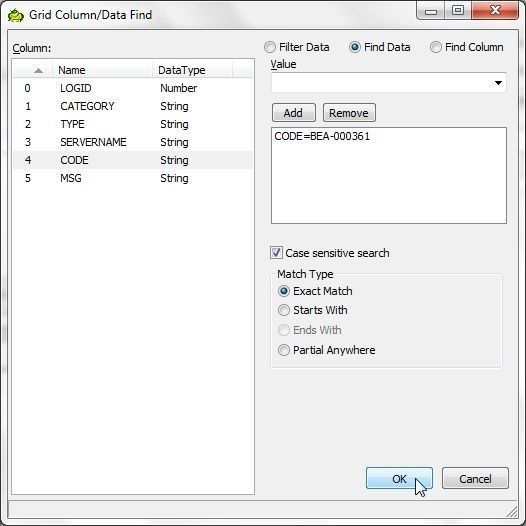
Figure 20. Grid Columns/Data Find>OK
The data row with the CODE column value as BEA-000361 gets selected, as indicated by the > pointer to the row shown in Figure 21.
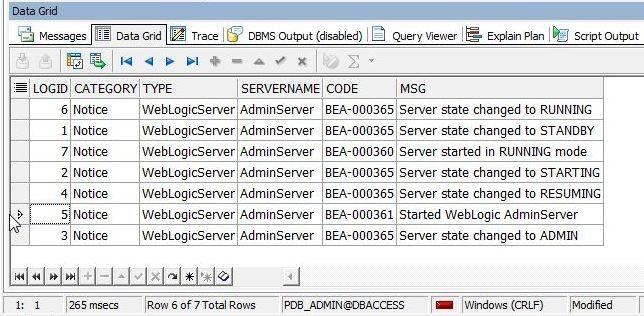
Figure 21. Data Row found with Data Find wizard
As another example, search for data with the MSG column value starting with Server started. For Find Data specify or select MSG=Server started. For Match Type select Starts with and click on OK as shown in Figure 22.
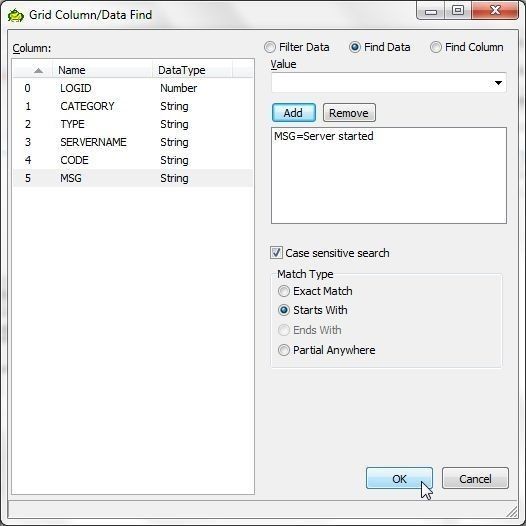
Figure 22. Finding data with specified MSG column Value
The pointer gets set to the row with the data searched for, as shown in Figure 23.
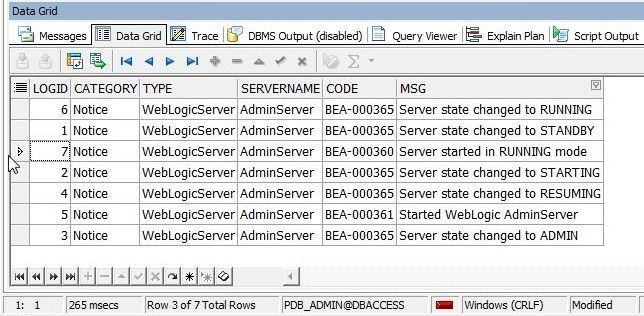
Figure 23. Data Row with MSG=Server started…
Exporting Query Result set to Excel
To export the query result set to one of the supported output formats, right-click on the Data Grid and select Export Dataset… as shown in Figure 24.
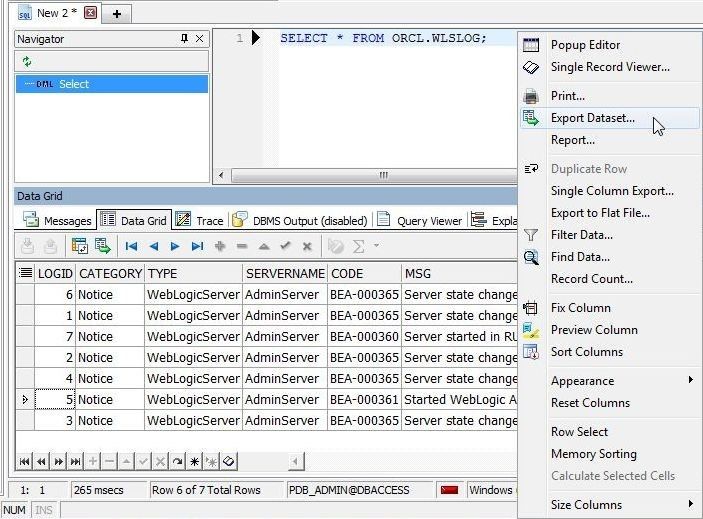
Figure 24.Data Grid>Export Dataset
The same Export Dataset wizard as before gets started; in which, select Export format as Excel File as shown in Figure 25.
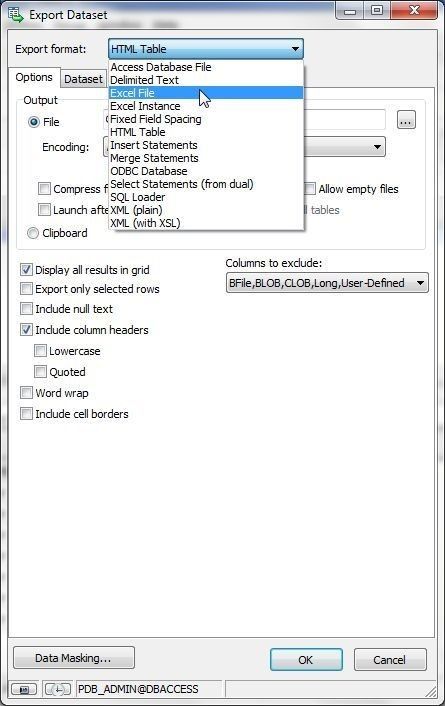
Figure 25. Selecting Export format as Excel File
Select an Output File and click on OK as shown in Figure 26.
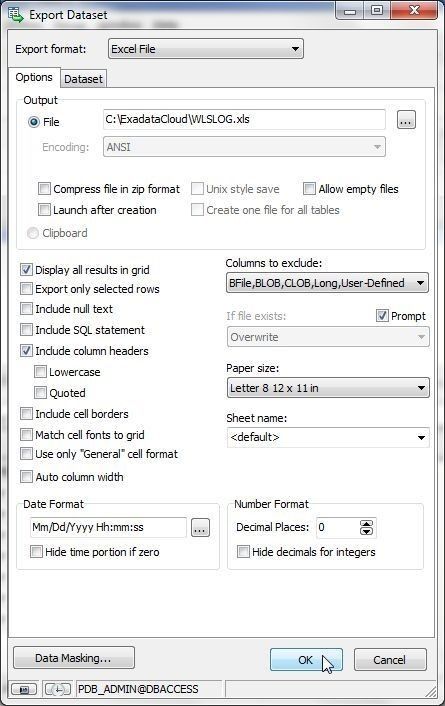
Figure 26. Export Dataset>OK
The Excel File exported is shown in Figure 27.
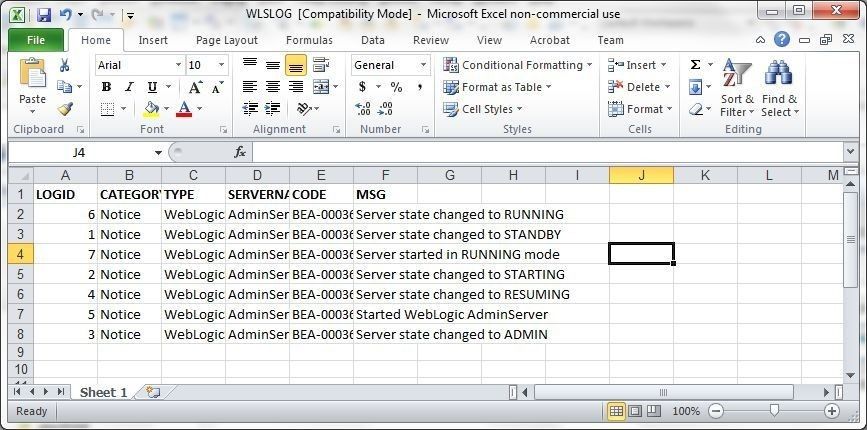
Figure 27. Excel File exported
Creating a Report
Another useful feature is to generate a report from the Data Grid. To create a report right-click in the Data Grid and select Report as shown in Figure 28.
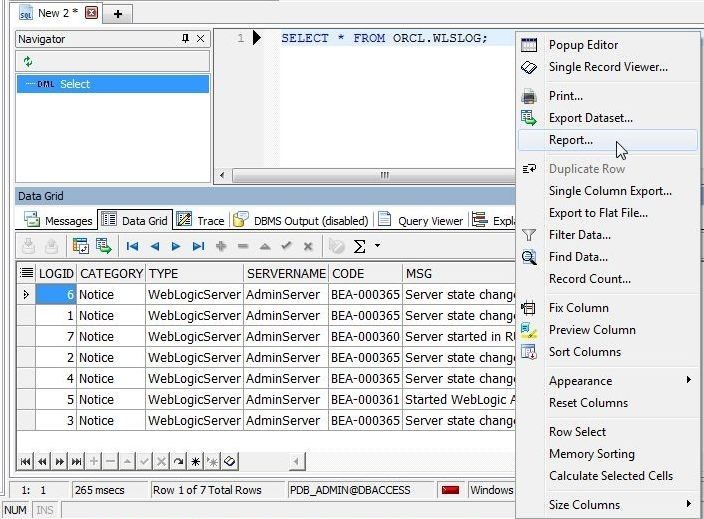
Figure 28. Data Grid>Report
The Report Wizard gets launched, as shown in Figure 29. First, select the fields to add to the report. Click on Add all to add all fields.
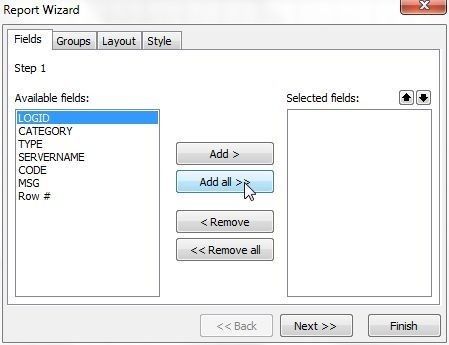
Figure 29. Report Wizard
The Row # field also gets added by default. Click on Next as shown in Figure 30.
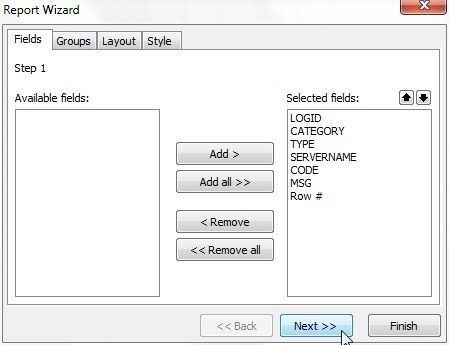
Figure 30. Selecting Fields
Next, select Groups. By default no groups are selected, as shown in Figure 31. Click on Next>>.
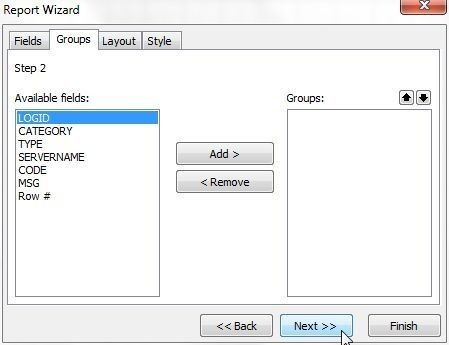
Figure 31. Selecting Groups
Next, select the Layout. With Orientation as Portrait and Layout as Tabular and with the Fit fields to page width checkbox selected, click on Next>> as shown in Figure 32.
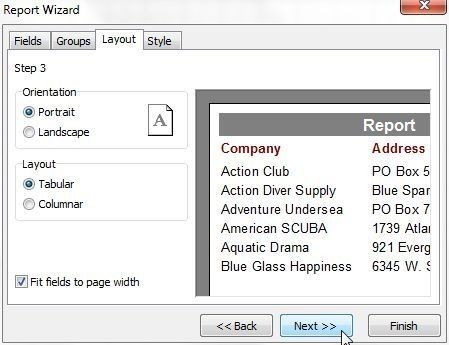
Figure 32. Layout
Select from one of the Styles; Fast Report is shown selected in Figure 33. Click on Finish.
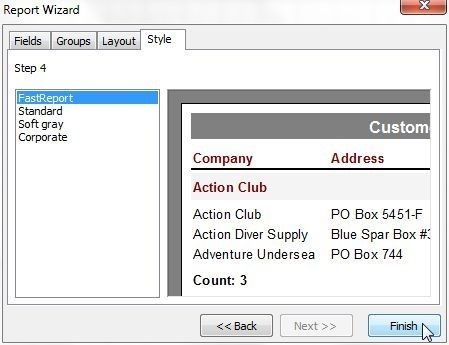
Figure 33. Selecting Style
The report template gets displayed, as shown in Figure 34.

Figure 34. Report Template
The report data sets may be modified by selecting Report>Data, as shown in Figure 35.
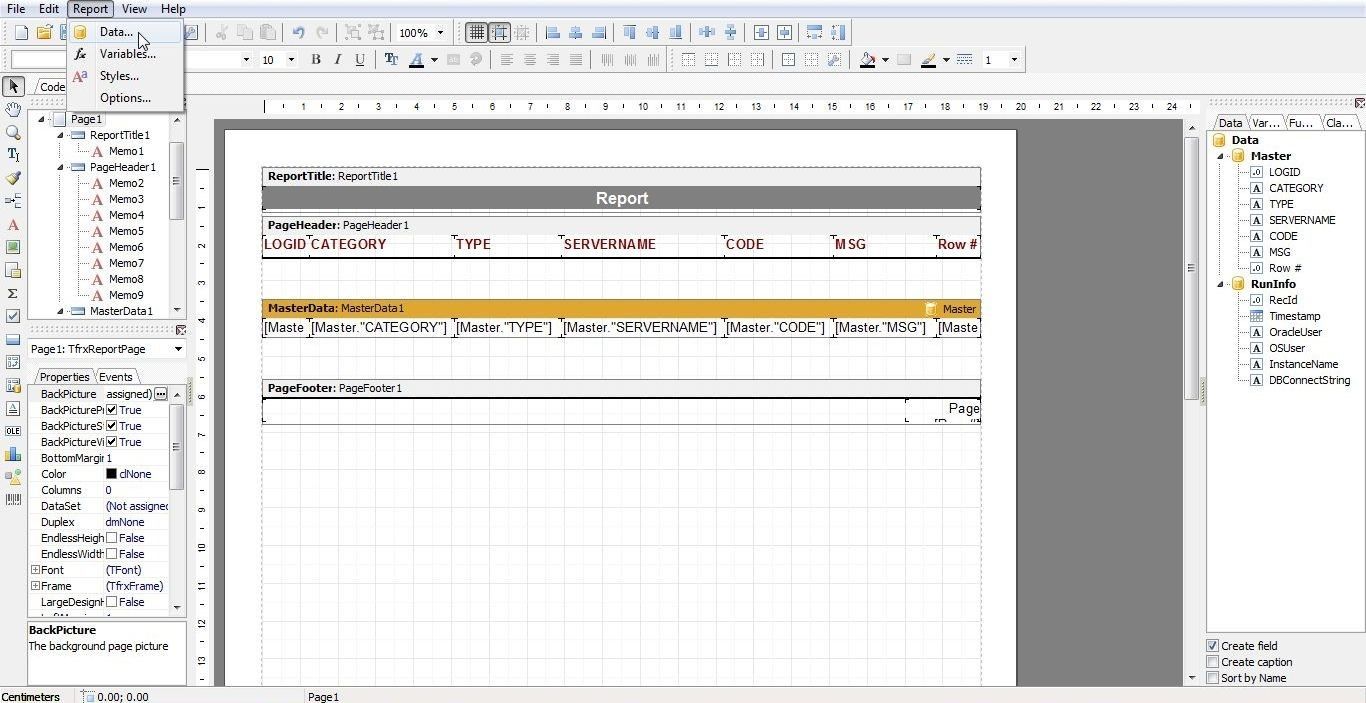
Figure 35. Report>Data
The Select Report Datasets dialog lists the datasets already selected and available as shown in Figure 36. The datasets may be modified. Click on OK.
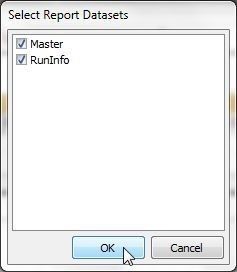
Figure 36. Report Datasets
To preview the report click on File>Preview as shown in Figure 37.
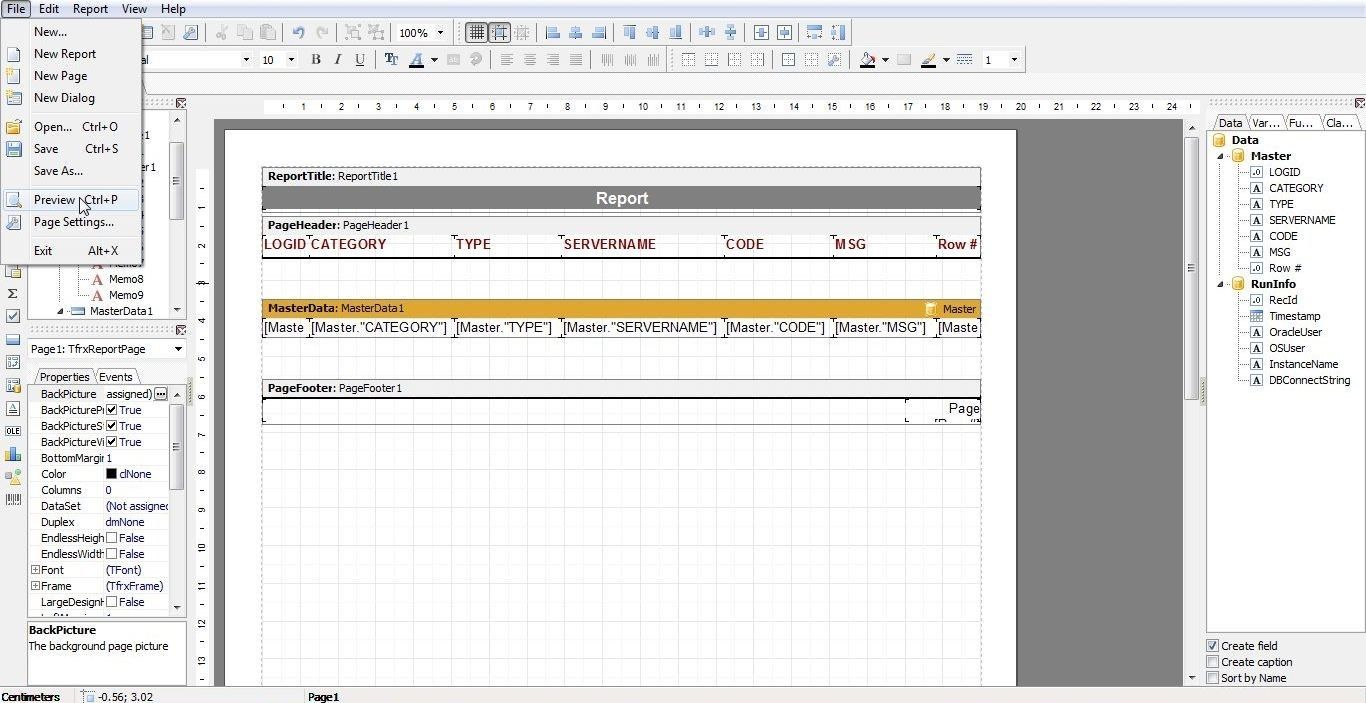
Figure 37. File>Preview
The report preview is shown in Figure 38.
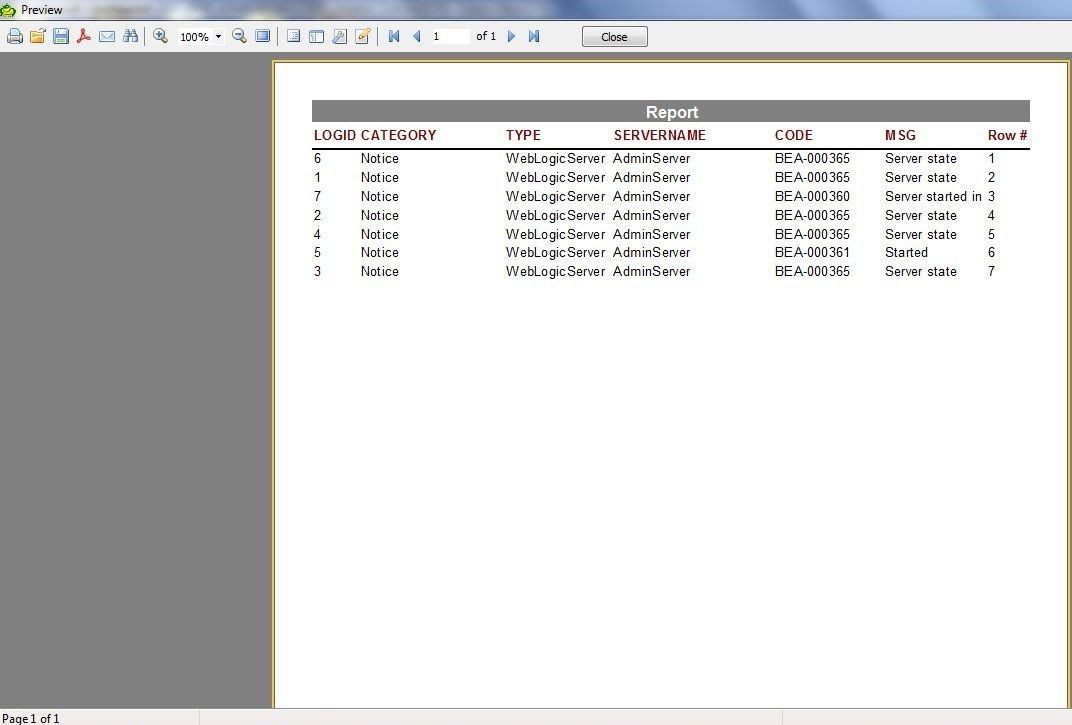
Figure 38. Report Preview
To save the report select File>Save As. Alternatively, select Save Report in the toolbar as shown in Figure 39. The report gets saved as an .fr3 extension file.
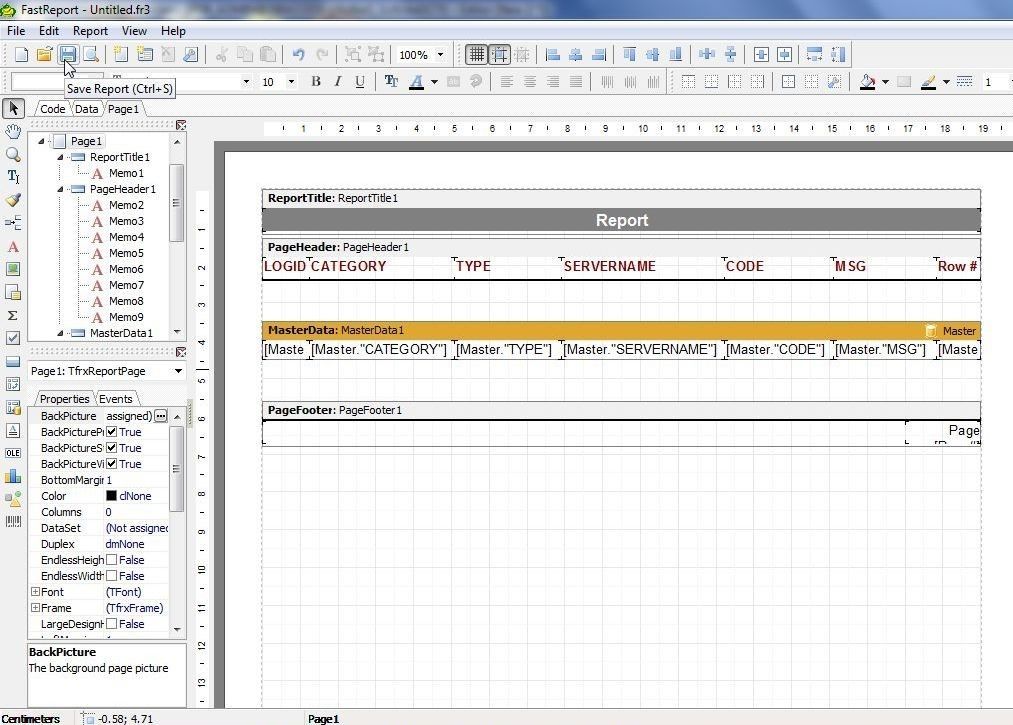
Figure 39. Save Report
The report may be exported to PDF; for which, right-click in the Preview and select Export to PDF as shown in Figure 40.
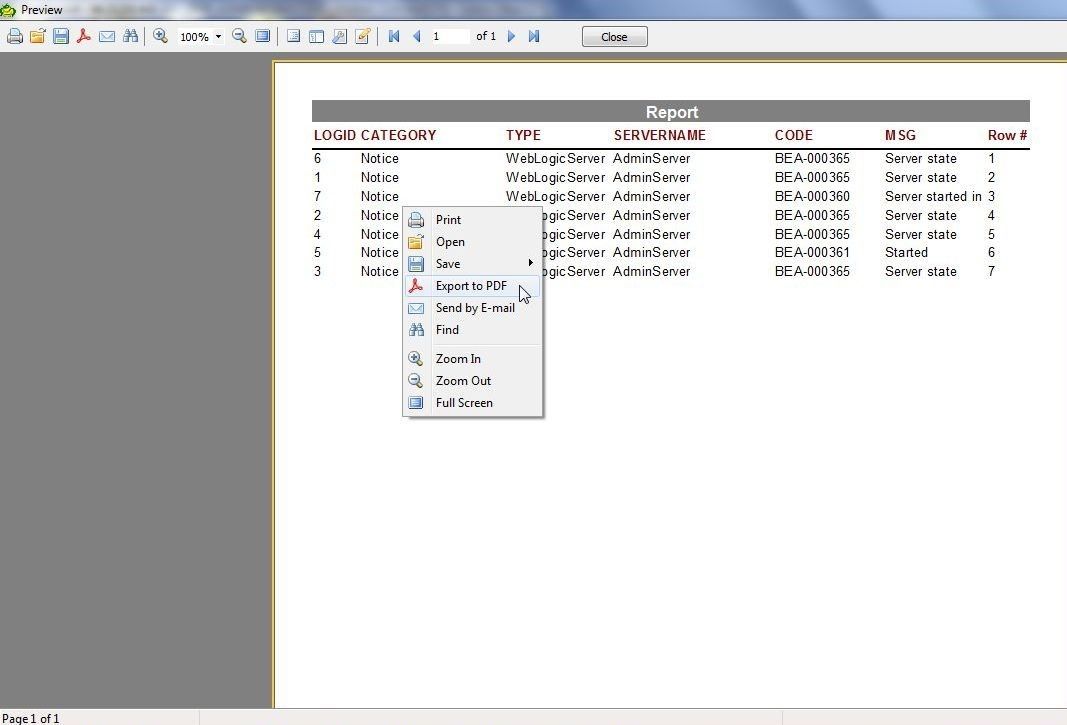
Figure 40. Export to PDF
In the Export to PDF dialog select Page range as All as shown in Figure 41. With other Export settings as default click on OK.
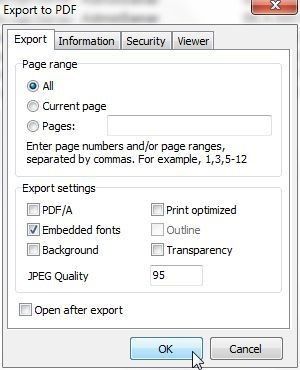
Figure 41. Export to PDF
In Save as specify a File name (WLSLOG) and click on Save. The PDF file exported is shown in Figure 42.
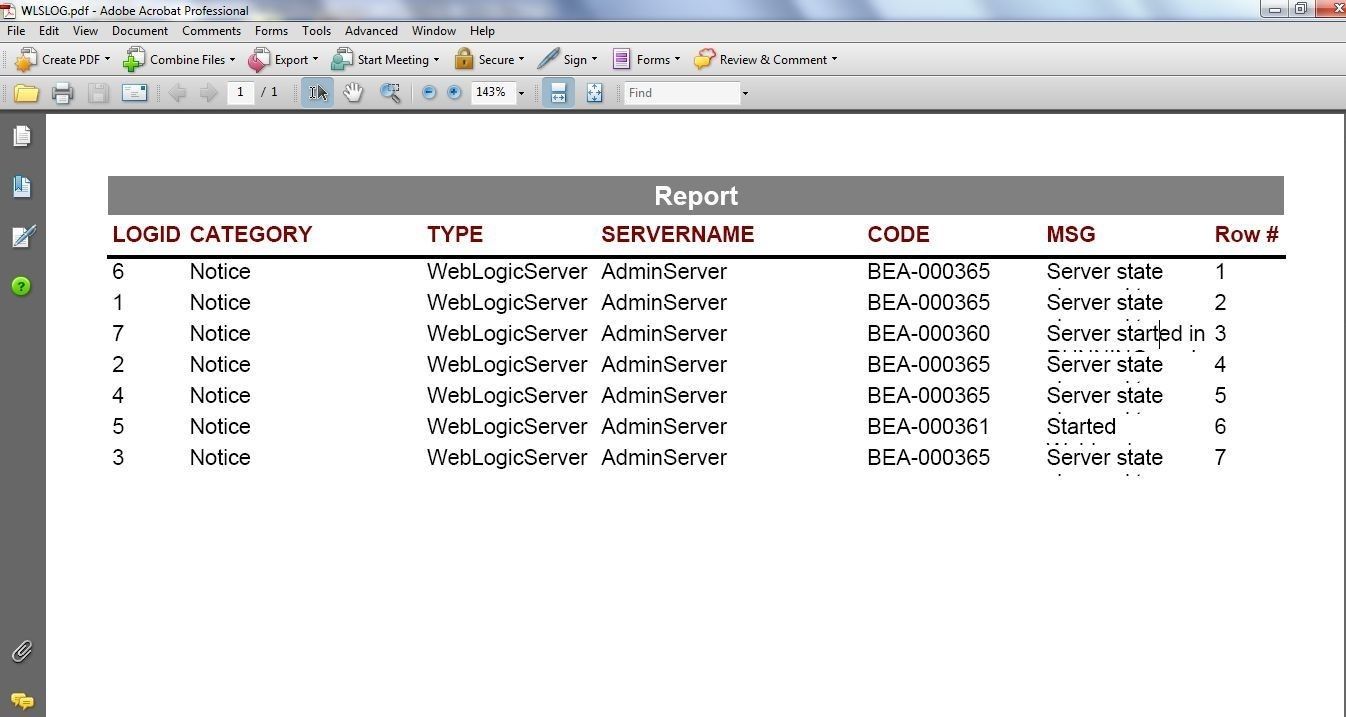
Figure 42. PDF File generated
Modifying a Report
A report may need to be modified. As an example, the Row# column in the report generated and shown in Figure 42 as a PDF is redundant. Also, the MSG column text is not displayed completely. In this section we shall modify the row using the report template. To make the MSG column value display completely we shall widen the column width in HeaderData. Select Header15, which is for the MSG column, and set Width to 20 or some other suitable value, as shown in Figure 43.
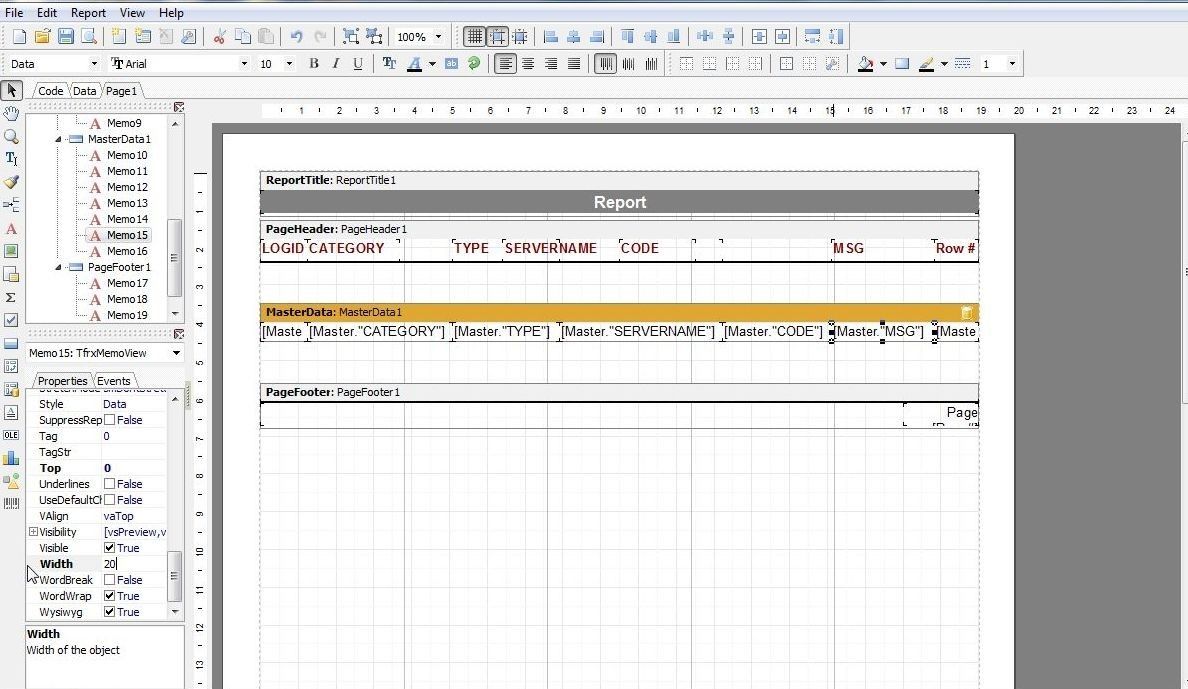
Figure 43. Setting Width of MSG Column
Next, widen the page width by setting Paper Width to 30 or some other suitable value as shown in Figure 44.
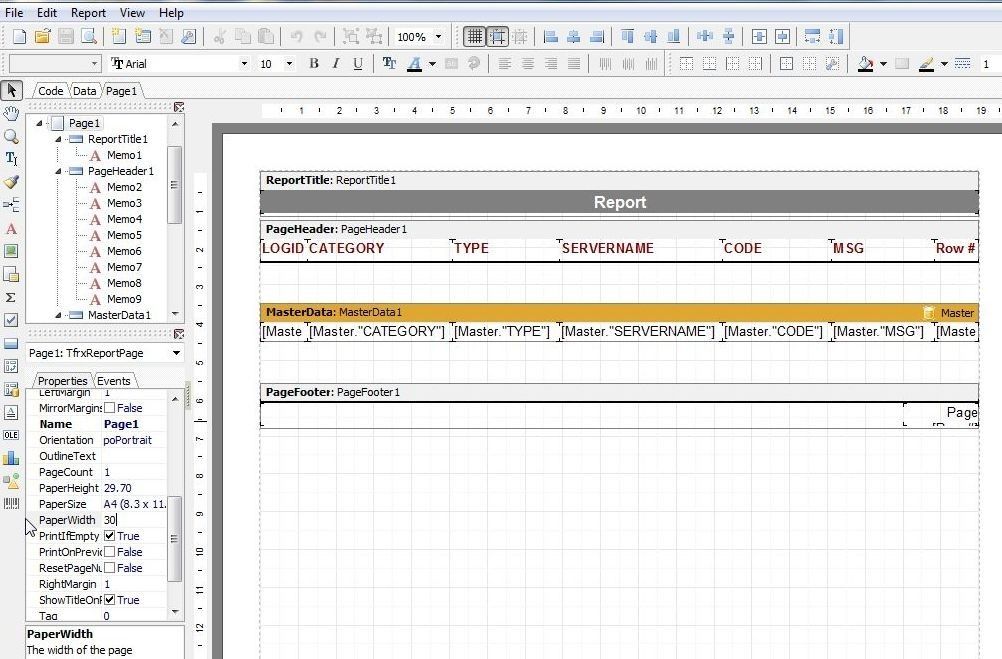
Figure 44. Widening Paper Width
To delete the Row# column select the column in the template, and right-click on click on Delete. Preview the report as before, and the MSG column value is displayed completely, as shown in Figure 45. TheRow# column has been deleted.
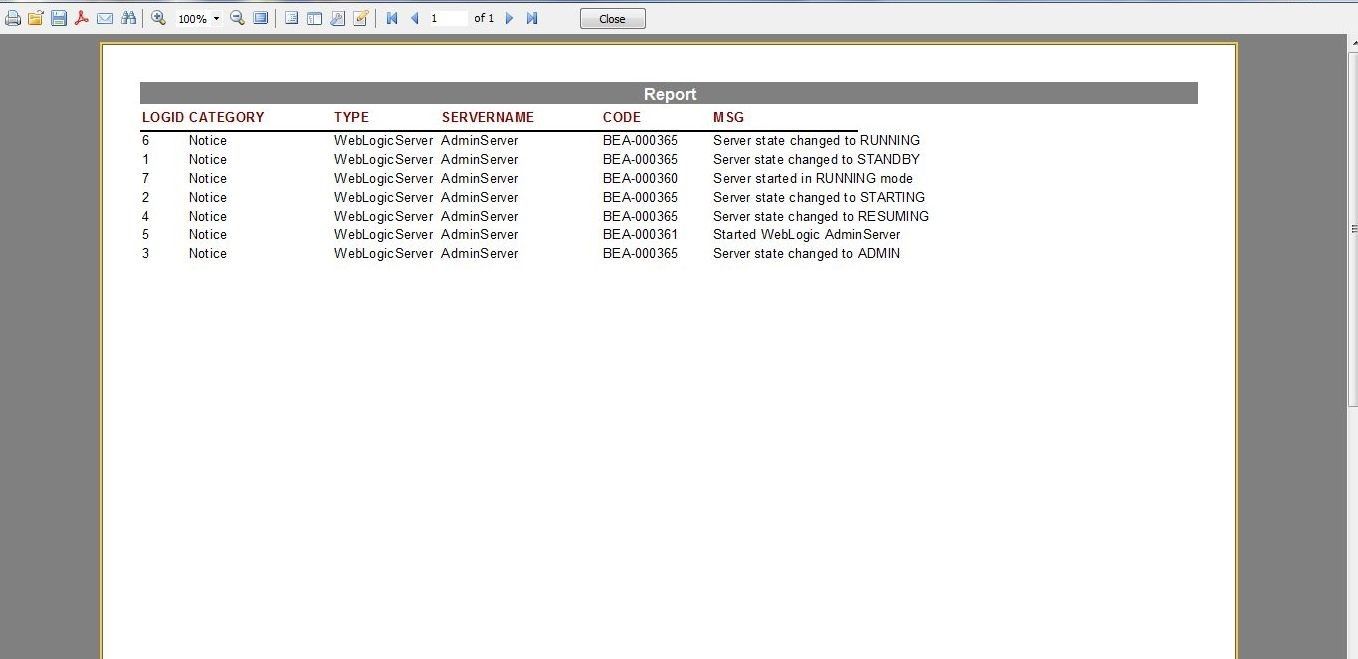
Figure 45. Report Modified
To save the report as a PDF file click on Save in the toolbar as shown in Figure 46.
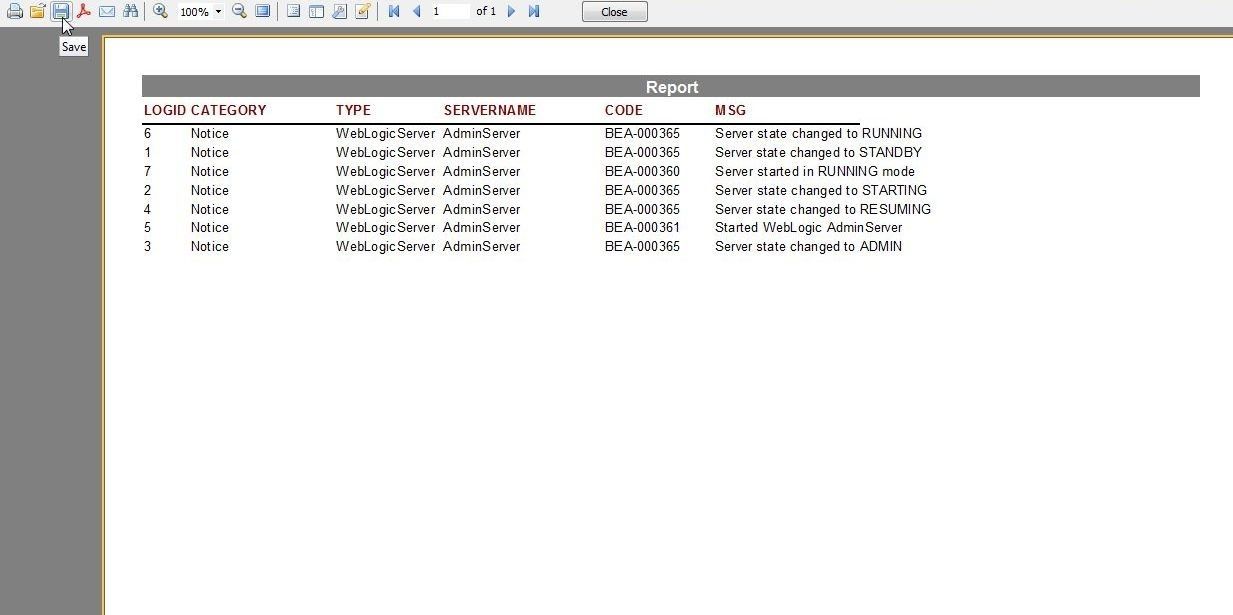
Figure 46. Save
Select PDF file… from the Save drop-down as shown in Figure 47.
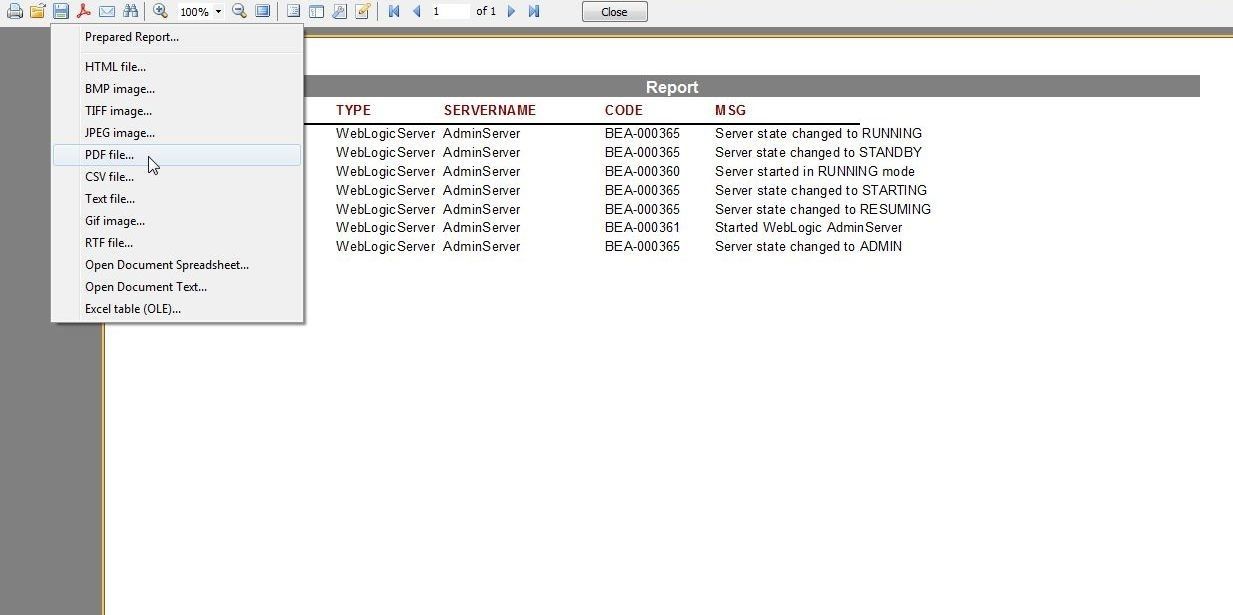
Figure 47. Save>PDF file…
The report in PDF format is shown in Figure 48.
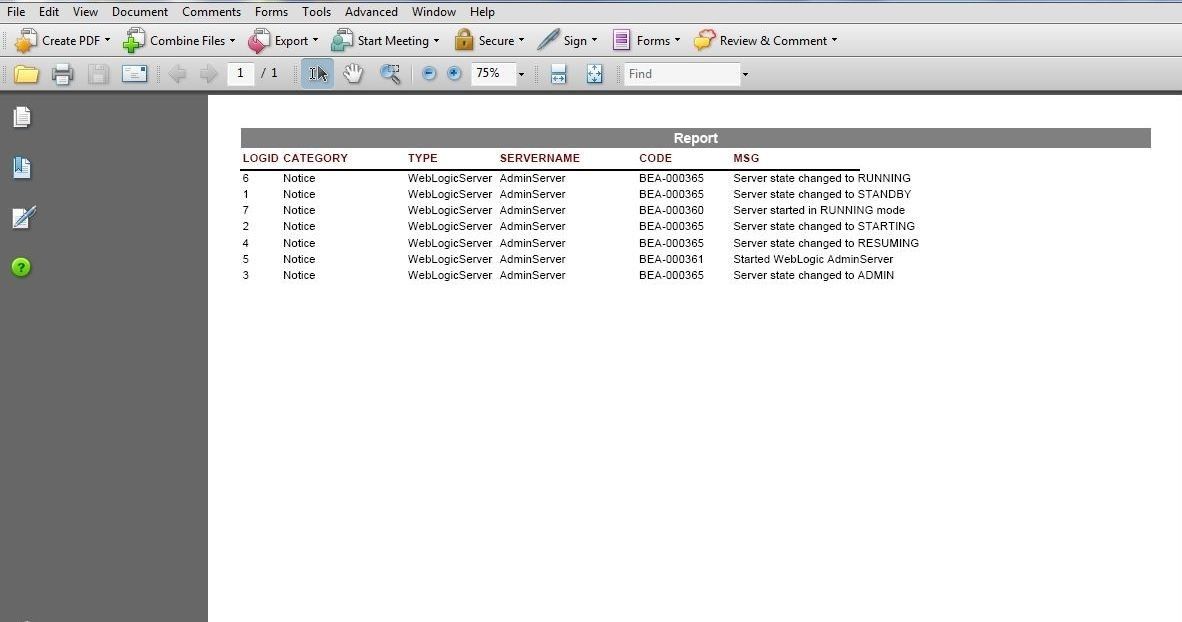
Figure 48. PDF Report
Deleting Exadata Instance
The connection to Oracle Database Exadata Express in Toad for Oracle may be closed by selecting Session>End Connection as shown in Figure 49.
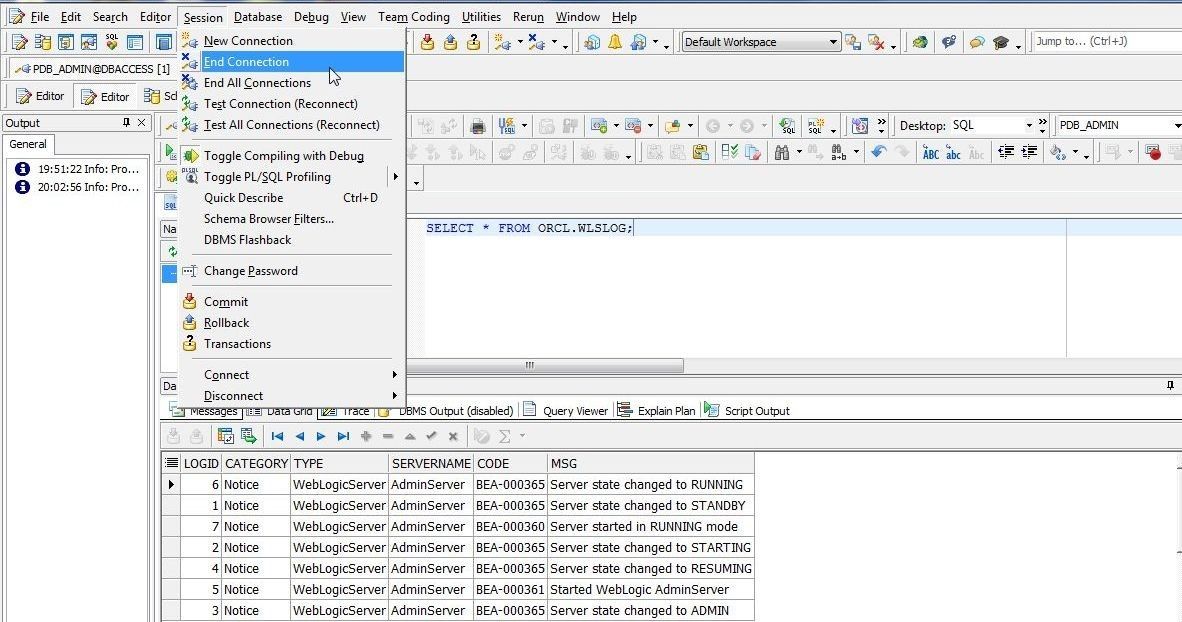
Figure 49. Session>End Connection
To delete the Oracle Database Exadata instance select Delete in the drop-down for the Exadata instance as shown in Figure 50.
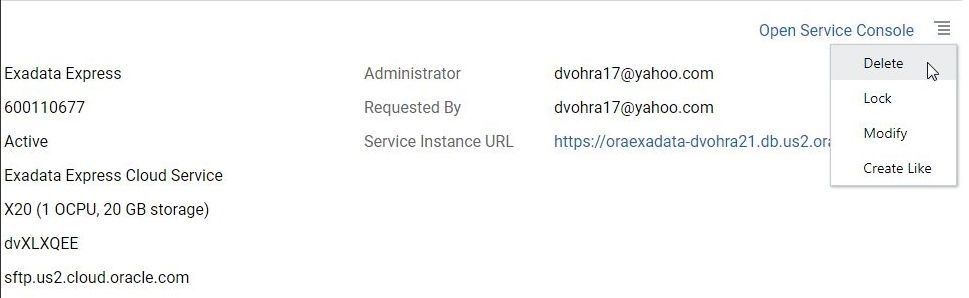
Figure 50. Instance>Delete
In the Delete Service Instance confirmation dialog click on Delete as shown in Figure 51.
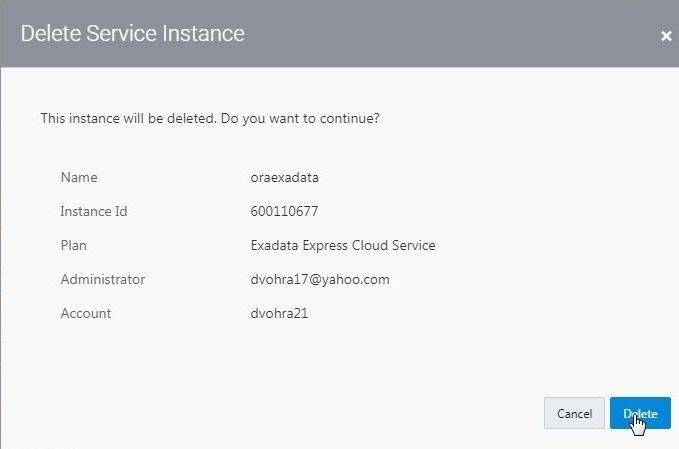
Figure 51. Delete Service Instance confirmation dialog
The Exadata Express instance starts to get deleted, as indicated by message shown in Figure 52.
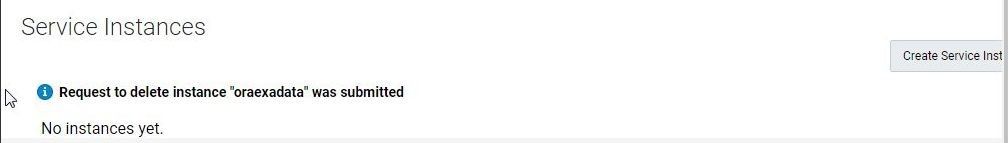
Figure 52. Request to delete instance ‘oraexadata’ was submitted
Conclusion
In three articles we discussed creating an Oracle Database Exadata Express instance in Oracle Cloud Platform, connecting to the instance with Toad for Oracle, and creating database tables. We also explored some of the other features of Toad for Oracle including comparing tables, comparing schemas, finding duplicate data, using the Schema Browser, exporting dataset to HTML Table, running a SQL Query, exporting query resultset data to Excel, finding data, and generating a report.
Start the discussion at forums.toadworld.com