In the previous parts of this article series, we started to look at Amazon AWS and its Relational Database Service (Amazon RDS); in particular, Amazon’s own Aurora database with PostgreSQL compatibility.
We examined in detail the benchmark results for PgBench and SysBench. We then had a look at the write IO traffic in an Amazon Aurora Database Node and saw for ourselves the improvements in the write flow.
Next, we examined the storage node architecture and found the “magic” behind the benchmark improvements. We also looked at the IO traffic in the read replicas as supported by Amazon Aurora. Since there were almost no writes being done on the replica, more resources were available to support read queries. This means the replicas can do more read work.
We will now look at the database cache and how it stays warm in the case of Aurora. In a traditional database, the database cache normally exists in the memory so long as the operating system database processes exist. When the database is shutdown or aborts, the database processes will cease and the database cache will also be lost.
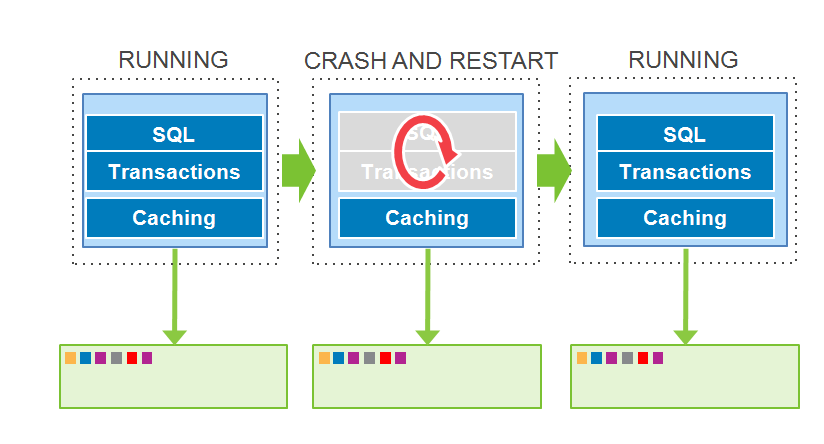
However, what happens in Aurora? The scenario of a running database, followed by a crash and restart, and what happens to the cache can be seen in the diagram below.

In the case of Aurora, the cache is moved out in the sense that it exists independently and is not reliant on the database processes. The cache will remain warm in the event of a database restart.
As a result, the database can resume fully loaded operations much faster. So the applications using Aurora databases can also restart faster due to the database caches that survive crashes.
Performance Insights
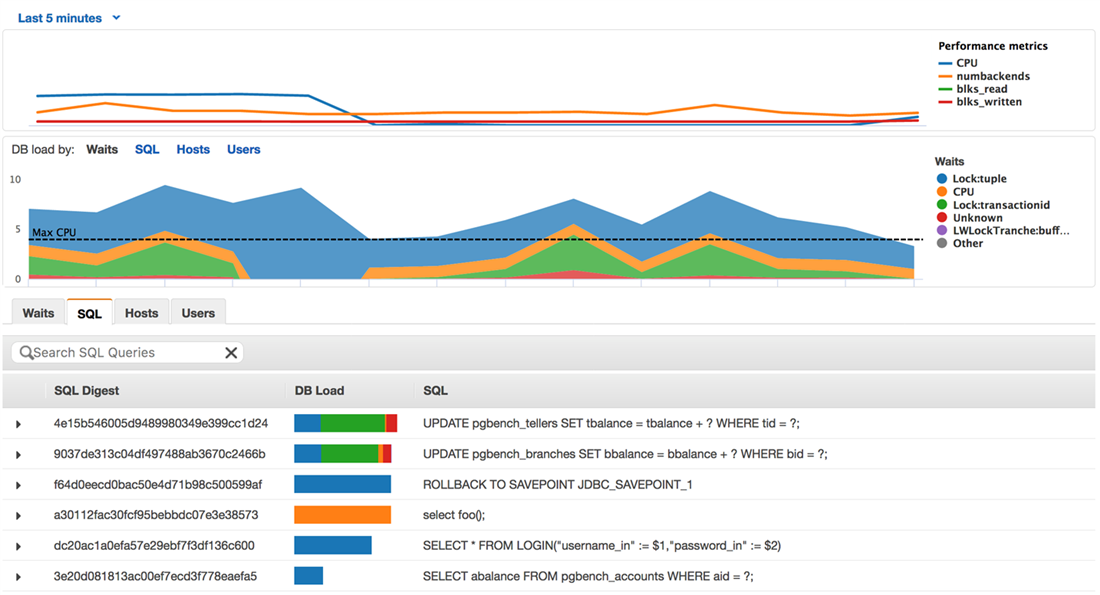
We will now examine the new “Performance Insights” recently released (2016) by AWS. This is a new cloud-based tool that is designed to help you to understand database performance at a very detailed level. You will be able to look inside of each query and learn more about how your database handles it.
Since Amazon RDS implies “managed” databases, customers who did not have deep tuning expertise requested an easy tool for performance management of databases, in a single pane of glass.
Other products like Oracle Enterprise Manager had been doing this for many years for Oracle databases, since the Oracle database was very complex and had many rich tuning possibilities. However they were on-premises installations of Enterprise Manager that looked at on-premise Oracle databases, and later at Oracle public cloud databases in a “hybrid” single pane of glass. On the cloud, Oracle decided to develop a new product known as the Oracle Management Cloud, rather than use Enterprise Manager itself.
So the new Amazon Performance Insights likewise automatically samples performance data and shows the database load in a GUI screen. Many people on LinkedIn have remarked that the screens look quite familiar, reminding them of Oracle Enterprise Manager’s Diagnostic Pack screens for the Oracle database.

The Performance Insights capability is included with RDS at no extra cost, and allows performance data (metric) retention up to 35 days. It will also help in database lock detection, display execution plans for the SQL queries, and allow API access to the metrics.
In the next and final part of this article series, we will look at more aspects of Performance Insights.
(Disclaimer: The views expressed in this article are the author’s own views and do not reflect the views of Amazon Web Services (AWS) or Oracle Corporation. The author has written this article as an independent, unbiased cloud architect/consultant. The information in this article is from AWS public presentations.)
Start the discussion at forums.toadworld.com