In this eight-part article series, we have had a good look at Amazon AWS and its Relational Database Service (Amazon RDS), in particular Amazon’s own Aurora database with PostgreSQL compatibility. In the previous part VII here, we looked at the database cache and how it stays warm in the case of Aurora. So the applications using Aurora databases can also restart faster due to the database caches that survive crashes.
Next, we started to examine the new AWS “Performance Insights” recently released in 2016. This is a new cloud-based console that is designed to help you to understand database performance, assist in database lock detection, display execution plans for the SQL queries, and allow API access to the database metrics. The captured data is retained for 35 days to enable you to look at past performance issues; for example, that “spike” on Saturday night when you get in on Monday.
Although the AWS Performance Insights console seems somewhat less powerful than the feature-rich and mature Oracle Enterprise Manager Diagnostic Pack (and its supplementary Tuning Pack), there is an interesting angle to the former. Performance Insights is actually intended to be database agnostic, and will feature support for all RDS database engines by the end of 2017. That’s interesting since the Oracle Diagnostic/Tuning packs were only meant for Oracle Enterprise Edition databases, not even Oracle Standard Edition databases or any other non-Oracle database. The other plus point is that AWS Performance Insights is included with the RDS subscription, and there are no extra license costs.
We will now look at more aspects of Performance Insights.
Log on to the AWS management console and click on the RDS Managed Relational Database Service icon, to move to the RDS Dashboard. This is displayed below.
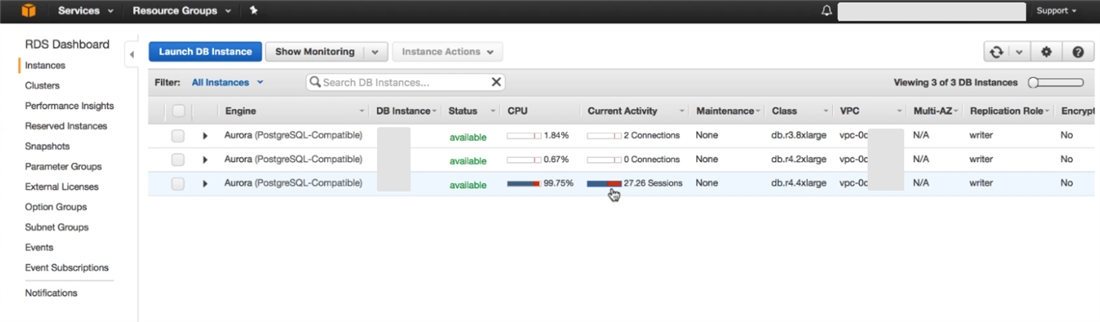
We can see that three databases have been pre-created, which are all Aurora PostgreSQL compatible databases. A new column “Current Activity” is now visible on the RDS dashboard. If you are managing a large number of databases, you can quickly take a glance at this column and see if there is any issue with the performance of any of the databases.
In our screenshot, a red bar is present in the current activity column for one of the databases, and the CPU is also 99.5% utilized. Click on the red bar to drill down to the Performance Insights dashboard for this particular database.
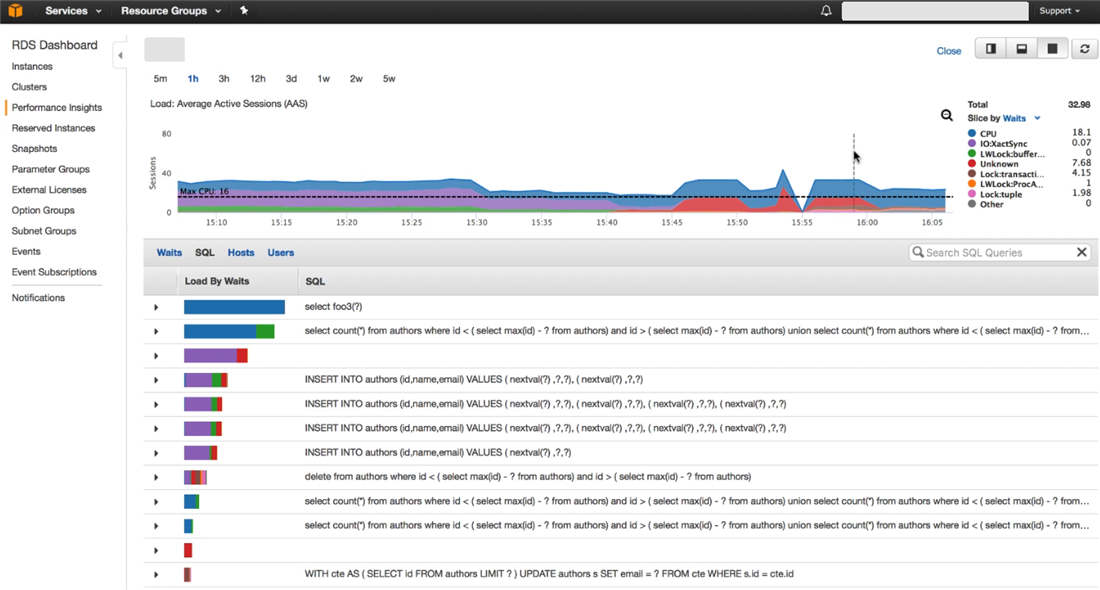
On the dashboard, the top half of the screen shows the load on the database, and the bottom half shows the Top SQL for that time period. The SQL statement with the highest database load is displayed at the start of the list.
From the load graph at the top, we can see that the load on the database has surpassed the dotted black line which signifies the maximum CPU cores for the database server. This has happened for most of the period shown. The number of active sessions is greater than the number of cores, and some sessions are therefore waiting for resources such as CPU or logs, IO, etc.
Click on the 5m label to display the last 5 minutes of activity.
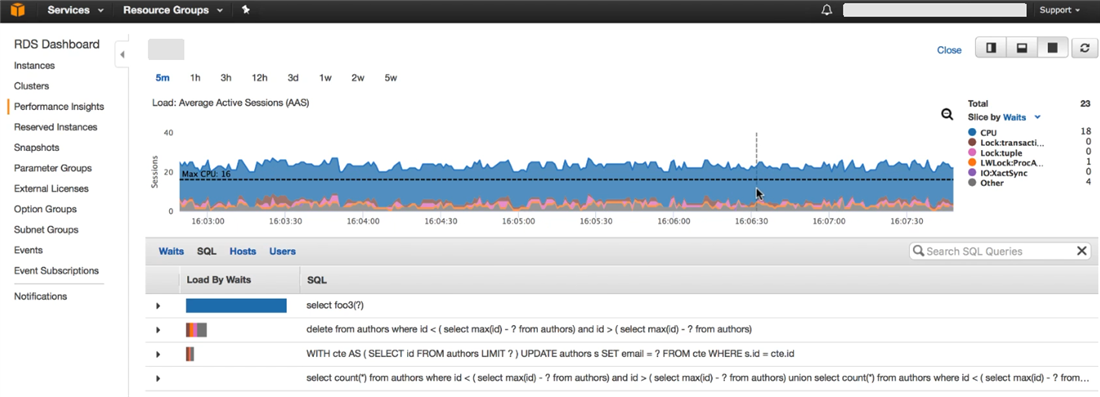
Most of the color displayed in the load graph is blue, which means a CPU wait as per the legend on the right. The bottom half of the screen shows one statement contributing to this blue portion. The DBA can now work on tuning this SQL statement so that the CPU load will be reduced.
As we have seen, there are different types of wait events, all documented, such as IO:XactSync, LWLock:buffer, Lock:transaction, Lock:tuple and so on (a tuple being a synonym for a row). Let’s have a look at other wait events. Click on the 3H label to display the last 3 hours. We find that at times, a different wait event with a different color is causing most of the database load, as can be seen below.
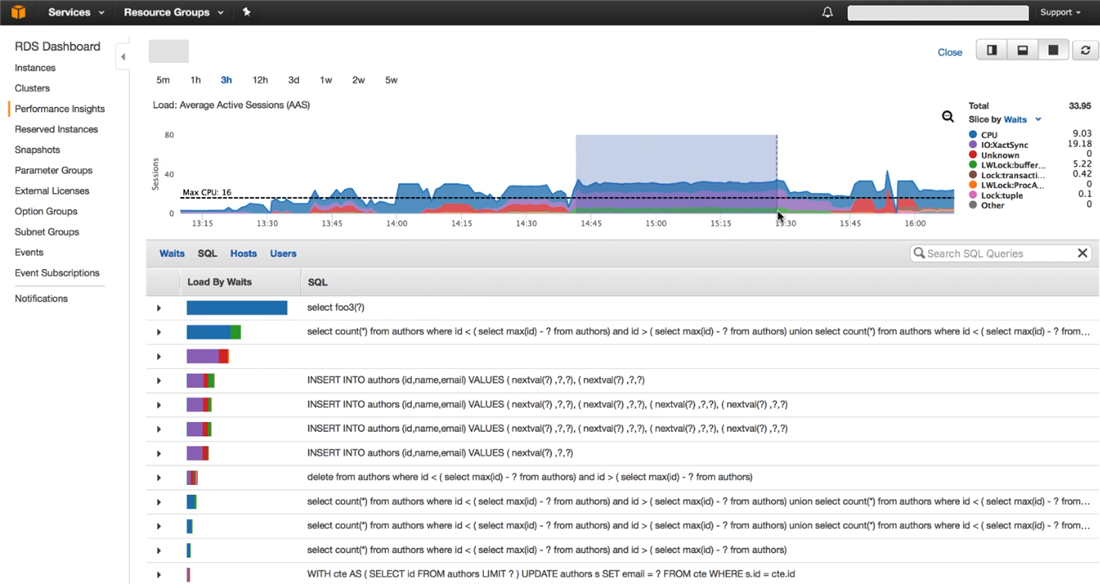
You can select a particular time period by a click and drag. In this case we have selected the high IO:XactSync load portion of the graph, which then drills down to that time period.
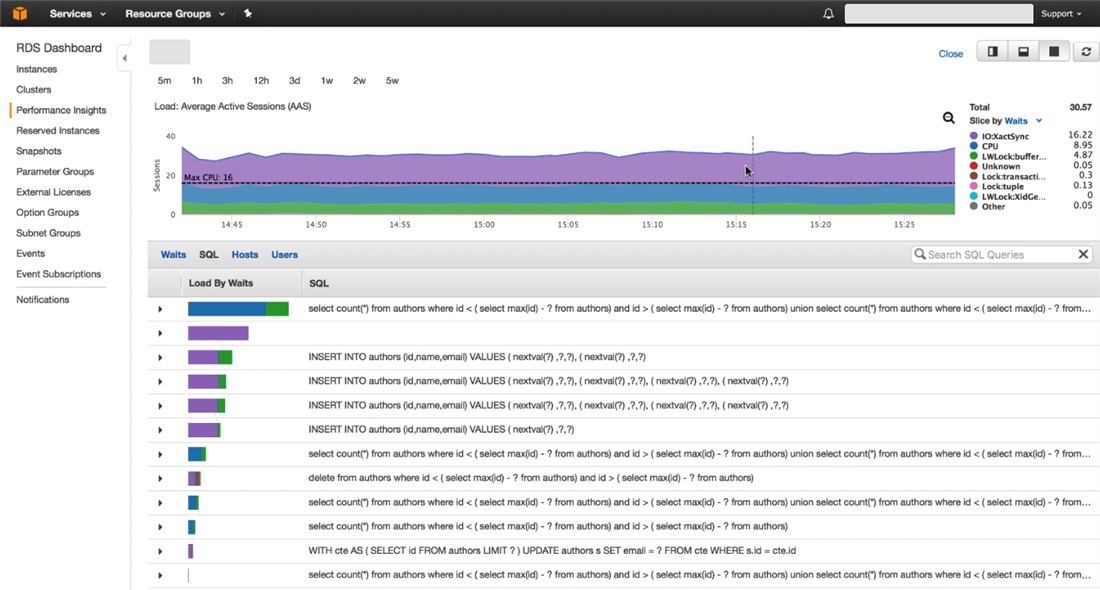
The top SQL is also displayed accordingly for that time period, and you can see which statements are causing the highest IO:XactSync. This wait event is for writing to the log file. Most of these are insert statements, as can be seen in the Top SQL in the above screenshot.
These insert statements are performing a lot of commits, and hence the log writes. The green wait event seen in the graph is the LWLock:buffer. The session is waiting to modify a buffer that another session is currently modifying. This has probably happened due to multiple concurrent inserts. The way to tune this application would be to bulk insert multiple rows rather than single inserts.
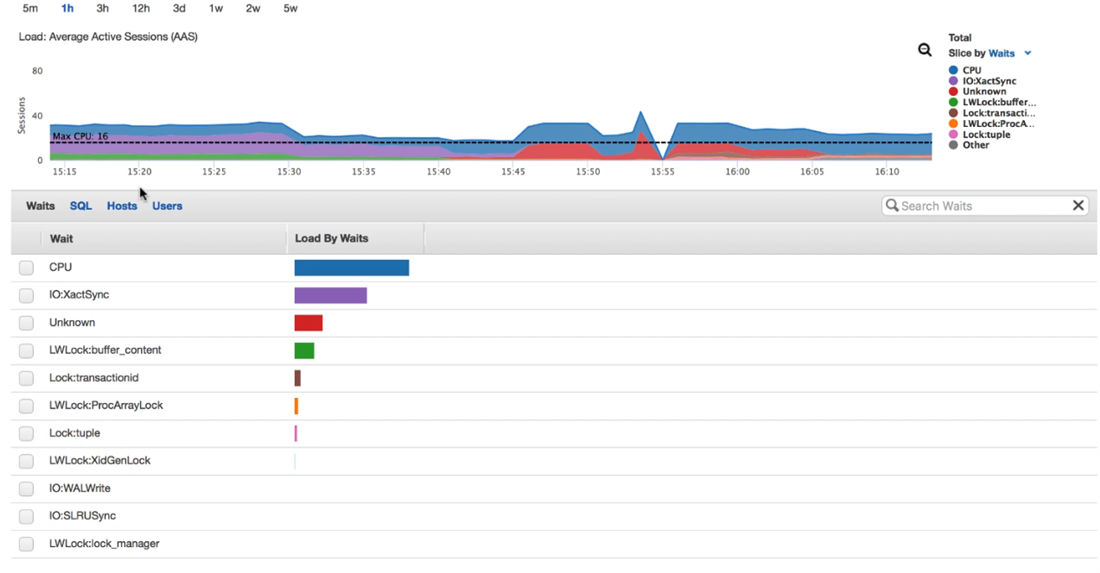
It is possible to group on waits rather than the top SQL, by clicking on the waits tab in the bottom half of the screen.
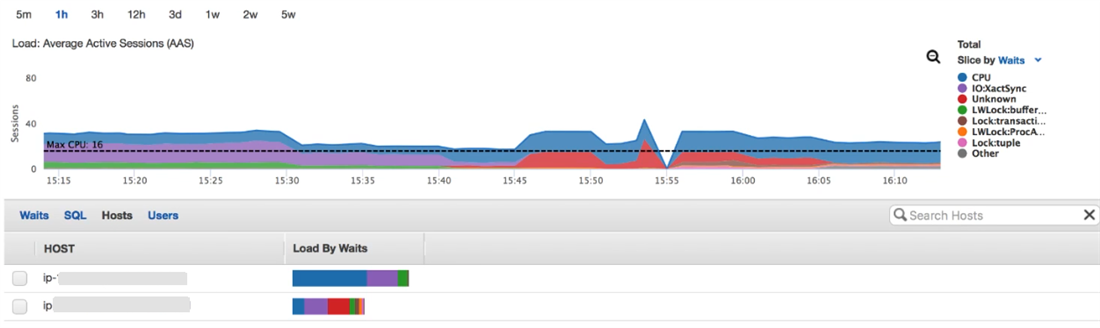
Or, you can group by hosts to get an idea of the different wait events on each host:
You can also select a larger time period such as 2 weeks; and then investigate performance spikes as can be seen in the screenshot below.
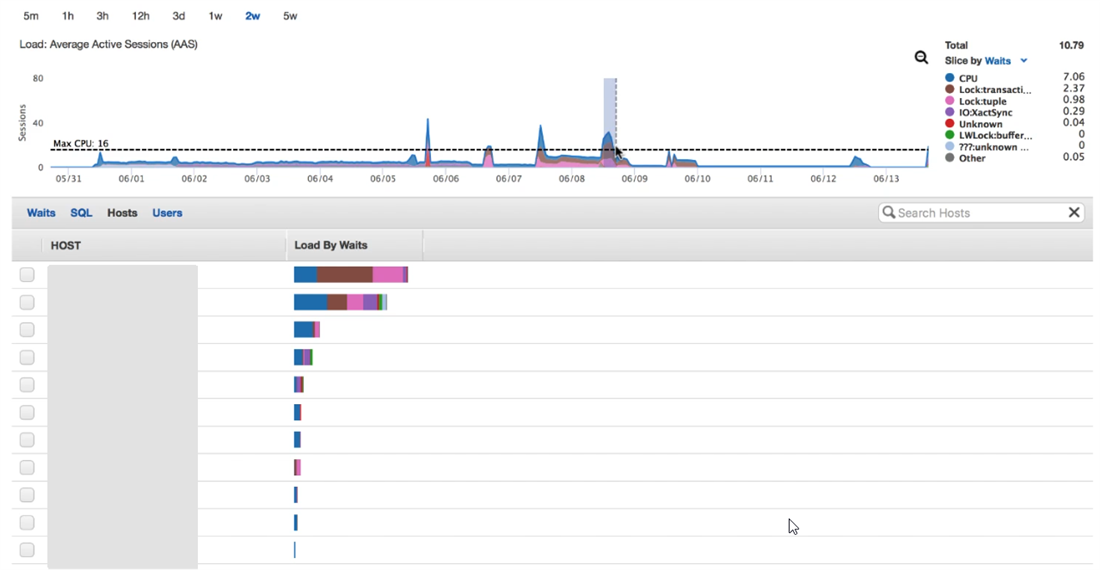
When you select (via click and drag) and drill down on this spike, and then examine the top SQL, you can find the following major wait events that caused the spike.
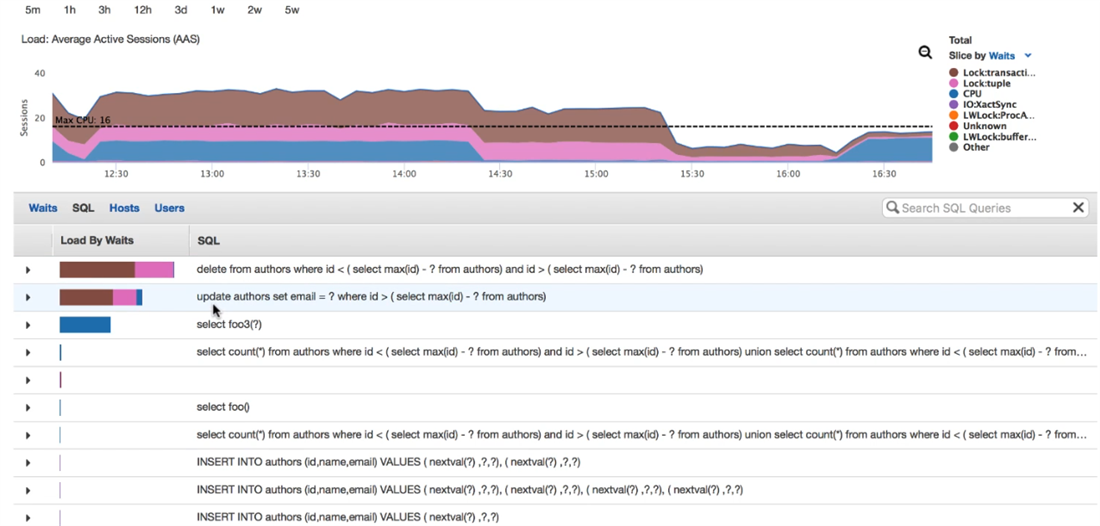
There is a Delete statement and an Update statement at the top of the list, and the wait events are Lock:transaction and Lock:tuple. This means the statements are competing with each other waiting for locks. The application would need to be modified to prevent this happening.
Note that while AWS Performance Insights does give a good overview, knowing what to do with the metric information obviously requires some performance tuning expertise on part of the DBA. No advice on tuning is provided by the AWS Performance Insights console itself, as we have seen in the case of the Diagnostics/Tuning pack of Oracle Enterprise Manager. But it is a good start nevertheless, especially because AWS Performance Insights is meant to be database agnostic in the future, and the other plus point is that the usage license is included in the RDS subscription .
In conclusion, there are quite a number of benefits to using Amazon Aurora with PostgreSQL compatibility, and it does keep getting better. Now all we need is a way to scale writes across the database replicas, and make them active-active – perhaps in the future. Likewise for the new Performance Insights, which seems to be a solid foundation that can be built on with more enhancements – possibly expert advice and automated database tuning; as seen in other more powerful products like Oracle Enterprise Manager.
We have now completed this article series. Hope you found it useful. The next article series will be based on an even more interesting implementation of PostgreSQL, namely EnterpriseDB's EDB Postgres Advanced Server. And this implementaion seems to be even more Oracle compatible and enterprise-ready. Wait for it.
(Disclaimer: The views expressed in this article are the author’s own views and do not reflect the views of Amazon Web Services (AWS) or Oracle Corporation. The author has written this article as an independent, unbiased cloud architect/consultant. The information in this article is from AWS public presentations.)
Start the discussion at forums.toadworld.com