In this second article we delve further into six Quest® Toad ® for Oracle features that could be used to create a table and such.
Oracle Autonomous Database is a self-driving database that requires almost no DBA-initiated management. Automated patching, upgrades and tuning, backups, scaling, and other routine database management tasks while the database is running make the autonomous database self-driving, self-securing, and self-repairing. The autonomous database offers several benefits including high availability, and unmatched performance. The database, recently scoring highest in all Use Cases in a Gartner report, recovers automatically from failure with 99.995% uptime guaranteed. Compute and storage are scaled elastically as needed with no downtime.
Two versions of the database are available, Autonomous Transaction Processing (ATP) and Autonomous Data Warehouse (ADW). Each of these is designed for a different type of workload. ATP is optimized for online transaction processing (OLTP) with low response time, and application development. ADW is optimized for complex data analytics over large volumes of data.
Self-driving and all the other autonomous features only refer to the administration of Oracle Autonomous Database. You still need a client to connect with Oracle Autonomous Database, and Toad for Oracle provides a one-stop integrated development environment to connect with, and use Oracle Autonomous Database.
Quest® Toad® for Oracle may be used with either ATP or ADW. This is the second article about this topic.

In the first article we discussed provisioning an Oracle Autonomous Database instance, downloading and setting up connection credentials, setting environment variables, creating a connection in Toad for Oracle, and exploring the Oracle Autonomous Database in the Database Browser wizard in Toad for Oracle.
In this second article we delve further into six Toad for Oracle features that could be used to create a table and such in the following sequence:
- Create a Database Table
- Use Schema Browser
- Add Table Data
- Use Query Builder
- Export Dataset
- Create a Report
Creating a database table
To create an example table called wlslog to store WebLogic server log data, copy the following CREATE TABLE SQL statement to an Editor (SQL Worksheet) associated with an open connection in Toad for Oracle.
CREATE TABLE wlslog(logid INT PRIMARY KEY,timestamp VARCHAR(255),category VARCHAR(255),type VARCHAR(255),servername VARCHAR(255),code VARCHAR(255),msg VARCHAR(255));
To format the SQL statement, right-click in the Editor and select Formatting Tools>Format (Figure 1).
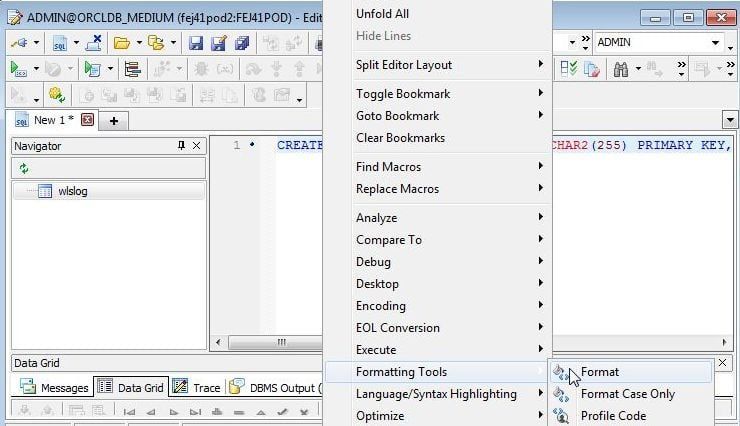
Figure 1. Formatting Tools>Format
The SQL statement gets formatted. To run a SQL statement several options are available. The first option is to selectExecute/Compile Statement (Figure 2), which is suitable if only a single statement is to be run.
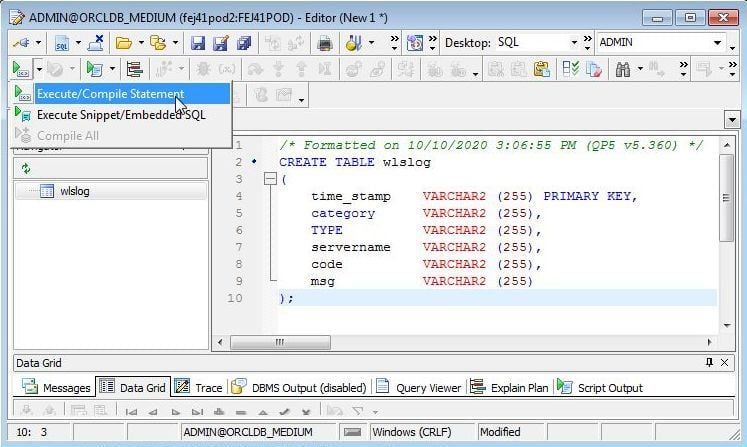
Figure 2. Execute/Compile Statement
Another option is to select Execute via Toad Script Runner (Figure 3), which is suitable if a multi-statement SQL script is to be run.
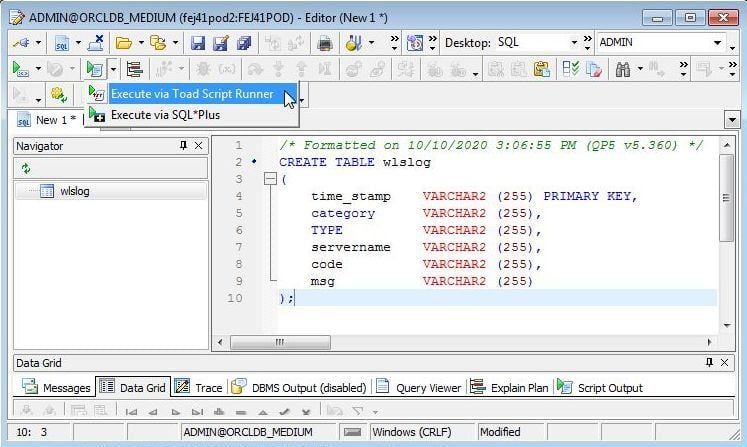
Figure 3. Execute via Toad Script Runner
The table gets created as indicated by a message in Output in Figure 4.
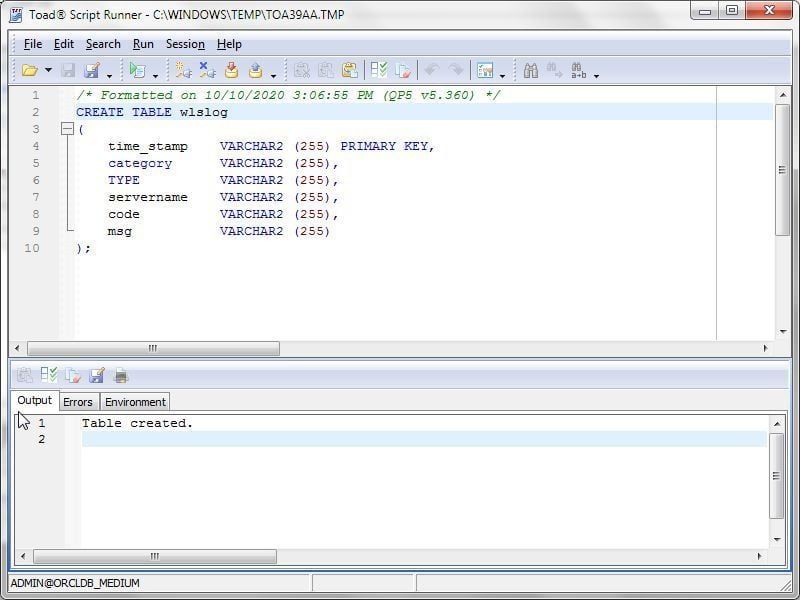
Figure 4. Output>Table created
The new table wlslog is listed in the Navigator (Figure 5).
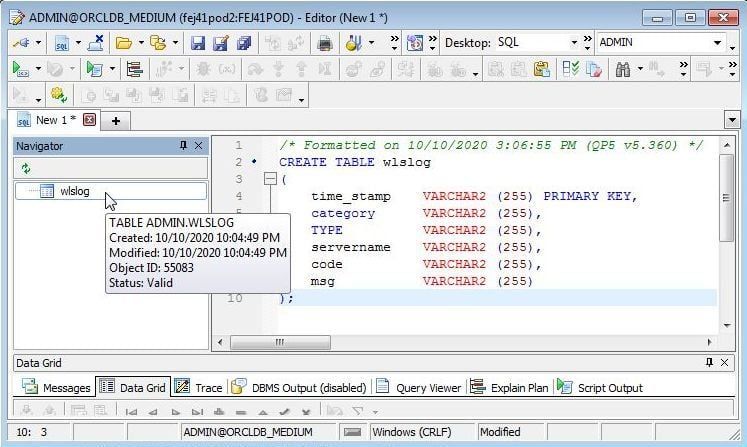
Figure 5. Navigator>wlslog
Describing a table
To describe a table, or list the data definition, copy SQL DESC wlslog; in an Editor SQL worksheet, and click on Execute as script (Figure 6).
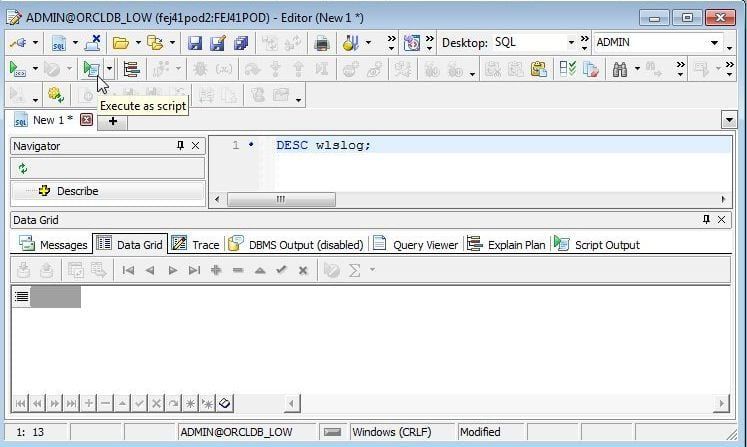
Figure 6. Run a script to describe a table
The Output tab (Figure 7) lists the table definition.
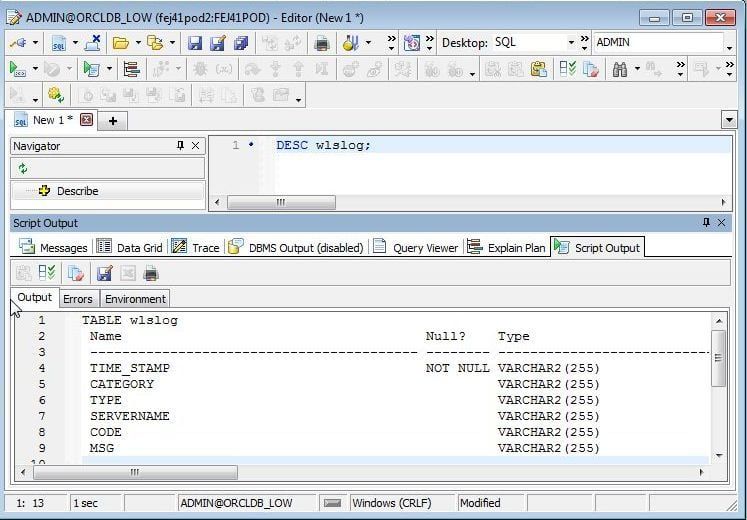
Figure 7. Table Definition
Using Schema Browser
The Schema Browser wizard is used to browse a schema and database objects in the schema. Schema Browser has several other features that could be used for adding, navigating, and deleting data. To launch the Schema Browser select Database>Schema Browser (Figure 8).
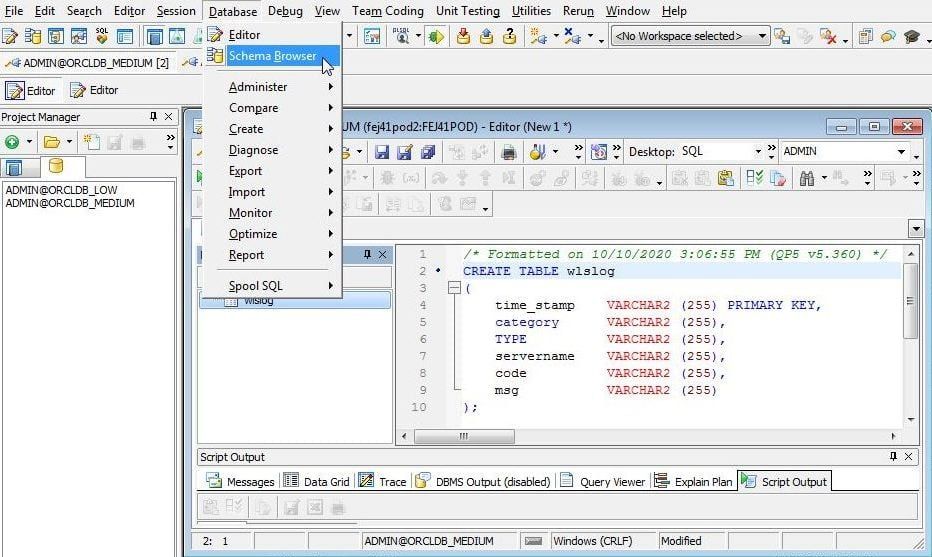
Figure 8. Database>Schema Browser
Schema Browser (Figure 9) gets launched. The ADMIN schema that we connected to the WLSLOG table is listed. Click on the WLSLOG.
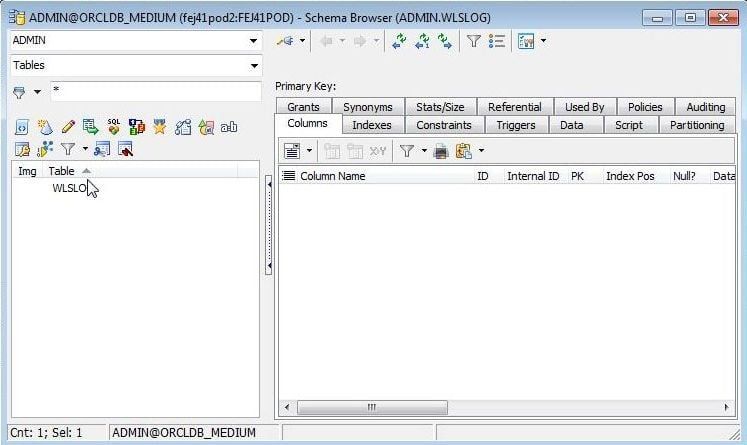
Figure 9. Schema Browser
The Columns (Figure 10) tab lists the table columns. Right-click on the columns table and select Size Columns to format the columns.
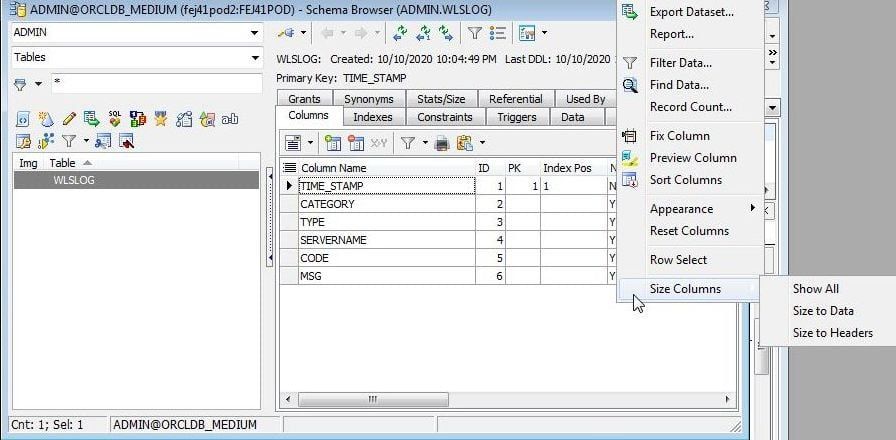
Figure 10. Size Columns
The formatted columns are shown in Figure 11.
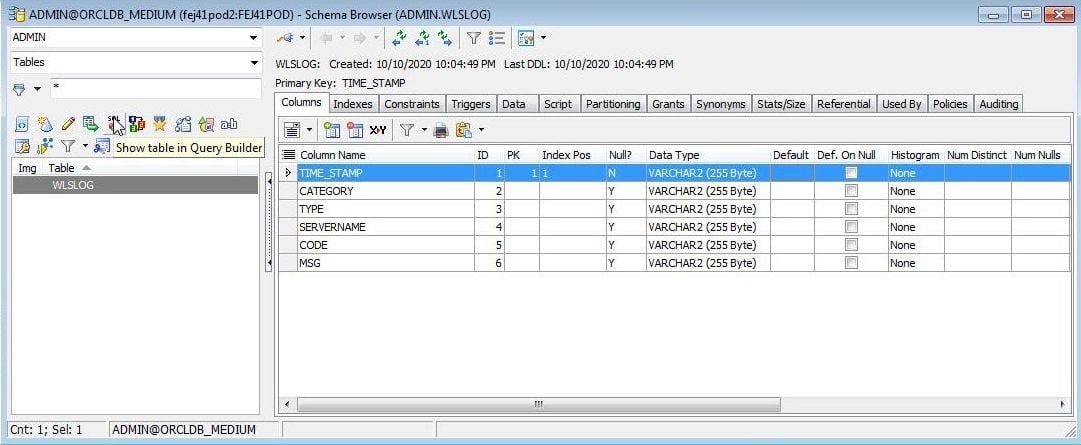
Figure 11. Formatted columns
Schema Browser provides tabs for the different table constructs such as indexes, constraints and synonyms. Select the Constraints tab (Figure 12) to list the constraint columns.
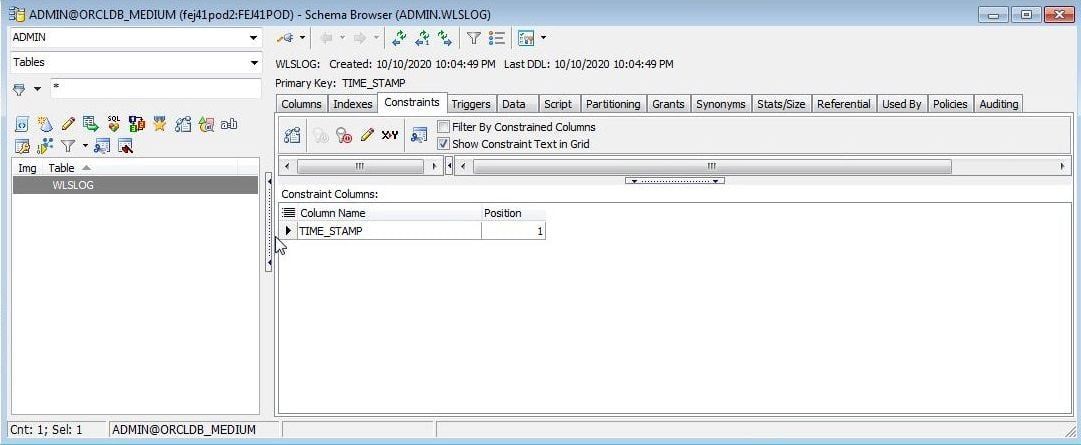
Figure 12. Column Constraints
Two options are available for adding data; use the Schema Browser, or run a SQL script. Both options are discussed next.
Adding table data from Schema Browser
To add data from the Schema Browser click on Insert record (Figure 13).
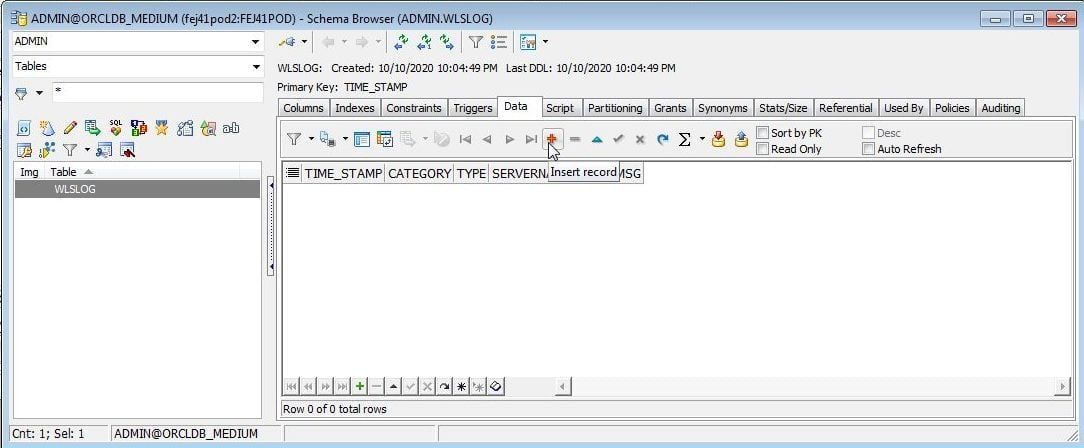
Figure 13. Insert record
A new empty row of data gets added (Figure 14).
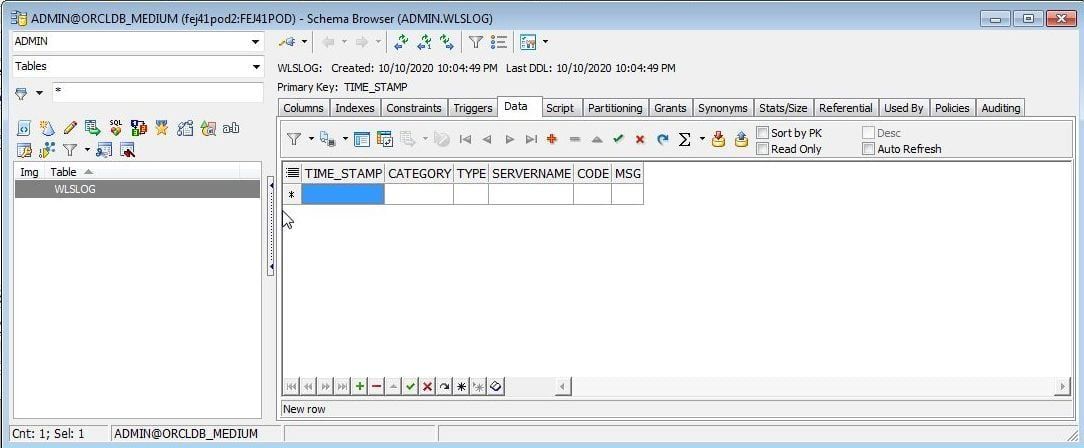
Figure 14. A new empty row of data
Add data in the columns. As an example, add the following column demarcated data.
Apr-8-2014-7:06:20-PM-PDT,Notice,WebLogicServer,AdminServer,BEA-000361,Started WebLogic AdminServer
Initially the data grid may not be well formatted as shown in Figure 15. Right-click on the data grid and select from one of the options such as Fix Column, Sort Columns, and Reset Columns.
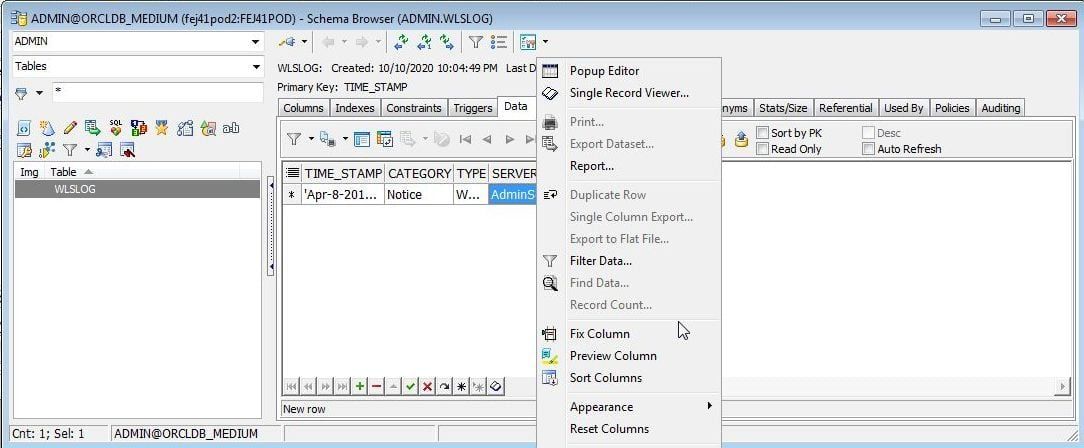
Figure 15. Data formatting options
Formatted data is shown in Figure 16. Further, each column data may be edited using a Popup Editor by double-clicking on a column.
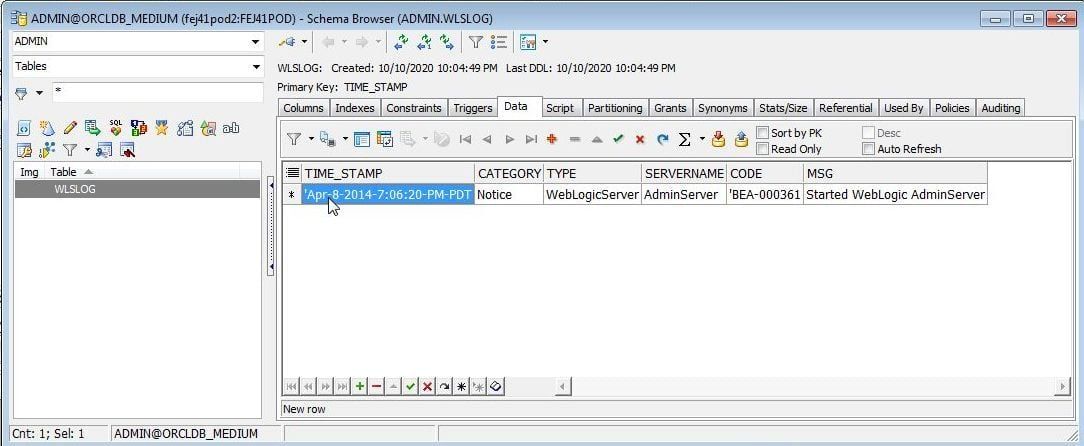
Figure 16. Formatted Data
A Grid Popup Editor (Figure 17) gets displayed. Edit data if needed and click on Post Edit. Other options include navigate data, save data, and Cancel Edit.
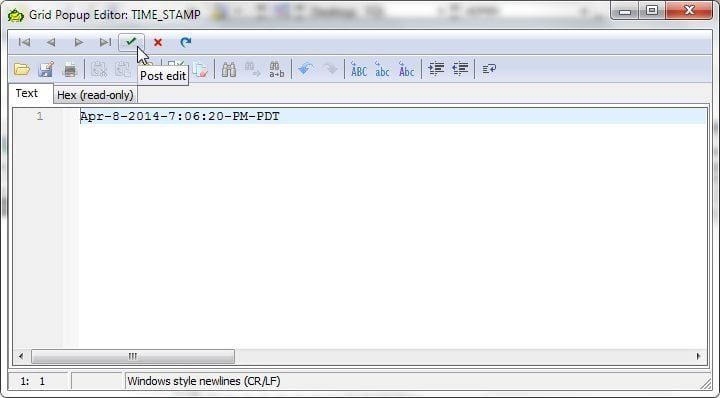
Figure 17. Grid Popup Editor
To add another row of data click on Next record (Figure 18).
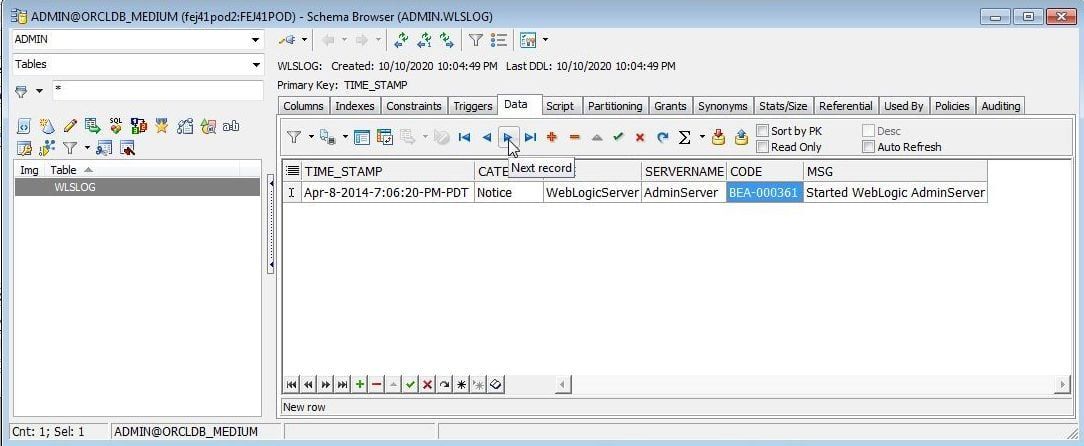
Figure 18. Next record
A new empty row of data gets added as shown in Figure 19.
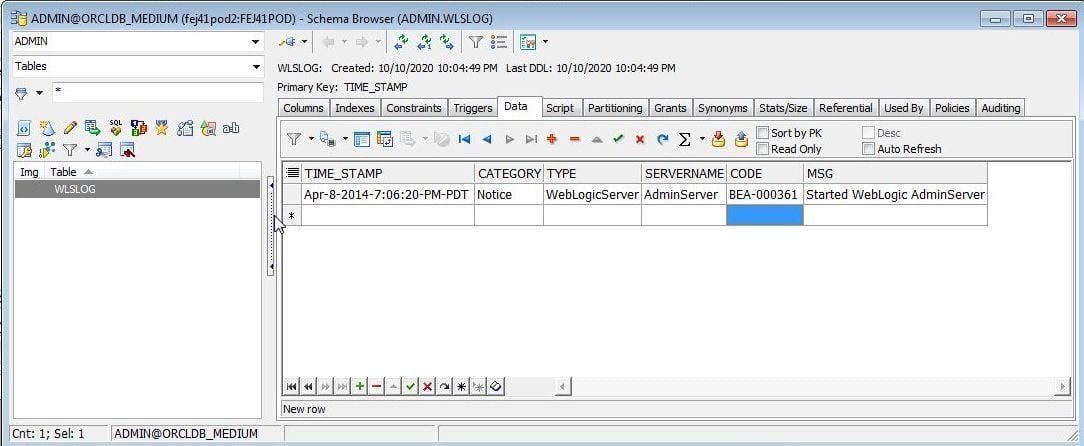
Figure 19. A new empty row of data
Add a new row of data as shown in Figure 20.
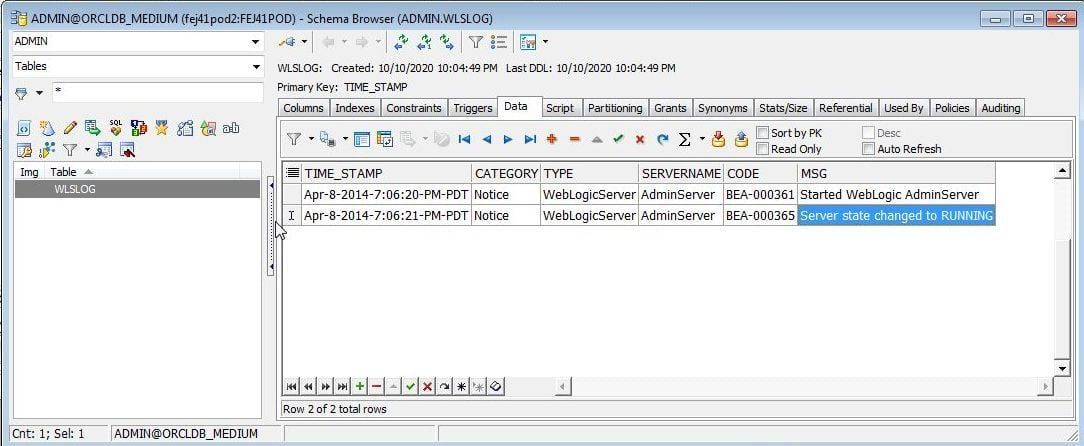
Figure 20. A second row of data
A row of data may be deleted with Delete record (Figure 21).
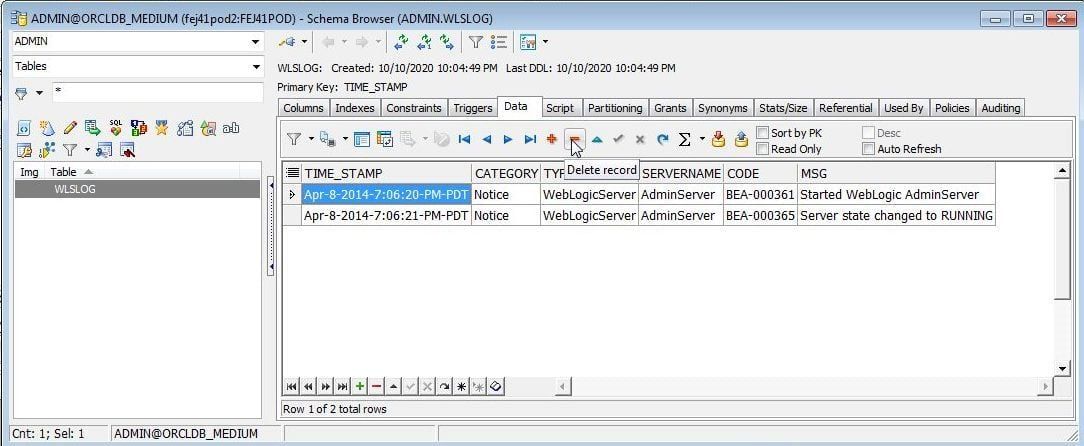
Figure 21. Delete record
To auto refresh data displayed click in the Auto Refresh checkbox (Figure 22).
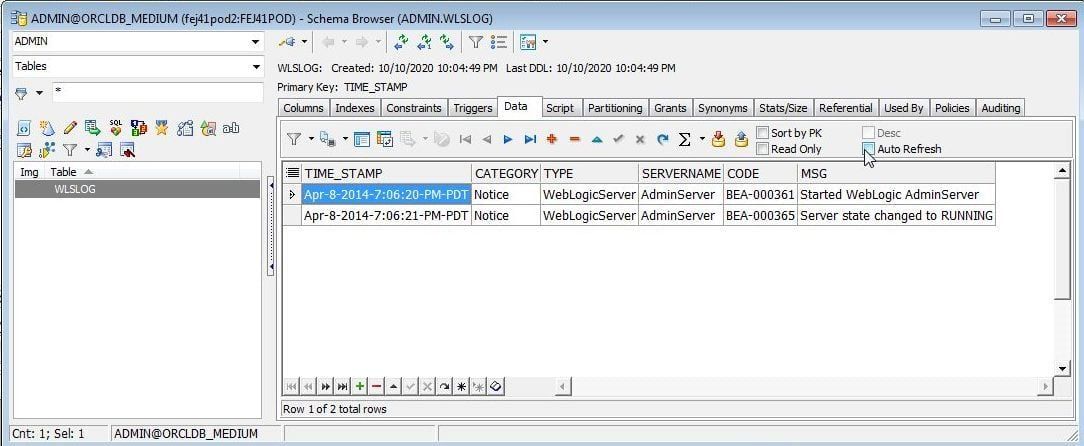
Figure 22. Auto Refresh
In the Auto Refresh Data Grid dialog (Figure 23) specify interval (in seconds) after which data should refresh, and click on OK.
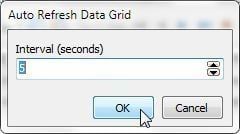
Figure 23. Auto Refresh Data Grid
Another feature is to Sort by PK (primary key). Schema Browser provides several other features such as Export dataset (Figure 24).
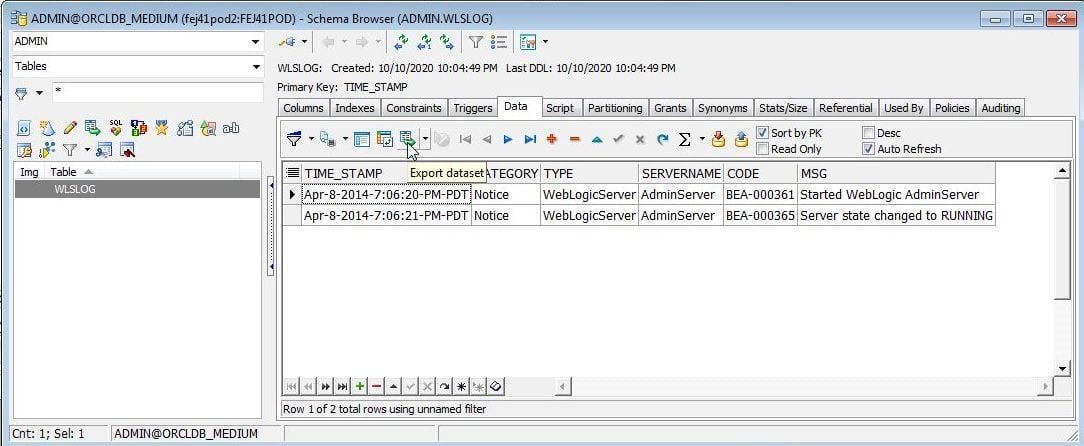
Figure 24. Export dataset
Another feature is to export table DDL as a SQL script with Create Script (Figure 25).
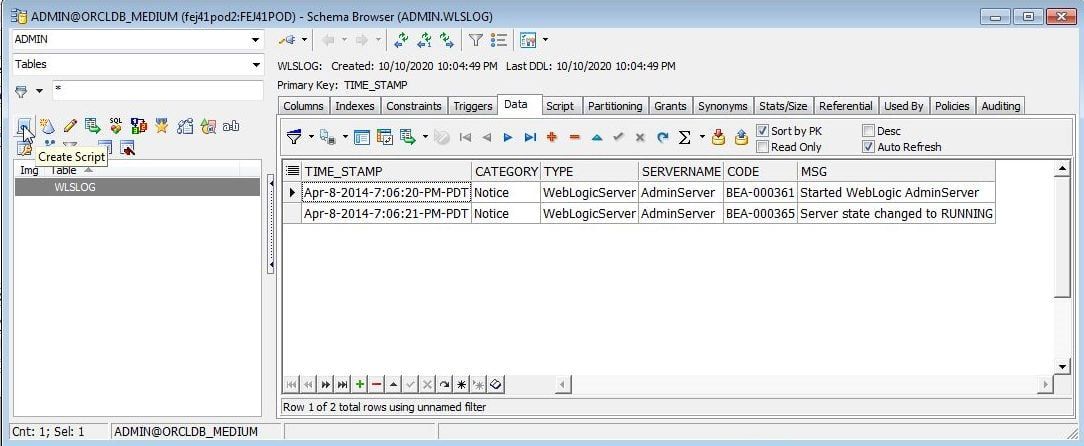
Figure 25. Create Script
Select the database objects and other Script Options in the Export DDL wizard (Figure 26).
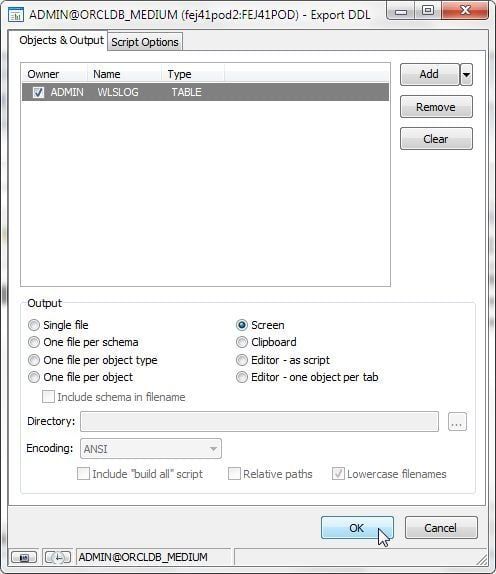
Figure 26. Export DDL Wizard
The DDL Script, which includes DROP TABLE, CREATE TABLE , and ALTER TABLE statements, gets displayed in a window as shown in Figure 27. The Scripts tab in the Schema Browser displays the same script.
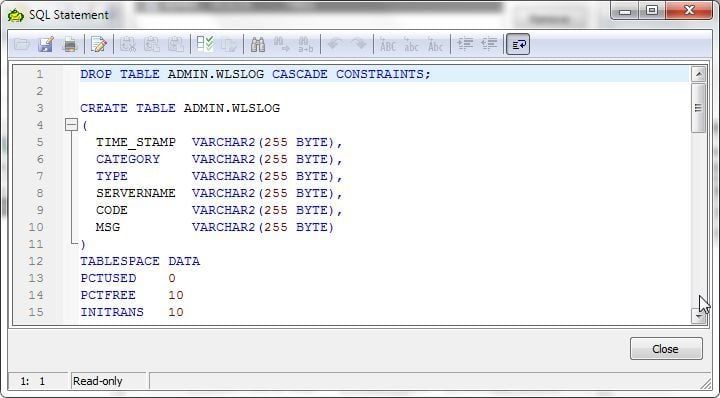
Figure 27. SQL Statement
A new table may be created using a graphical user interface (GUI) instead of running SQL statement, for which click on Create Table (Figure 28).
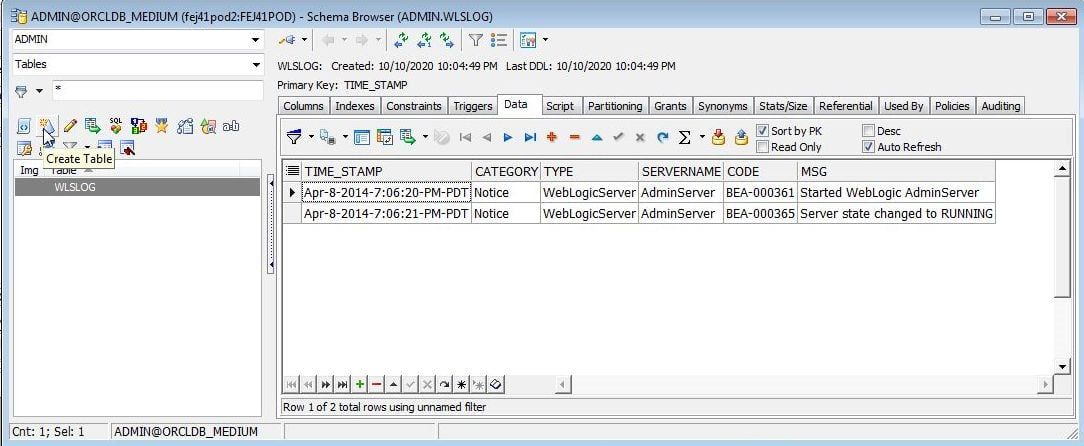
Figure 28. Schema Browser>Create Table
The Create Table wizard (Figure 29) gets launched.
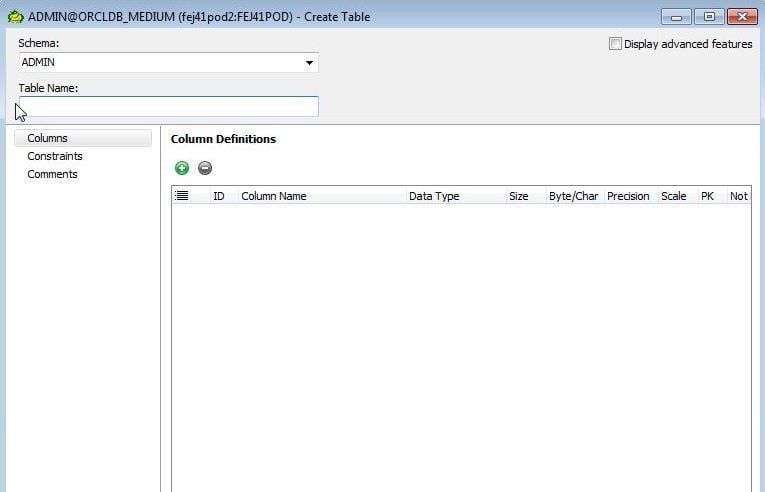
Figure 29. Create Table wizard
Adding data using SQL Editor
To add data using SQL Editor, copy and paste the SQL to add data to a SQL worksheet, and select one of the options to run SQL, such as Execute/compile statement at caret (Figure 30).
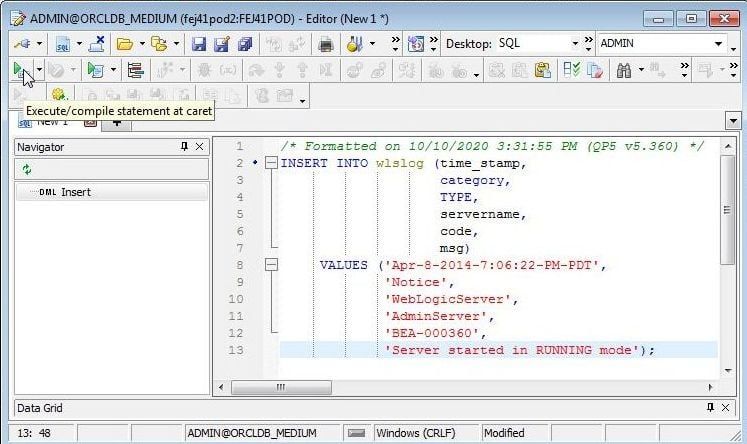
Figure 30. Execute/compile statement at caret
To display the new data added in the Schema Browser, auto refresh may be used or Refresh data (Figure 31) may be used.
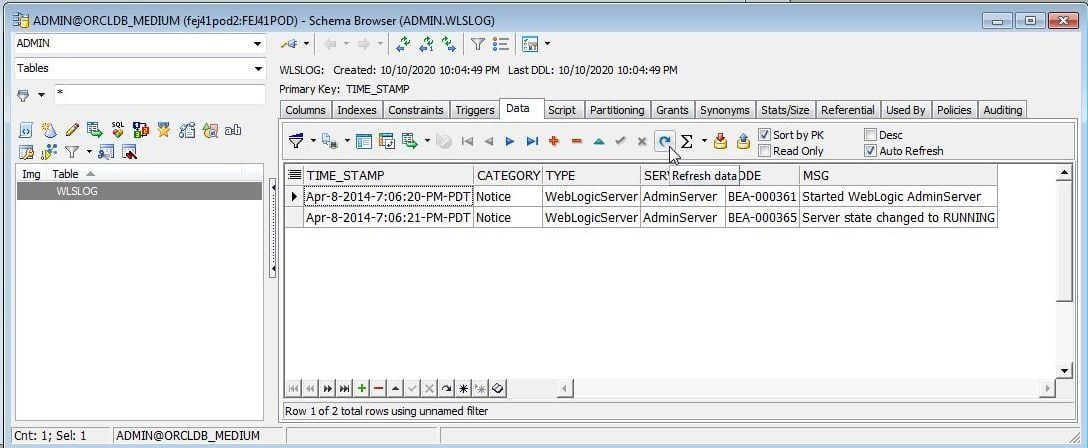
Figure 31. Refresh data
Data added with a SQL statement also gets added to the Data grid as shown in Figure 32.
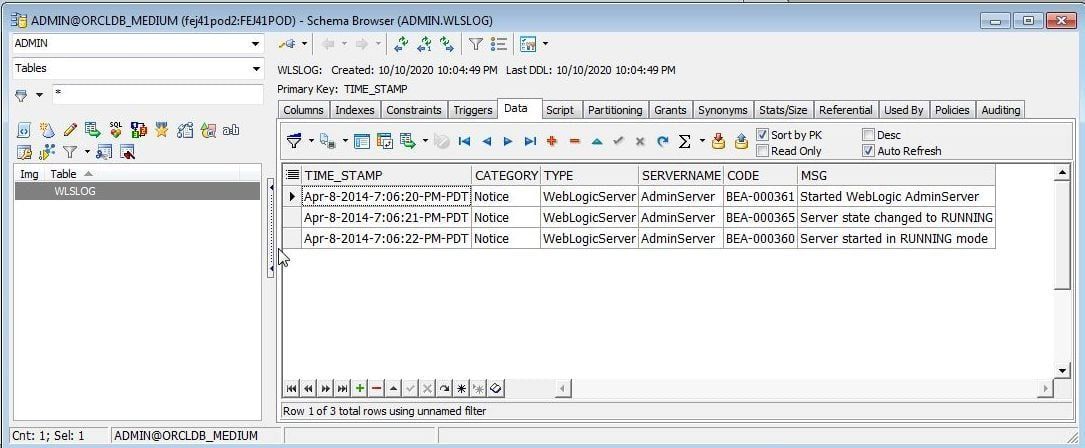
Figure 32. Refreshed data
Exporting Dataset
To export the dataset, right-click on the data grid and select Export Dataset (Figure 33).
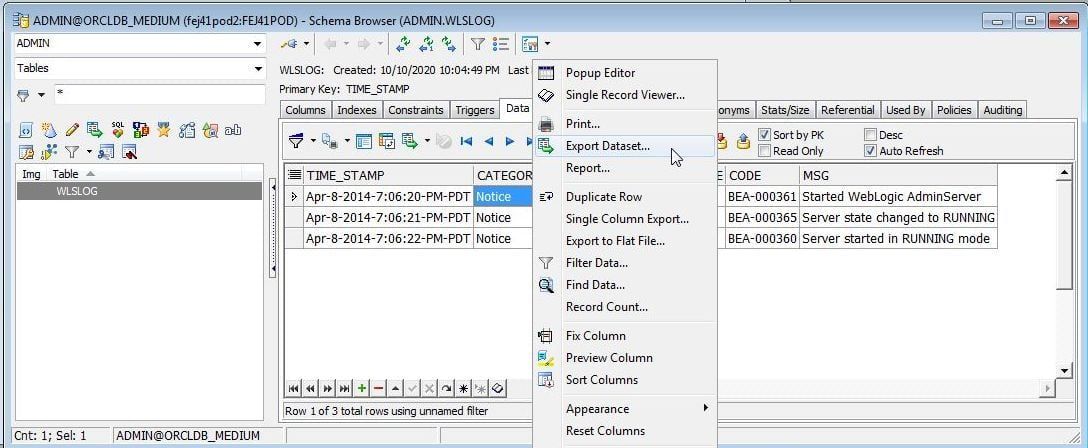
Figure 33. Export Dataset
In the Export Dataset dialog (Figure 34) the default format is Delimited Text, and one of the other formats may also be selected. Specify an output text file and click on OK.
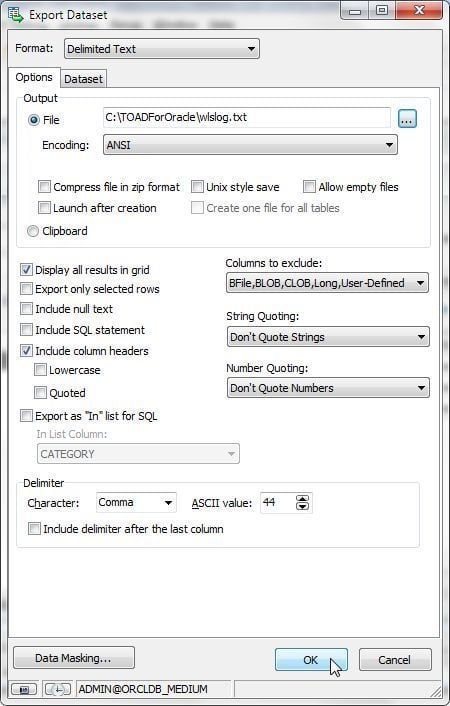
Figure 34. Export Dataset dialog
The exported data is listed:
TIME_STAMP,CATEGORY,TYPE,SERVERNAME,CODE,MSG
Apr-8-2014-7:06:20-PM-PDT,Notice,WebLogicServer,AdminServer,BEA-000361,Started WebLogic AdminServer
Apr-8-2014-7:06:21-PM-PDT,Notice,WebLogicServer,AdminServer,BEA-000365,Server state changed to RUNNING
Apr-8-2014-7:06:22-PM-PDT,Notice,WebLogicServer,AdminServer,BEA-000360,Server started in RUNNING mode
Using the Query Builder
The Query Builder is used to build and run a SQL query. To start the Query Builder wizard click on Query Builder (Figure 35) in the toolbar.
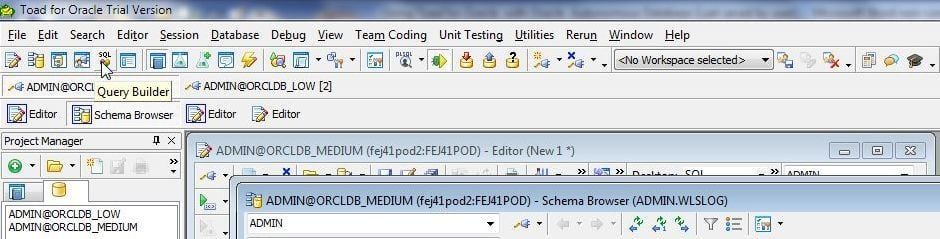
Figure 35. Query Builder
The Query Builder gets launched. Query Builder has several features to build different types of queries including Union Query (Figure 36) and Intersect Query.
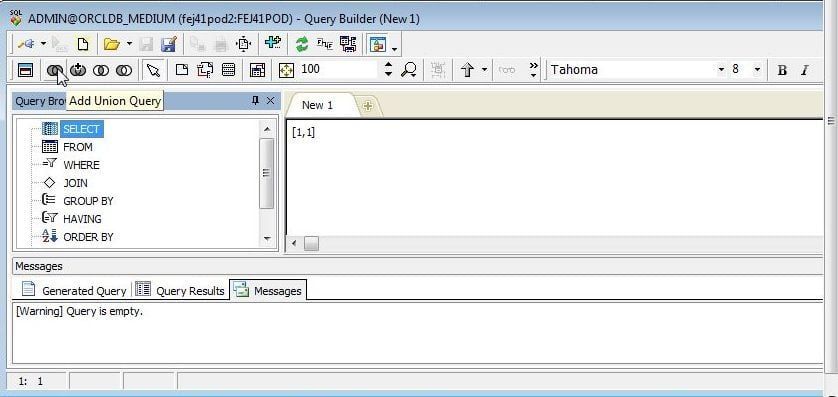
Figure 36. Query Builder
First, add database objects from which a query is to be built with Add Objects (Figure 37).
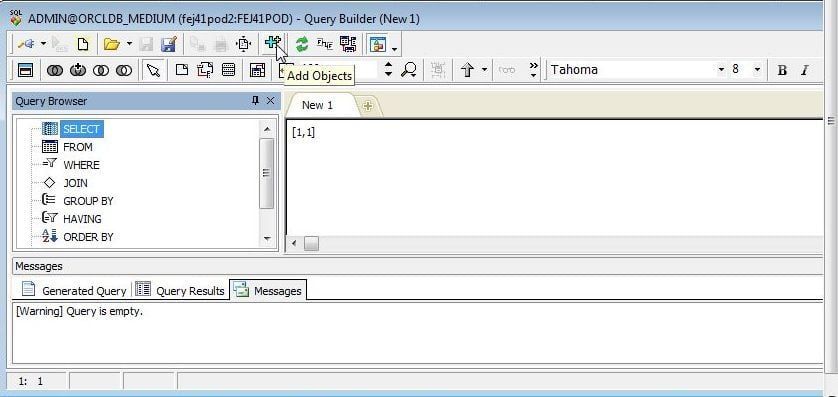
Figure 37. Add Objects
In the Add to Query Builder Diagram wizard select the WLSLOG table(Figure 38), and click on OK.
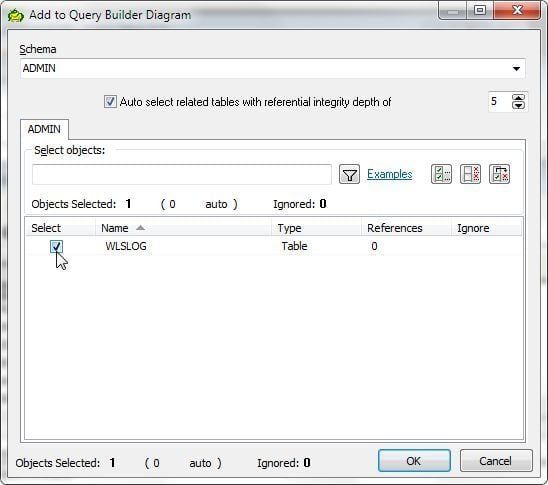
Figure 38. Add to Query Builder Diagram
The table diagram gets added to the Query Builder. Initially the layout may not be well made. Click on Autolayout (Figure 39) to refresh the layout.
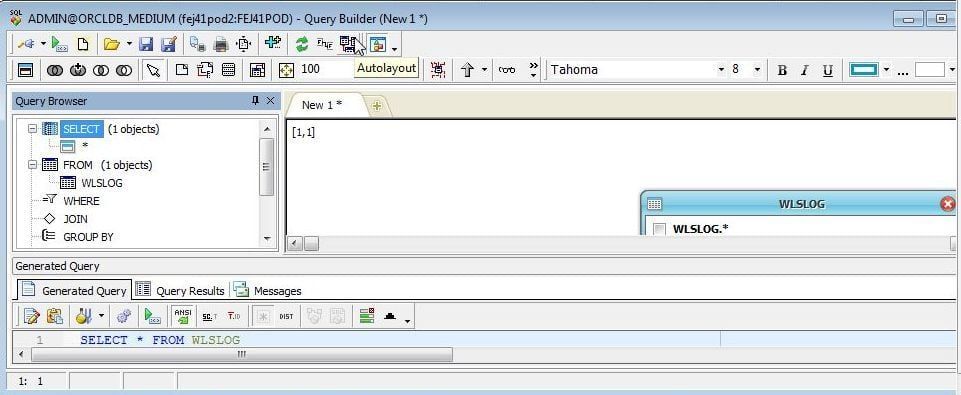
Figure 39. Autolayout
The table diagram (Figure 40) displays all the columns with no column selected initially.
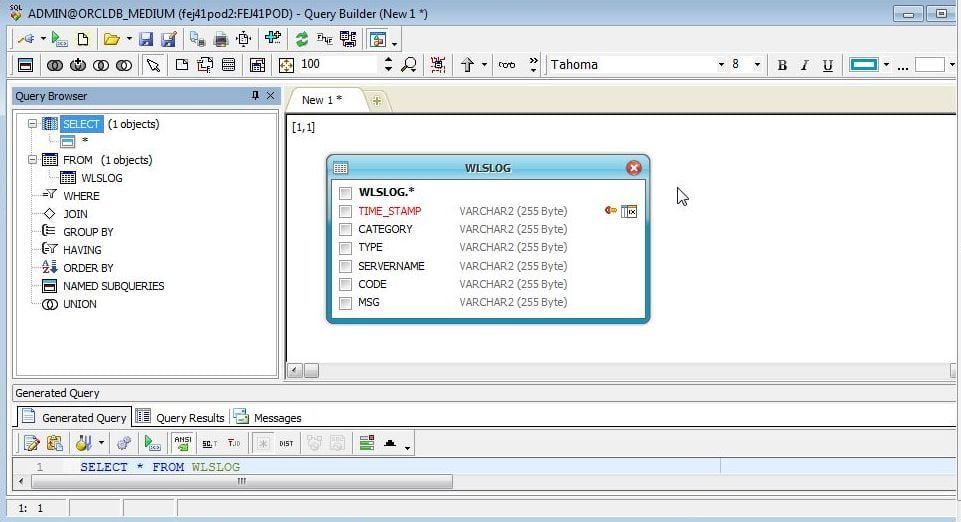
Figure 40. Table Diagram
Select the checkboxes for the columns to include and the corresponding SQL statement gets listed in Generated Query tab (Figure 41).
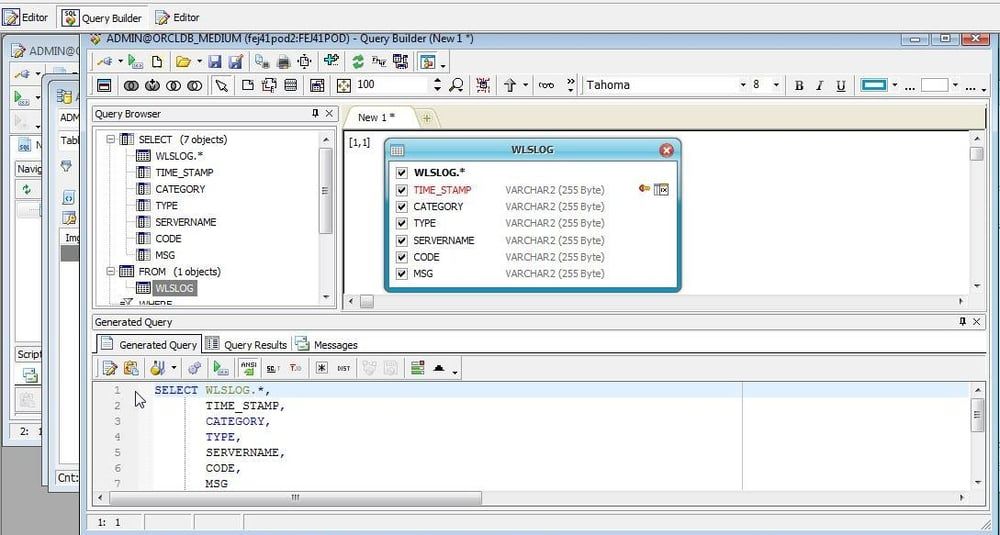
Figure 41. Generated Query
Click on Execute Query(Figure 42) to run the query.
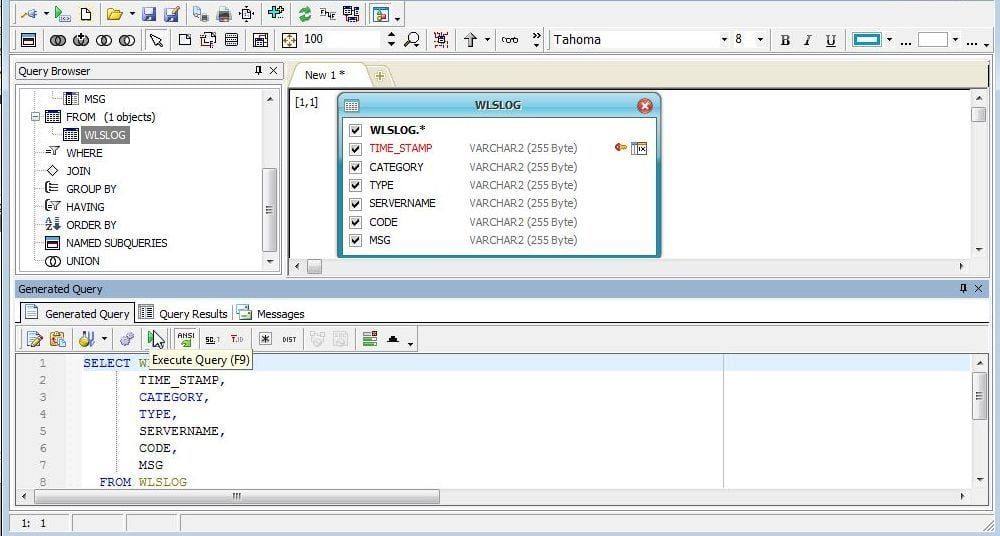
Figure 42. Execute Query
The query result gets displayed in the Query Result tab (Figure 43).
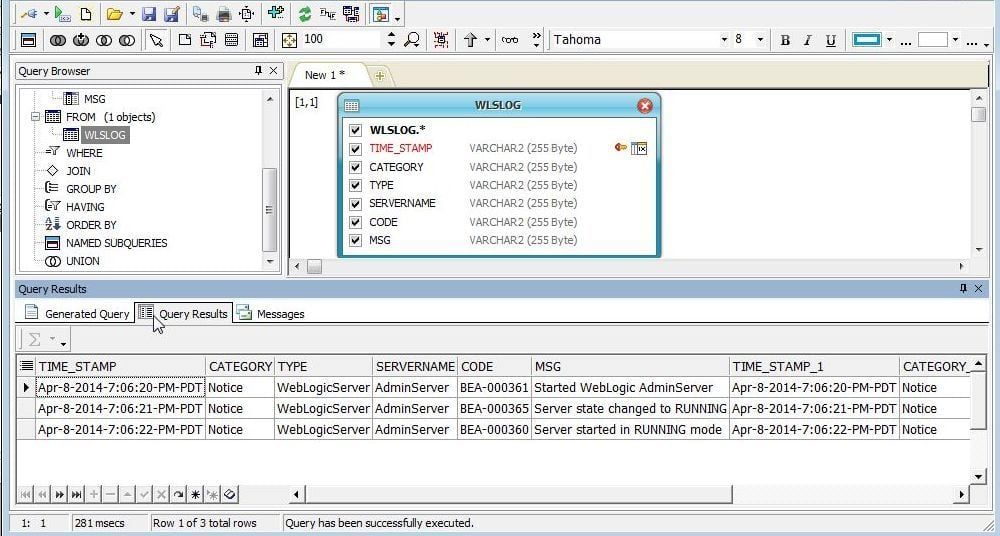
Figure 43. Query Result
The Query Builder provides several features that may be accessed with a right-click on the query result. As an example, to display a single row of data in a window select Single Record Viewer (Figure 44).
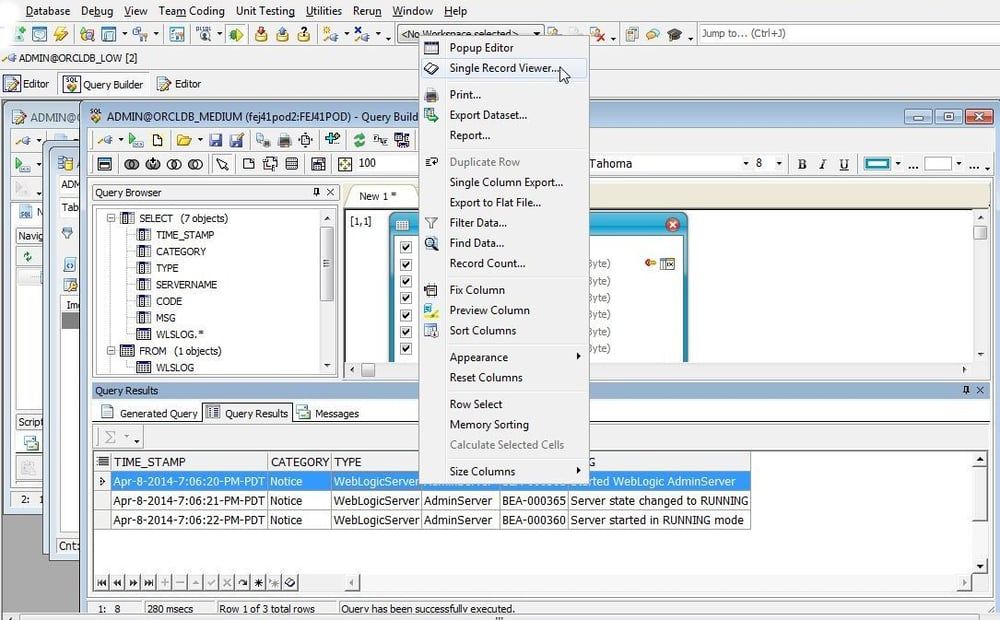
Figure 44. Single Record Viewer
A Record View window (Figure 45) for the single record gets displayed.
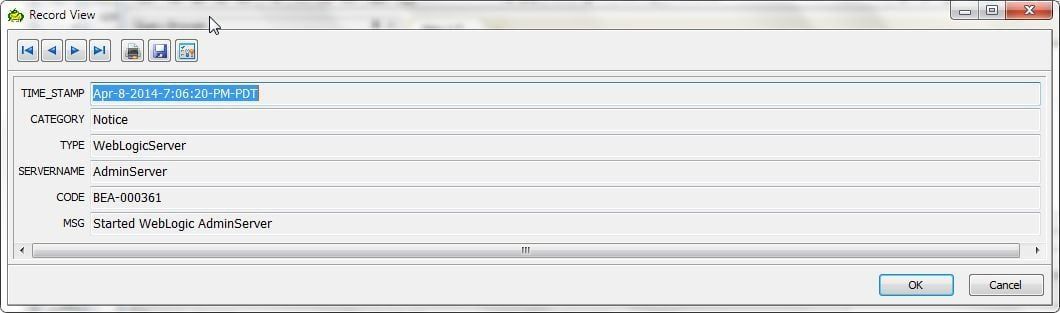
Figure 45. Record View
Generating an Excel spreadsheet from result set
To generate an Excel spreadsheet, select the result set rows to include, right-click and select Export Dataset (Figure 46).
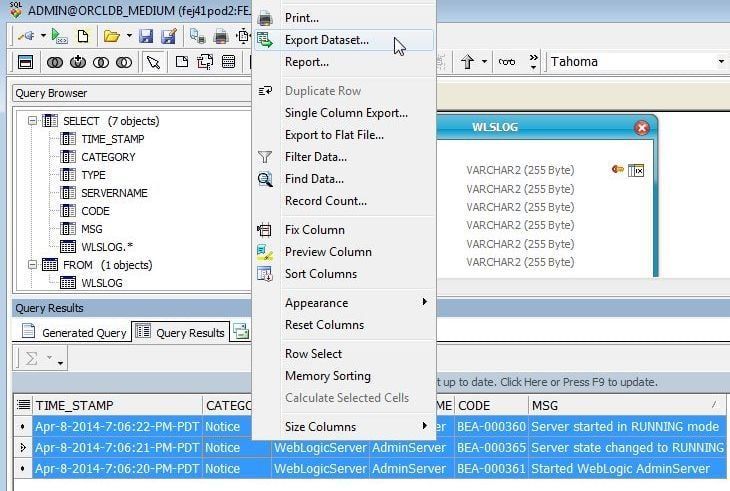
Figure 46. Export Dataset
Select Format as Excel File (Figure 47) in the Export Dataset dialog.
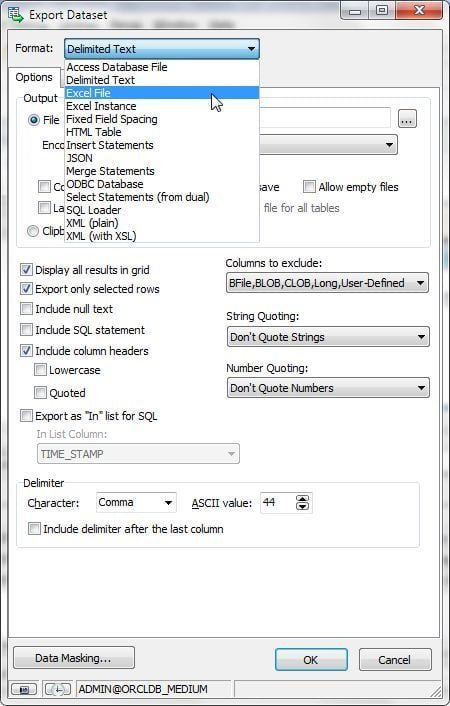
Figure 47. Selecting format as Excel File
Select an output file name in Output>File(Figure 48) and click on OK.
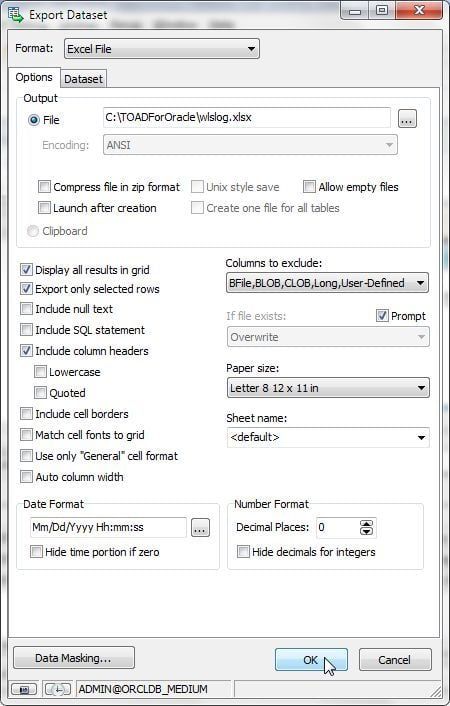
Figure 48. Export Dataset>OK
An Excel spreadsheet (Figure 49) gets generated from the result set.
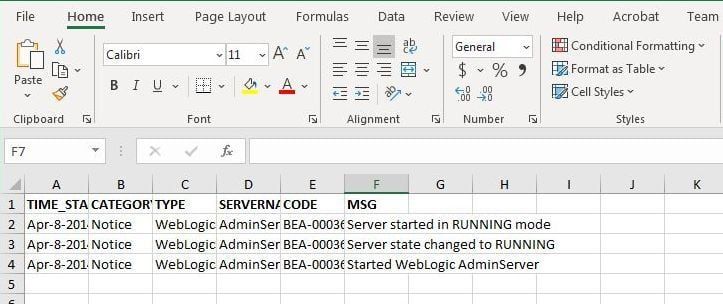
Figure 49. Excel Spreadsheet
Creating a report
To generate a report select the result set rows to include, right-click, and select Report (Figure 50).
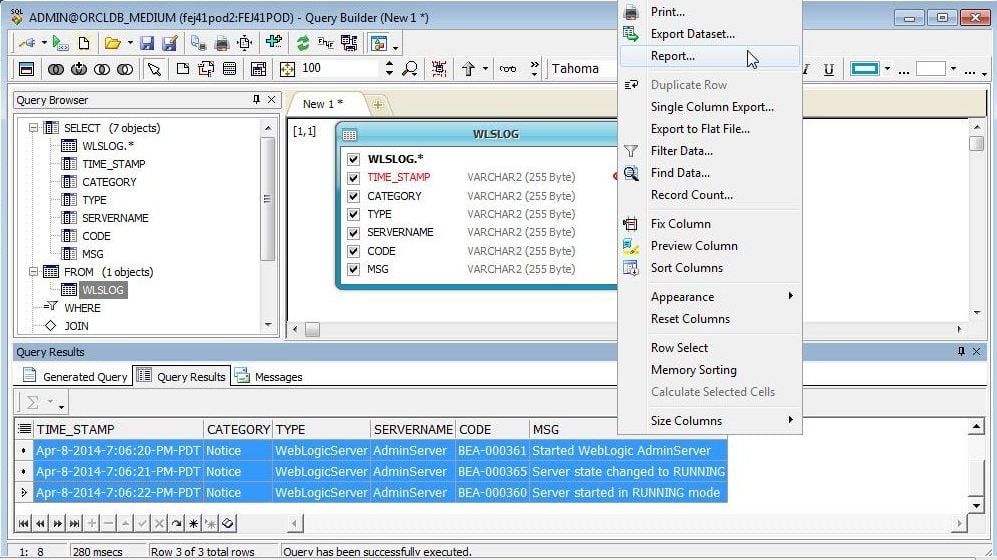
Figure 50. Result Set>Report
In the Report Wizard (Figure 51) select the fields to include. Similarly, select groups, and choose the layout and style options.
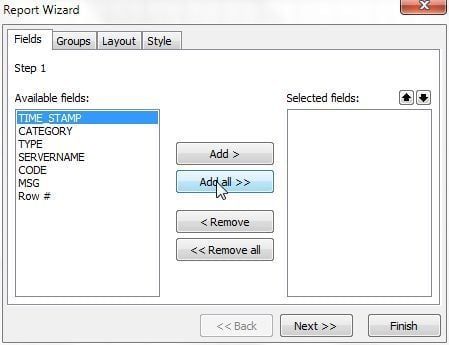
Figure 51. Report Wizard
Add a header and modify other settings as needed. Click on Preview (Figure 52) to preview the report.

Figure 52. Preview
The report Preview (Figure 53) gets displayed.
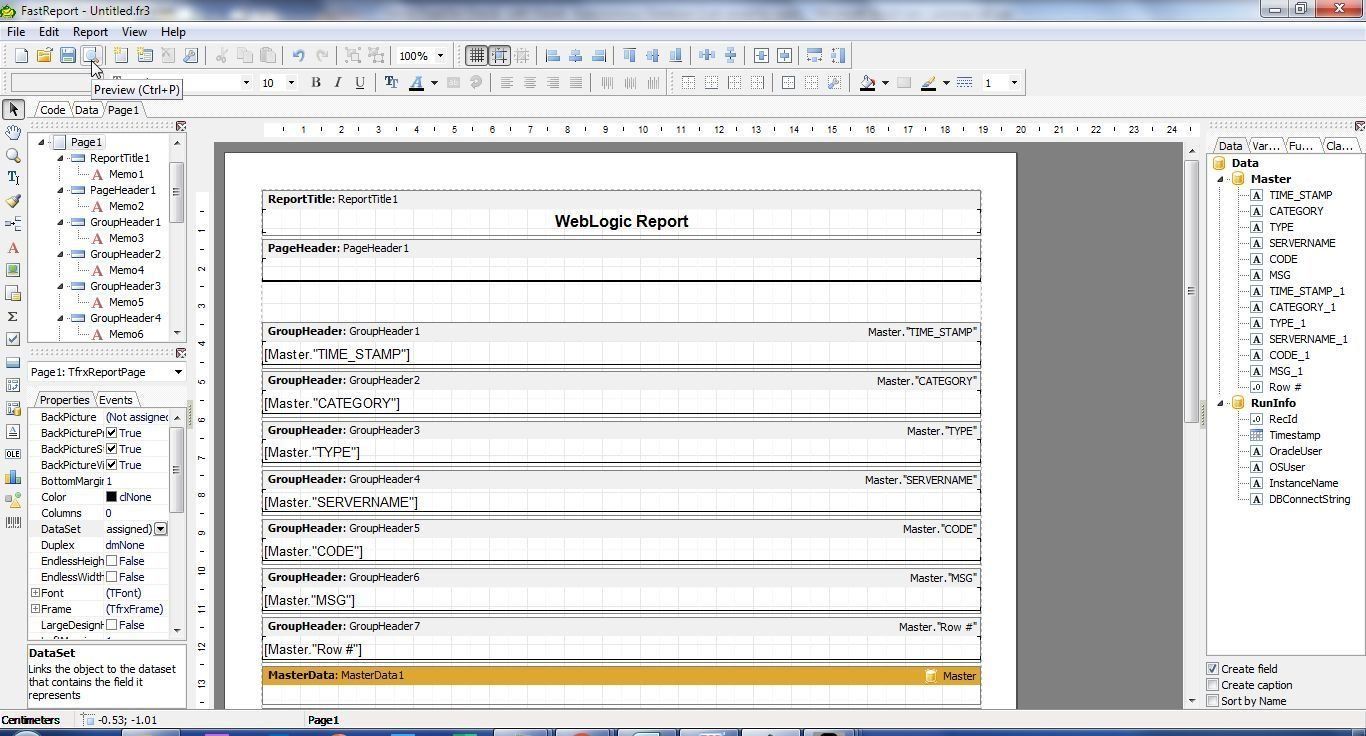
Figure 53. Report Preview
Ending a connection
To end or close a connection, right-click on the connection and select End Connection (Figure 54).
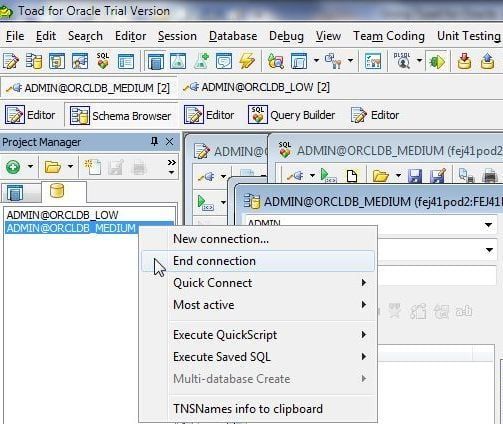
Figure 54. End Connection
If any pending transactions exist an option is provided to commit/rollback transactions in a Commit/Rollback dialog(Figure 55).
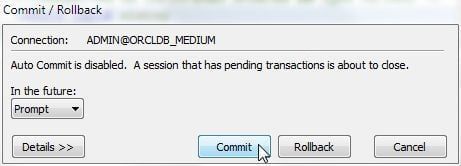
Figure 55. Commit/Rollback pending transactions
Stopping Oracle Autonomous Database
To stop and terminate the Oracle Autonomous Database instance, select View Details (Figure 56) in the database console.
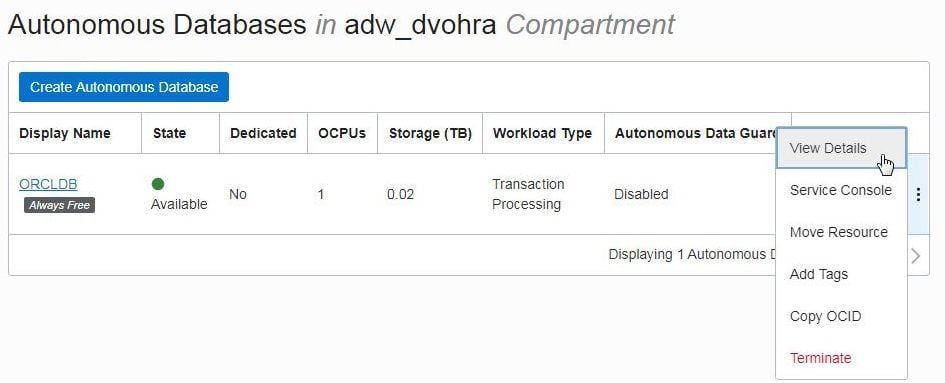
Figure 56. View Details
Select Stop (Figure 57) in More Actions. A stopped or running database instance may be terminated by selecting Terminate in More Actions.
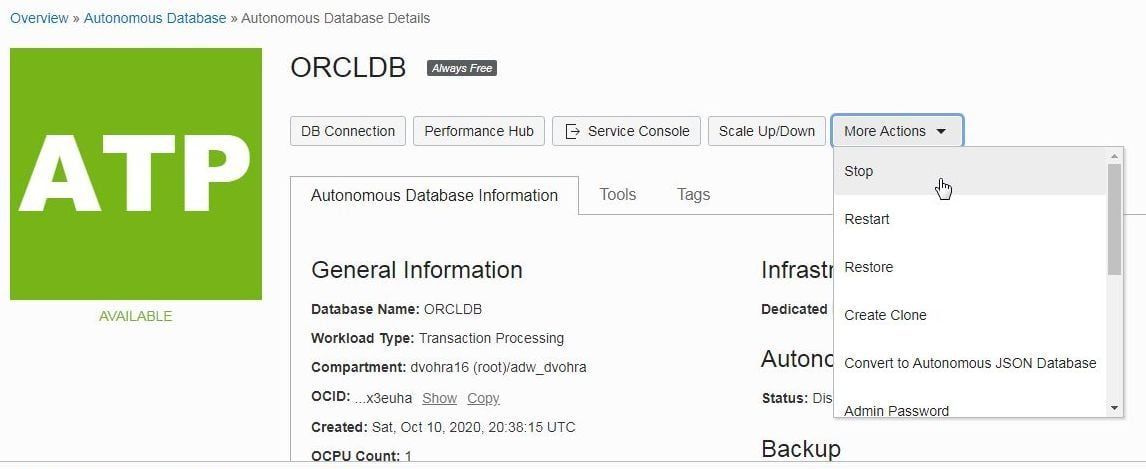
Figure 57. More Actions>Stop
Summary
In two articles we explored how Toad for Oracle is well suited as a client tool and integrated development environment (IDE) for Oracle Autonomous Database. I demonstrated the complete procedure using the Trial version of Toad for Oracle 13, and a later version could be used as well.
Need help managing data? Try Toad for free!Quest Software® is here to help you simplify complexity, reduce cost and risk, and drive performance. Maybe that’s why we’re consistently voted #1 by DBTA readers and have 95%+ customer satisfaction rate.
Toad® database management tools are cross-platform solutions from Quest® that can help new and veteran DBAs, and even “accidental” DBAs manage data in Oracle, SQL Server, DB2, SAP, MySQL, and Postgres environments. |

Related Toad World posts
Blog: How to use Toad® for Oracle with Oracle Autonomous Database – I
Blog: The Oracle Autonomous Data Warehouse Cloud Service (ADWC)
Blog: How to Install Oracle Database 18c on Windows
Blog: How to install an Oracle Instant Client for Toad® for Oracle
Useful resources
Toad for Oracle general information
Technical brief: Top Five Reasons to Choose Toad Over SQL Developer
Case study: Opening doors and creating opportunities with data insights
Have questions, comments?
Head over to the Toad for Oracle forum on Toad World®! Chat with Toad developers, and lots of experienced users.
Help your colleagues
If you think your colleagues would benefit from this blog, share it now on social media with the buttons located at the top of this blog post. Thanks!
Start the discussion at forums.toadworld.com