If you’re responsible for Db2 performance tuning, read part 2 in this blog series. This second blog takes a deep dive into the Db2 Process Model and shows you a time-saving shortcut.

DBAs, are you responsible for Db2 LUW database performance? Is Db2 LUW relatively new to you? If you answer yes to either of these questions, my May 2020 post also might be helpful, “Performance tuning IBM Db2 to quickly solve slowdown causes.”
That previous post discussed the DB2 process model, and how it can be a roadmap to areas of DB2 that might be experiencing bottlenecks. It also suggested adding Quest® Spotlight® on DB2 to help pinpoint those bottlenecks visually, saving time in determining root cause of issues.
I would like to take a magnifying glass to the Db2 Process Modelin this post, and discuss in more detail how you can use IBM’s documented approach to tweaking the DB2 environment to either free up computing power, or use it more efficiently, by shifting resources to other (or more) areas of DB2.
Decisions on the steps you take once you know about a performance bottleneck are critical – they can make everything run better, or they can torpedo even more of your application workloads. So, make changes carefully—by informing yourself first.
The Db2 Process Model as a database performance tuning template
In my post last month, I observed that in tuning DB2 instances and databases, there two key conflicting pressures that are always true:
- Computing resources available to your Db2 instance and database are limited.
- The workloads that are critical to your business need to meet performance expectations.
A resolution to one problem can create problems somewhere else in Db2, because limited computing resources are available for the database workloads. A resource, like server memory, can be used very efficiently by Db2 workloads— but if not allocated properly it can quickly become the reason for a roadblock.
Db2 performance tuning: Discovering where and why
How can the Db2 Process Model help you tune your database? By becoming a template for tuning, a map—a set of guideposts, if you will. Allow me to explain that, and provide you a way to visualize that model in a way that will allow you to pinpoint where a performance bottleneck is occurring in the model—in your Db2 LUW database, so you can figure out why it’s happening.
The Db2 LUW Process Model—let’s use it to solve a problem
Earlier I listed a link to the IBM Db2 Process Model where you can read in great detail about the Db2 Process Model, detail that I think can transform your performance diagnostics and tuning efforts. But let’s take a brief look at some of the main characteristics—the guideposts that can help lead you to performance roadblocks and then lead you to fixes, too.
Here is a diagram of the model we are discussing:
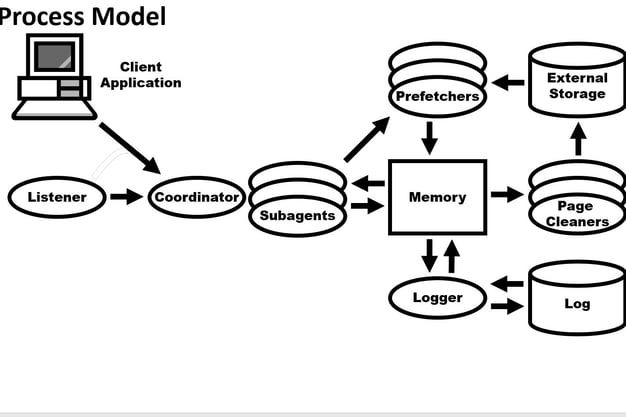
The Db2 LUW Process Model
Note that there are areas of the model like memory, agents, and logging.
If we drill in a bit deeper into the model, we begin to see some specific ways it can help us understand not only that problems can arise, but what might be done to fix the problem.
So, however you retrieve the important performance metrics about Db2, from Db2, you can apply them to the Db2 Process Model. How? The IBM Knowledge Center provides guidance on maximum settings for configuration parameters at the database manager and database levels, and suggests monitoring elements to gather from Db2 to help you adjust those parameters optimally. So, a lot of guidance is out there on how to apply the monitoring data to the Db2 Process Model to fix a problem/bottleneck. There is detective work required, but at least you have that roadmap to clues and ultimately some things you can actually try.
Let’s try it…
Step 1: Detect the performance bottleneck quickly using Spotlight
Remember that Spotlight:
- Automates the collection of Db2 performance metrics, and visualizes where in the Db2 Process Model a bottleneck is taking place.
- Gives you a guided tour through the dense forest of metrics that Db2 supplies so you can find what you need and hopefully fix the problem
Right now, I see a problem with Db2 performance identified in my Spotlight interface. Bufferpool hit rate is low – lower than a threshold I’ve set for this database. 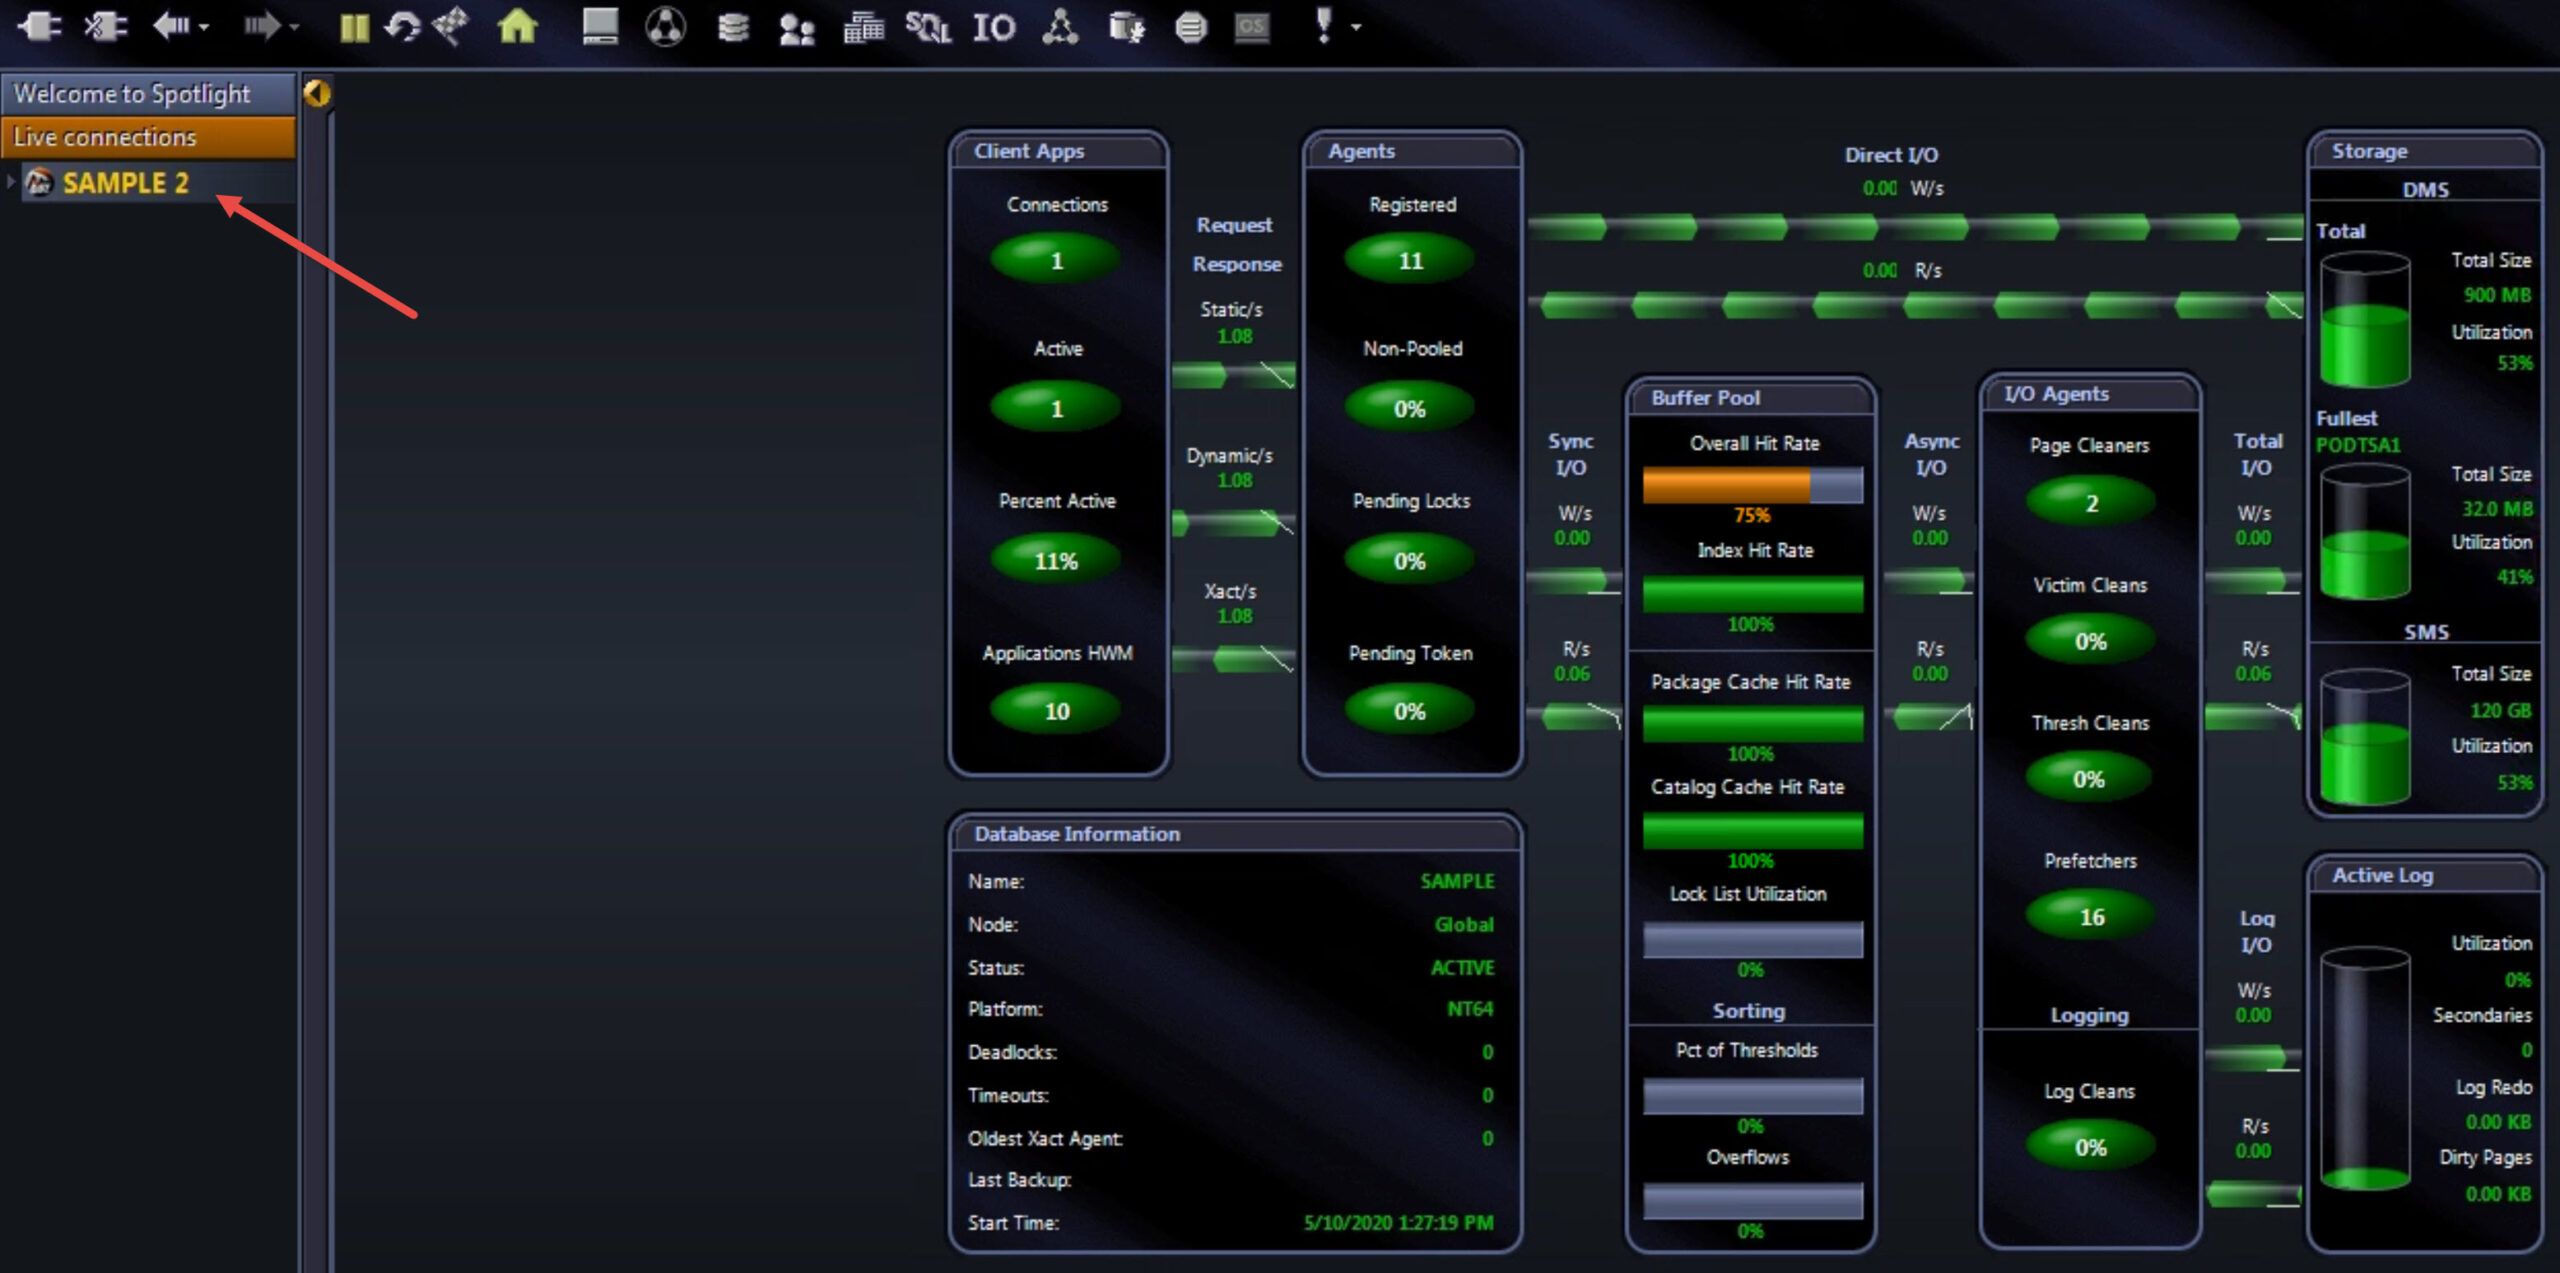
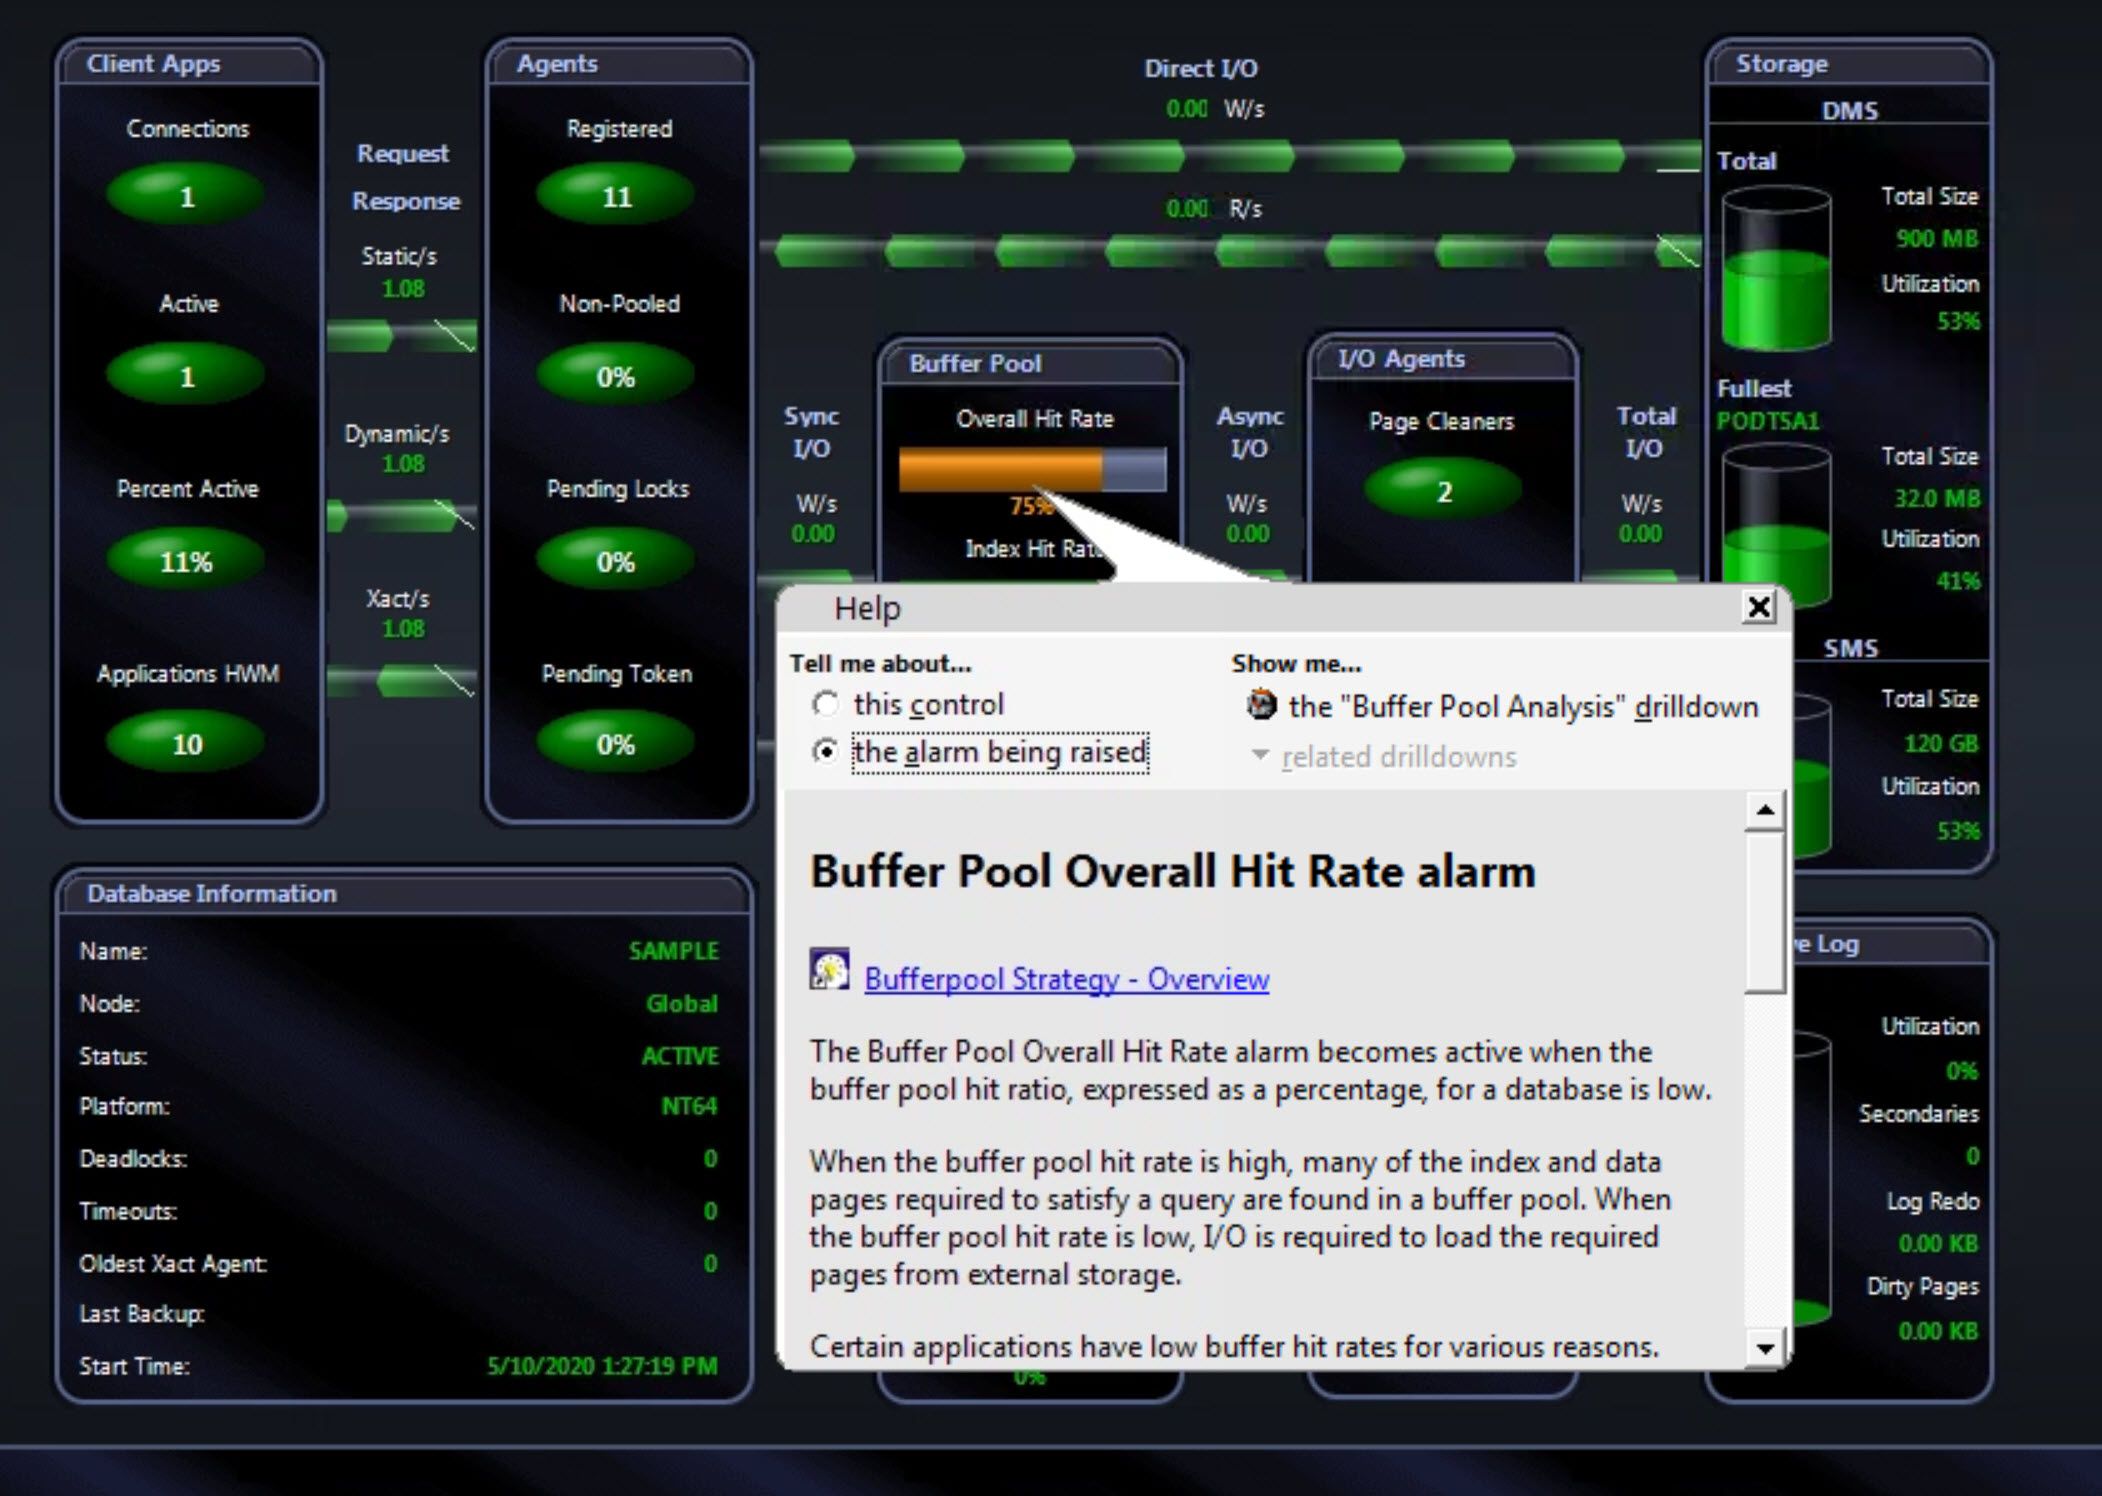
Click on the Orange Overall Hit Rate bar to begin the directed diagnostic workflow; you will see pertinent information about the meaning of the alarm, some helpful guidance for possible fixes, and a hyperlink to the “Buffer Pool Analysis” drilldown.

Step 2: Investigate, gathering information/clues you need for that part of the DB2 Process Model
Those calls in the middle of the night to fix something? Speed to resolution is going to be nearly priceless. Just click on that link and you will next see the Analysis drilldown to investigate individual bufferpools on this database that’s in context.
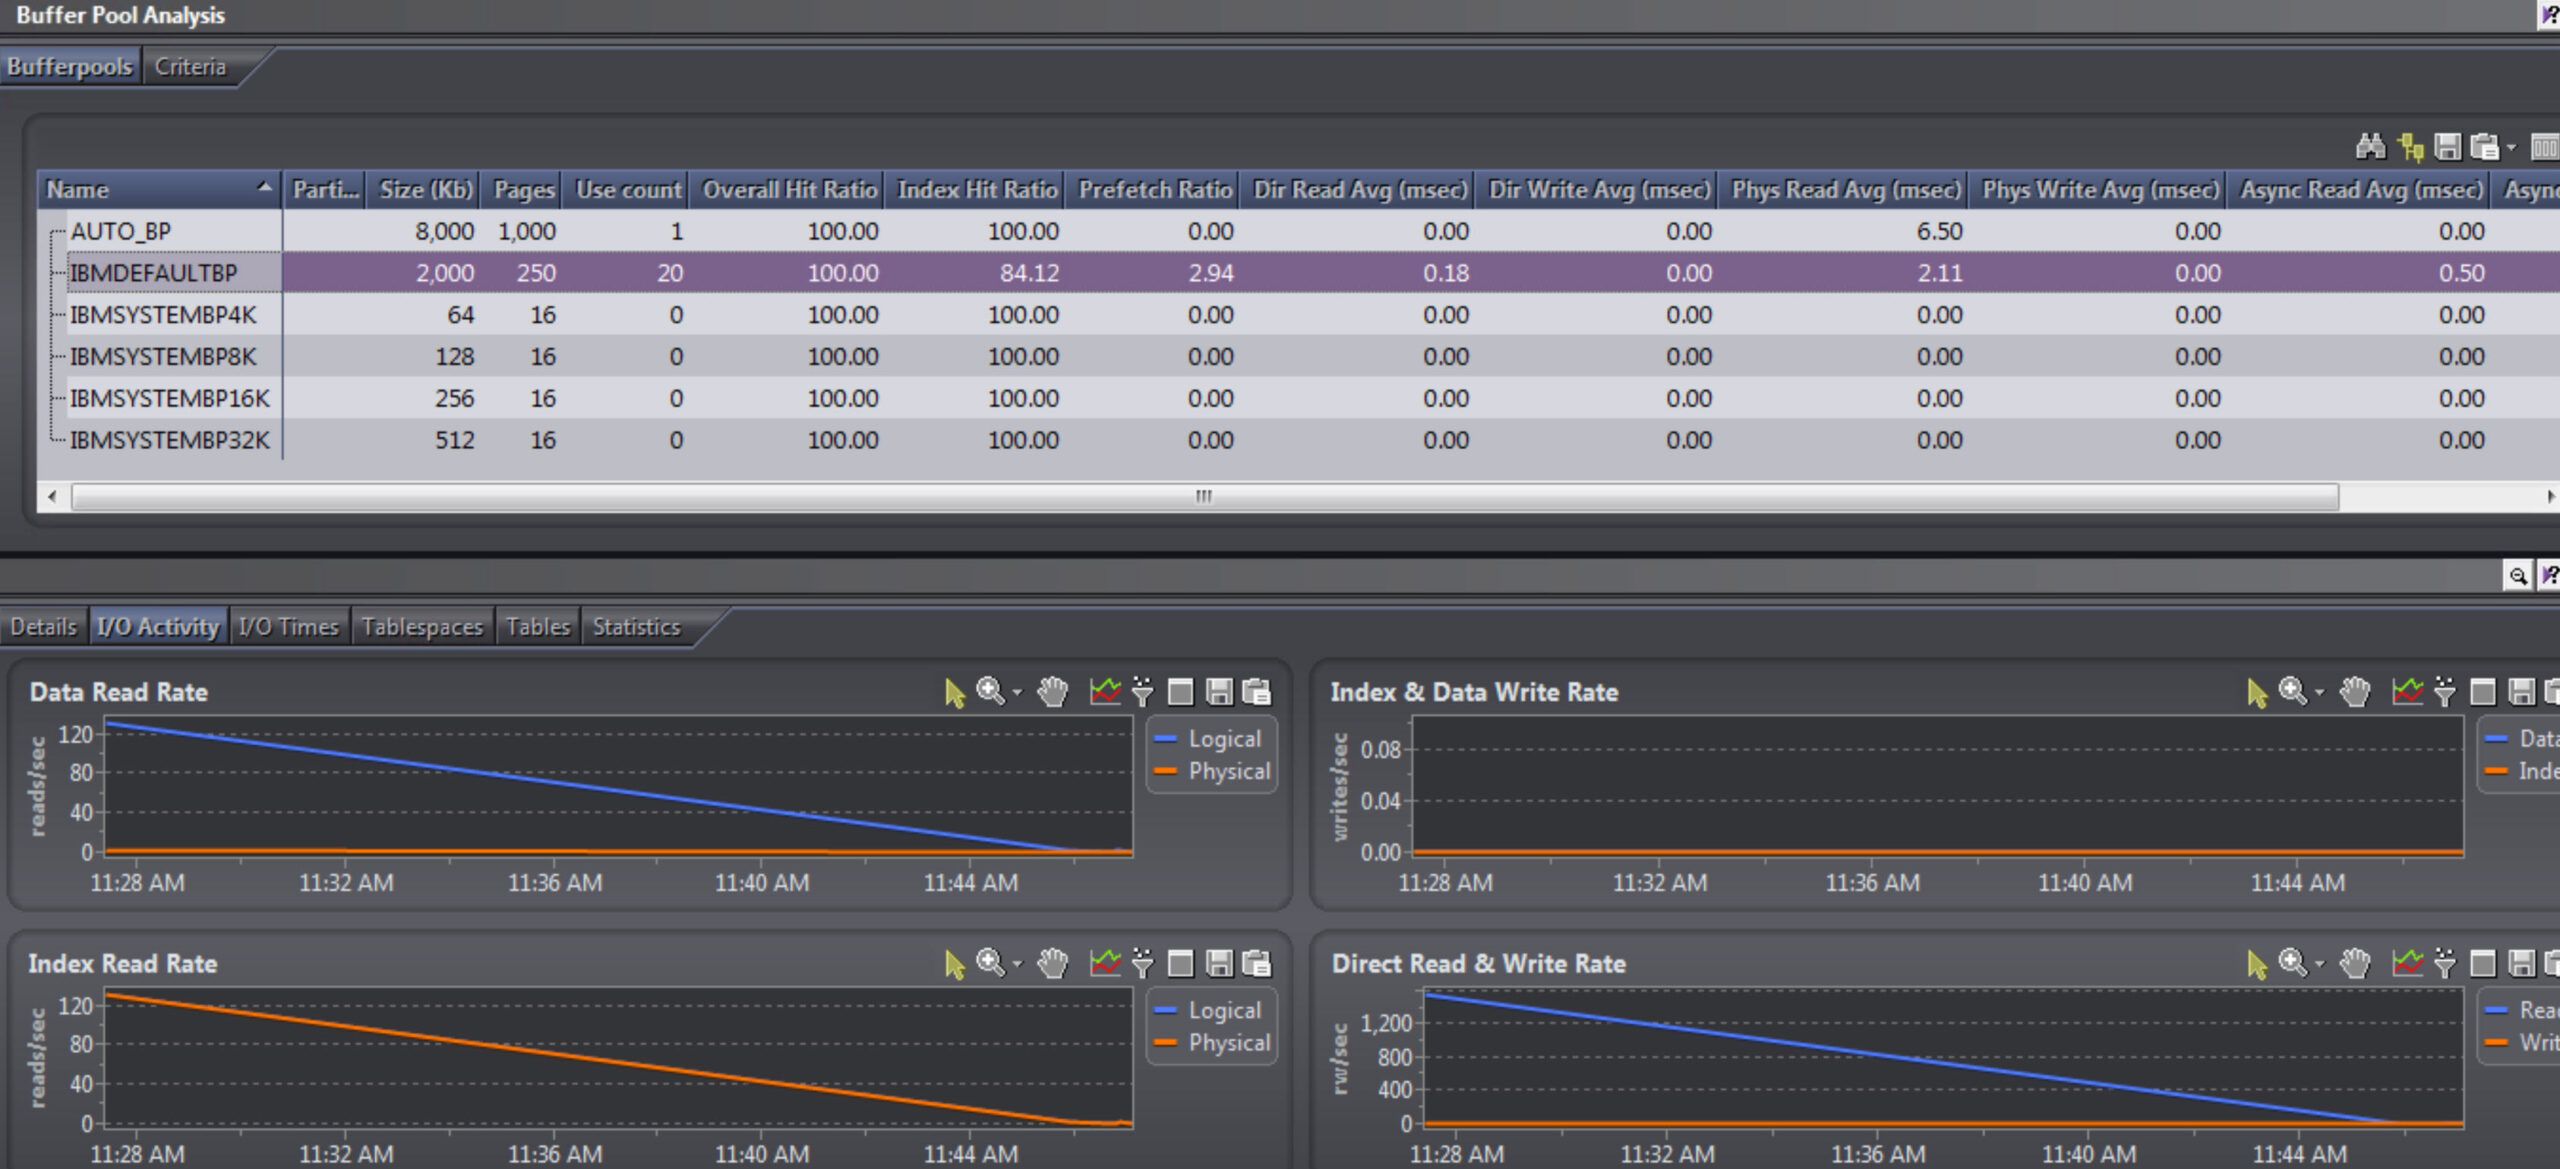
The directed diagnostic workflow sent us to this screen (pictured above) in Spotlight. The investigation we can perform is made possible by the Spotlight fast-collections of critical performance metrics. This automatic collection can save hours of work, and the more unfamiliar you are with Db2, the more hours this can save you.
We can now see that one bufferpool (out of all of them) on this database has a lower-than-desired hit ratio. IBMDEFAULTBP, in this case, has a hit ratio of 84.12%.
Importantly, in a few mouse clicks, we see many of the same metrics you would have received had you queried Db2 monitoring table functions. But the collection by Spotlight was all automatic, and the metrics were available as you followed the directed troubleshooting workflow: Home Page (alarm)—Buffer Pool Analysis—specific buffer pool.
Step 3: Apply what you have found to the IBM Process Model and recommendations for alleviating the issue.
So, why is a lower-than-desired bufferpool hit ratio a potential cause of a DB2 performance problem? Here’s a summary of considerations for bufferpool tuning, in a format you might consider using to organize those IBM recommendations into a tabular reference document for your DBAs to follow in future cases of performance bottlenecks at the bufferpool area of the Process Model:
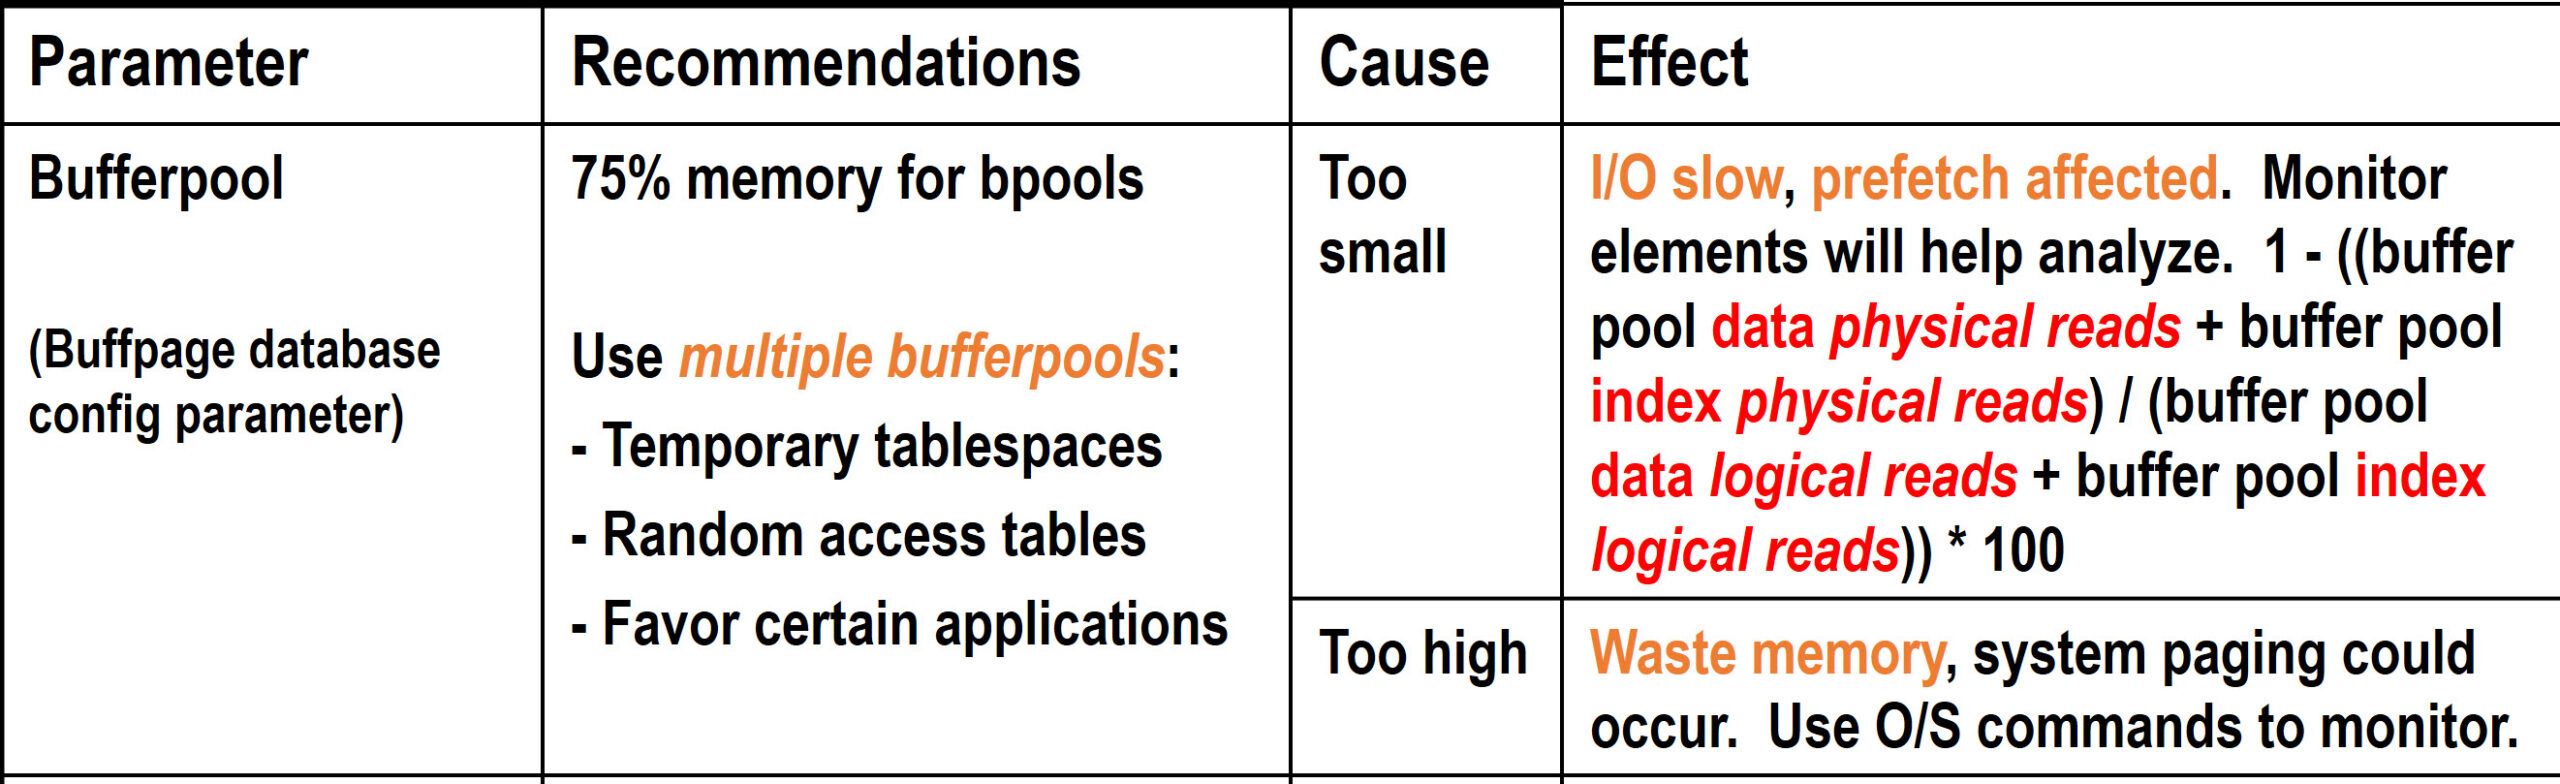
Note that the bufferpool hit ratio (calculated using metrics collected from Db2— in red type in the diagram above) on a given bufferpool was low. The metrics is red were collected and then used for the calculation automatically, three times a minute (configurable). We could use Spotlight’s graphs or other means to determine whether the trend had clearly showed a low hit ratio. So hit ratio was the symptom we easily spotted. But to fix it, care must be taken.
Following the advice in the chart, advice from IBM, if you raise the memory for bufferpools you might be wasting memory that could be used for other things in Db2 or on the server outside of Db2, and other processes on the server (perhaps in Db2) will suffer. If you reduce bufferpool size, allocating more memory to the OS or something else in Db2, prefetching can be affected, slowing I/O down; if I/O slows too much, application response times will suffer.
It’s a balancing act, the results of which can be watched in a performance diagnostics monitor such as Spotlight.
Further detail from IBM’s recommendations on bufferpool tuning that help clarify the goals for tuning this area of the Process Model to guide you to tuning success:
- The goal with bufferpools is to minimize physical and synchronous I/O (database agents having to pull pages from the disk). However, if you have large tables that are frequently accessed randomly, there may be no relief. Concentrate on the tables that are smaller in size and sequentially accessed.
- Larger bufferpool sizes can:
- Allow higher transaction rates with the same response time.
- Prevent I/O contention on disk devices containing frequently referenced tables and indexes. Sorts that use temporary tablespaces will also encounter less contention.
- Allow more frequently requested pages to be kept in memory so those pages will not have to be read from disk. I/O operations and I/O contention are reduced.
Summary
We saw an alarm firing (on low bufferpool hit rate) automatically identified in Spotlight, and used the directed troubleshooting workflows to find pertinent performance metrics and visualizations specific to that area of DB2 (bufferpools/memory). This step alone saved us quite a bit of research time.
Then we put IBM’s recommendations into a format and used them as considerations in deciding what to do—to fix the problem— to try making this problem go away for good.
Last, because Spotlight on IBM Db2 LUW displays real-time activity of all the database components in a single interface, we were able to monitor the results real-time and resolve any performance problems before they impact our end users.
As mentioned earlier, to decide which actions to take in DB2 performance tuning (e.g., turning dials, resetting configuration parameters) based on the Db2 Process Model, follow the IBM documentation in the IBM Knowledge Center.
Learn more about Toad for Db2 LUW DBA Edition
Toad for Db2 LUW DBA Edition is an integrated solution for Db2 LUW database administration. Spotlight on Db2 is just one of a few tools that comprise this solution.
Learn more about Toad for IBM Db2 so you can spend less time managing Db2 and more time innovating.
Try Toad for IBM Db2 for freeAre you in a trial now or just learning about Toad for IBM Db2? Find out which edition is right for you with our Toad for IBM Db2 functional matrix.
Like what you’ve learned so far about Toad for IBM Db2, why not try it for free for 30 days? |
Questions?
Start a discussion about this blog in the Toad World® forum, Toad for IBM Db2.
Help your colleagues
If you think your colleagues would benefit from this blog, share it now on social media with the buttons located at the top of this blog post. Thanks!
Start the discussion at forums.toadworld.com