DBAs, are you responsible for Db2 LUW database performance? Is Db2 LUW relatively new to you? If you answer yes to either of these questions, I think this post will help.
What is the Db2 Process Model, and how is it as a database performance tuning template?
Tuning a Db2 database or instance is not unlike tuning on other relational database platforms, with two key conflicting pressures that are always true:
- Computing resources available to your Db2 instance and database are limited.
- The workloads that are critical to your business need to meet performance expectations.
A resolution to one problem can create problems somewhere else in Db2, because limited computing resources are available for the database workloads. A resource, like server memory, can be used very efficiently by Db2 workloads— but if not allocated properly it can quickly become the reason for a roadblock.
For Db2 LUW database performance tuning, a tool exists that IBM makes available and costs you nothing: the IBM Db2 Process Model. It will help lead you to places that performance issues are originating, and IBM suggests ways to address those issue once they are identified. First, it’s important that you can answer the “where” and “why” questions of a performance issue.
Performance Issues: Where and why?
How can the Db2 Process Model help you tune your database? By becoming a template for tuning, a map—a set of guideposts, if you will. Allow me to explain that, and provide you a way to visualize that model in a way that will allow you to pinpoint where a performance bottleneck is occurring in the model—in your Db2 LUW database, so you can figure out why it’s happening.
The Db2 LUW Process Model—a primer for performance tuning
Earlier I listed a link to the IBM Db2 Process Model where you can read in great detail about the Db2 Process Model, detail that I think can transform your performance diagnostics and tuning efforts. But let’s take a brief look at some of the main characteristics—the guideposts that can help lead you to performance roadblocks and then lead you to fixes, too.
Here is a high level look at the model we are discussing:
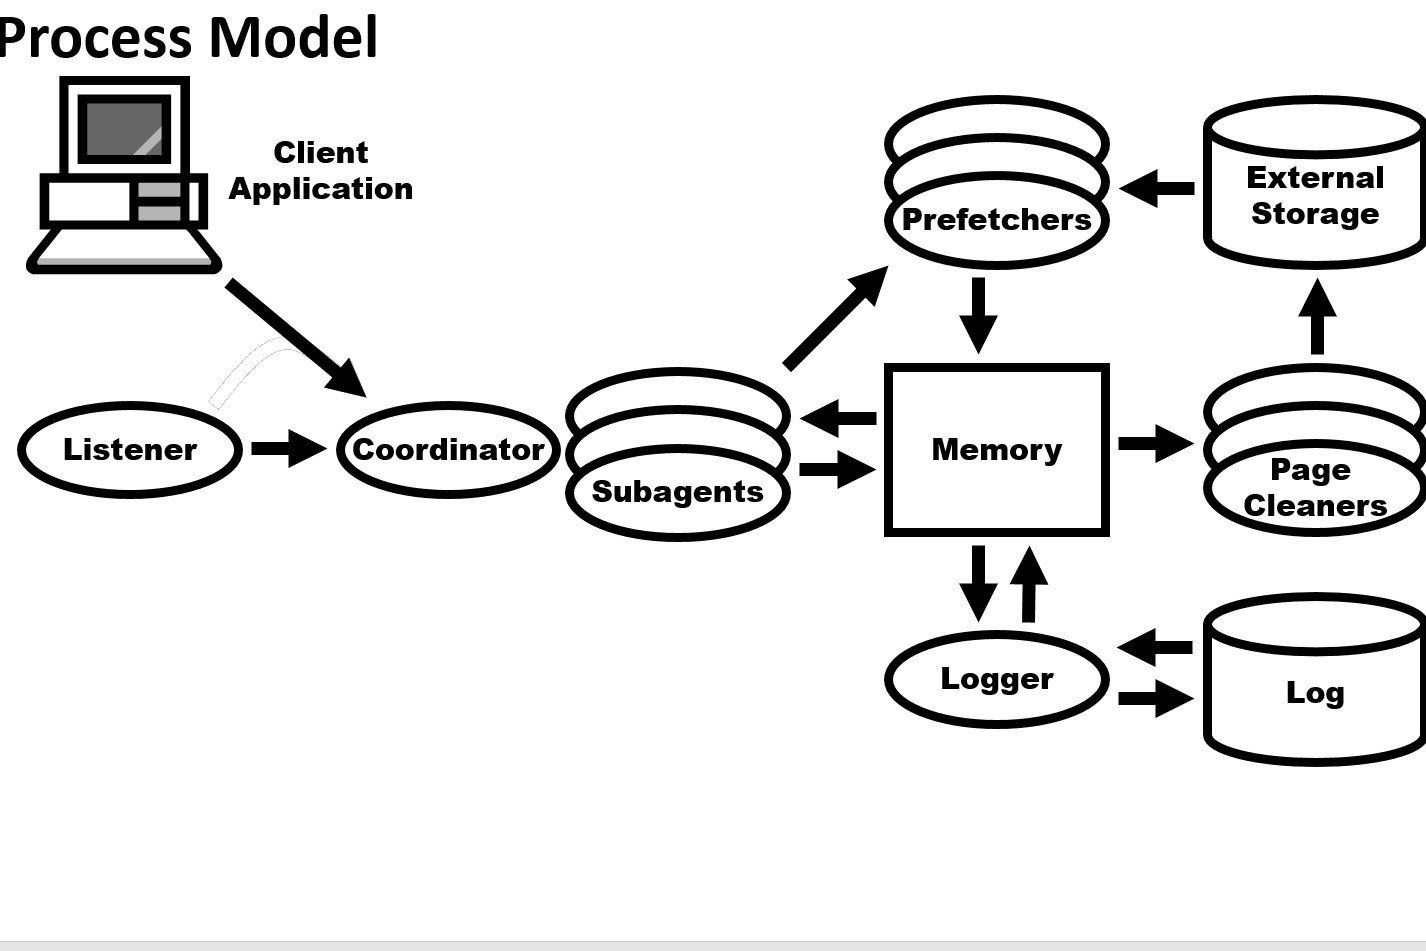
The Db2 LUW Process Model
Db2 process model
The Db2 process model consists of these three major sets of components that can help database performance tuning:
Agents: These portions of the model, Listener, Coordinator, and Subagents, all contribute to concurrency—controlling how many applications and/or users can connect to the database at once and can execute workload concurrently.
Memory: The importance of memory structures and page prefetching in Db2 cannot be overstated, and a large part of how you will use the Process Model will relate to memory: memory available to Db2, to each application and user, and to making I/O efficient. In the diagram above, you see these: Memory, Prefetchers, External Storage, Page Cleaners, and Logger.
Logging: As transactions execute on the Db2 database, transaction logs must keep up: if they fill up, transactions cannot complete. The Logger handles moving information in and out of memory and the appropriate configuration of this mechanism is the responsibility of the DBA.
If we drill in a bit deeper into the model, we begin to see some specific ways it can help us understand not only that problems can arise, but what might be done to fix, and avoid future occurrences of, the problem.
First, read the text below to understand what happens when an application runs on Db2 LUW:
Agents
Client applications make initial contact with communication listeners, for example:
- Db2ipccm, for local client connections
- Db2tcpcm, for TCP/IP connections
Client applications are then assigned to a coordinator agent.
Agents service database requests on behalf of client applications.
- Two agent types
- Coordinator (Db2agent)
- Subagent (Db2agntp)
- One coordinator per client application
- Coordinator agent distributes application request among multiple subagents
- Idle agents reside in an agent pool.
- Instance configuration parameters
- Maximum number of agents (maxagents)
- Maximum coordinating agents (max_coordagents)
- Agent pool size (num_poolagents)
- Initial number of agents in pool (num_initagents)
- Maximum number of concurrent agents (maxcagents)
- Related configuration parameters
- Maximum number of active applications (maxappls)
- Maximum number of active databases (numdb)
Memory
Prefetchers (Db2pfchr):
- Ensure that agents doing scans never wait for disk I/O. Agents send asynchronous read-ahead requests to a common prefetch queue.
- Prefetchers service the requests by bringing the requested pages into the buffer pool.
- Configuration parameters
- Number of prefetchers for a database (num_ioservers)
- Tablespace Options
- Number of pages that the database manager will prefetch for a table space (prefetchsize)
Areas of memory
Buffer Pool
- An area of storage into which database pages (containing table rows or index entries) are temporarily read and changed.
Package Cache (pckcachesz)
- Caching packages allows the database manager to reduce its internal overhead by eliminating the need to access the system catalogs when reloading a package; or, in the case of dynamic SQL, eliminating the need for compilation.
Catalog Cache (catalogcache_sz)
- This cache can help improve performance of binding SQL statements (including dynamic SQL), if the same tables, views, or aliases have been referenced in previous statements.
Sort Heap (sortheap)
- Each sort has a separate sort heap that is allocated as needed, by the database manager. This sort heap is the area where data is sorted.
Lock List (locklist)
There is one lock list per database and it contains the locks held by all applications concurrently connected to the database.
Page cleaners (Db2pclnr) ensure that agents trying to bring a page into the buffer pool never need to flush a dirty page to disk to free up a slot.
- Configuration parameters
- Number of page cleaners for a database (num_iocleaners)
- Level (percentage) of changed pages at which the page cleaners will be started, if they are not currently active (chngpgs_thresh)
Logging
The logger (Db2loggr) manages the database log files to handle transaction processing and recovery.
Performance tuning using the Db2 Process Model
What process do people use when attempting to resolve a Db2 performance or availability problem? It basically follows a path similar to all database performance diagnostic processes:
- Identify the bottleneck or problem
- Collect statistics about the affected area
- Apply the statistics to the Db2 Process Model
- Take the corrective action
Identifying that a performance problem is happening often is done for you—someone calls you on the phone or rushes over to your desk. But that’s not the optimal way to find out that a performance problem is happening, since it probably
Db2 LUW database performance metrics are accumulated constantly in memory on Db2 for access via SQL, querying mon_get table functions to request those monitoring elements. You can also run Db2 event monitors that collect information about “events” like transactions or deadlocks. And there are several other ways to collect metrics about what’s happening on your Db2 instance or database. All of these require knowledge of the metrics you wish to retrieve or view. And, you need to learn and understand the mechanism or source of the performance data.
So, however you retrieve the important performance metrics about Db2, from Db2, you can apply them to the Db2 Process Model introduced in the previous section. How? The IBM Knowledge Center provides guidance on maximum settings for configuration parameters at the database manager and database levels, and suggests monitoring elements to gather from Db2 to help you adjust those parameters optimally.
Keep in mind that the Db2 LUW Self-Tuning Memory Manager (STMM), since Db2 LUW version 9.7, can automatically adjust the size of some memory areas. Here’s a blog post by IBM Gold Consultant Ember Crooks that clearly explains the areas of memory that STMM can affect: https://www.xtivia.com/Db2s-self-tuning-memory-manager-stmm/. And IBM’s documentation explains it here: https://www.ibm.com/support/knowledgecenter/SSEPGG_11.5.0/com.ibm.Db2.luw.admin.perf.doc/doc/c0024366.html
A lot of guidance is out there on how to apply the monitoring data available to you to the Db2 Db2 Process Model in helping to figure out what needs fixing and how to fix it. But, as you can see, much of that effort will depend on detective work.
Performance tuning with IBM Db2 Process Model and Spotlight® to quickly solve slowdown causesWouldn’t it save a lot of your time and energy if you could:
In that case, let’s look at Spotlight®. |

Performance diagnostics at the speed of Spotlight
The keys to fast, consistent diagnosing of a performance issue that is effecting an important application are automated retrieval of Db2 metrics, visualized alarms and fast drill-down to the metrics you need for understanding the cause of the problem.
- Automating the retrieval of Db2 performance metrics
- Visualized severity-based alarms and context-sensitive Help to help you understand the impact of the issue, and what might need to be addressed
- Guided diagnostic workflows
Spotlight will collect information as soon as you launch its client application. The Spotlight tool is one of many and is part of the collection of tools from the Toad® for Db2 LUW DBA Edition. If launched from Toad where you have already supplied credentials to connect to a database, that same database will be the focus of the Spotlight session that starts.
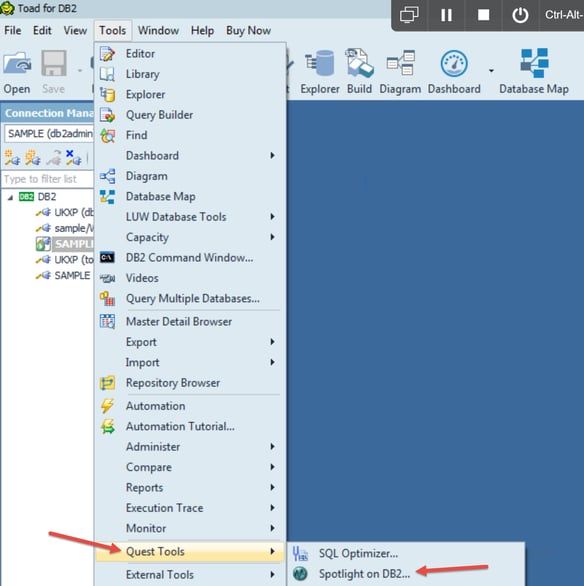
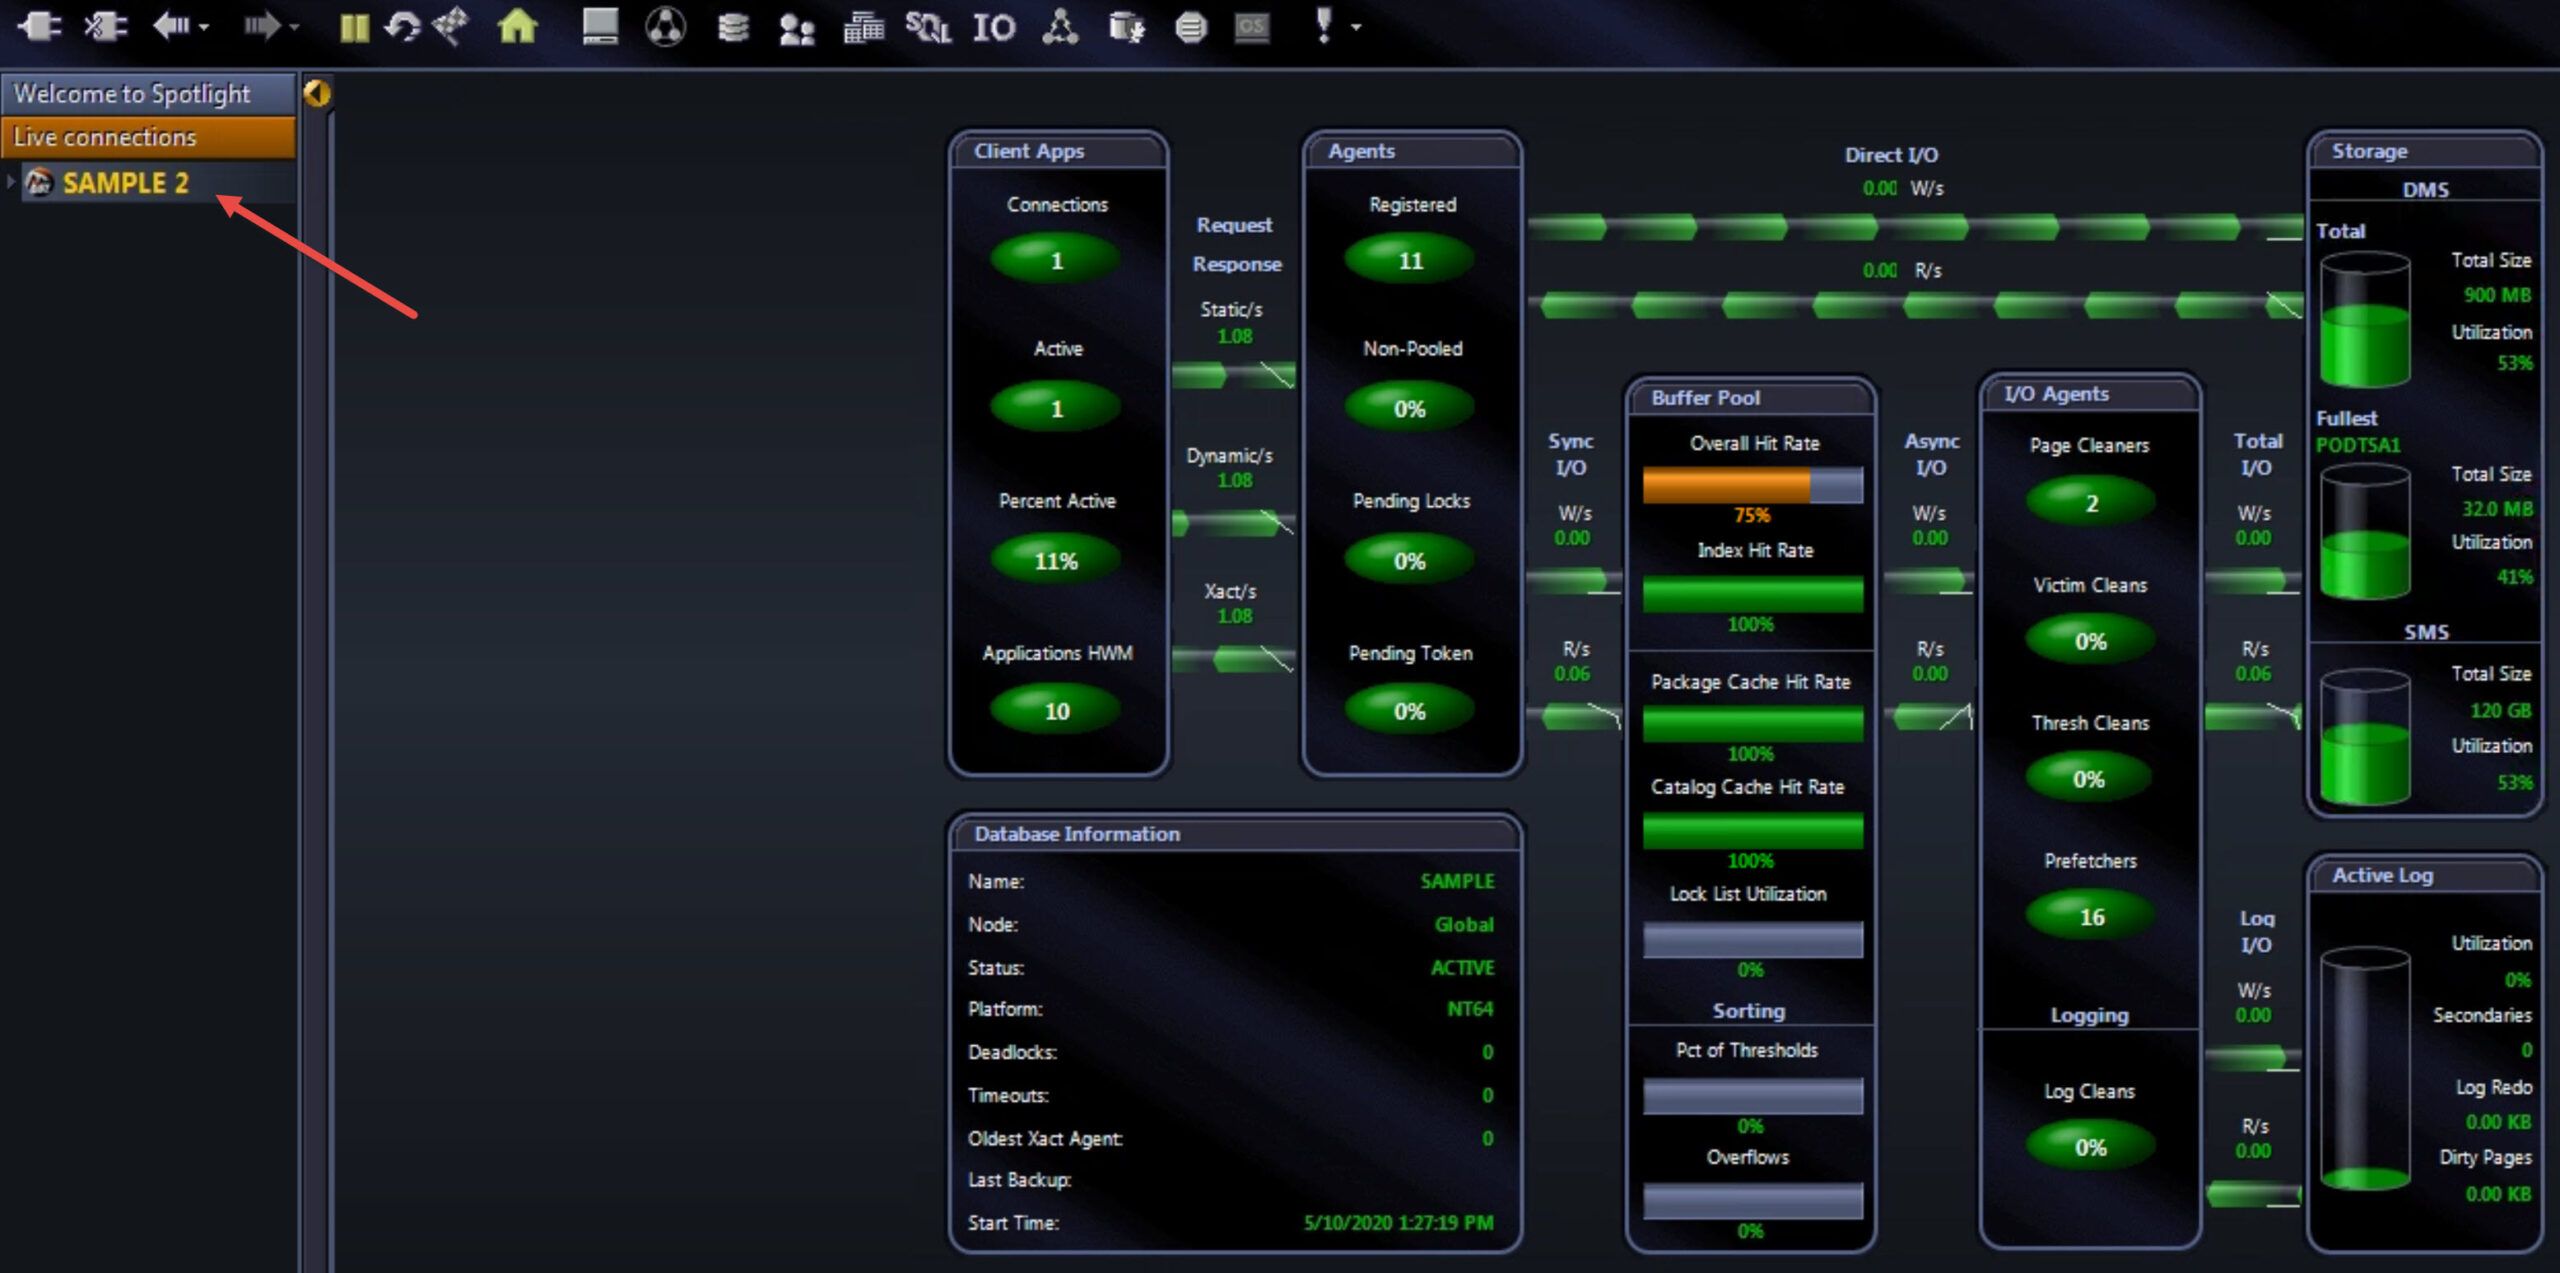
Spotlight launch from Toad
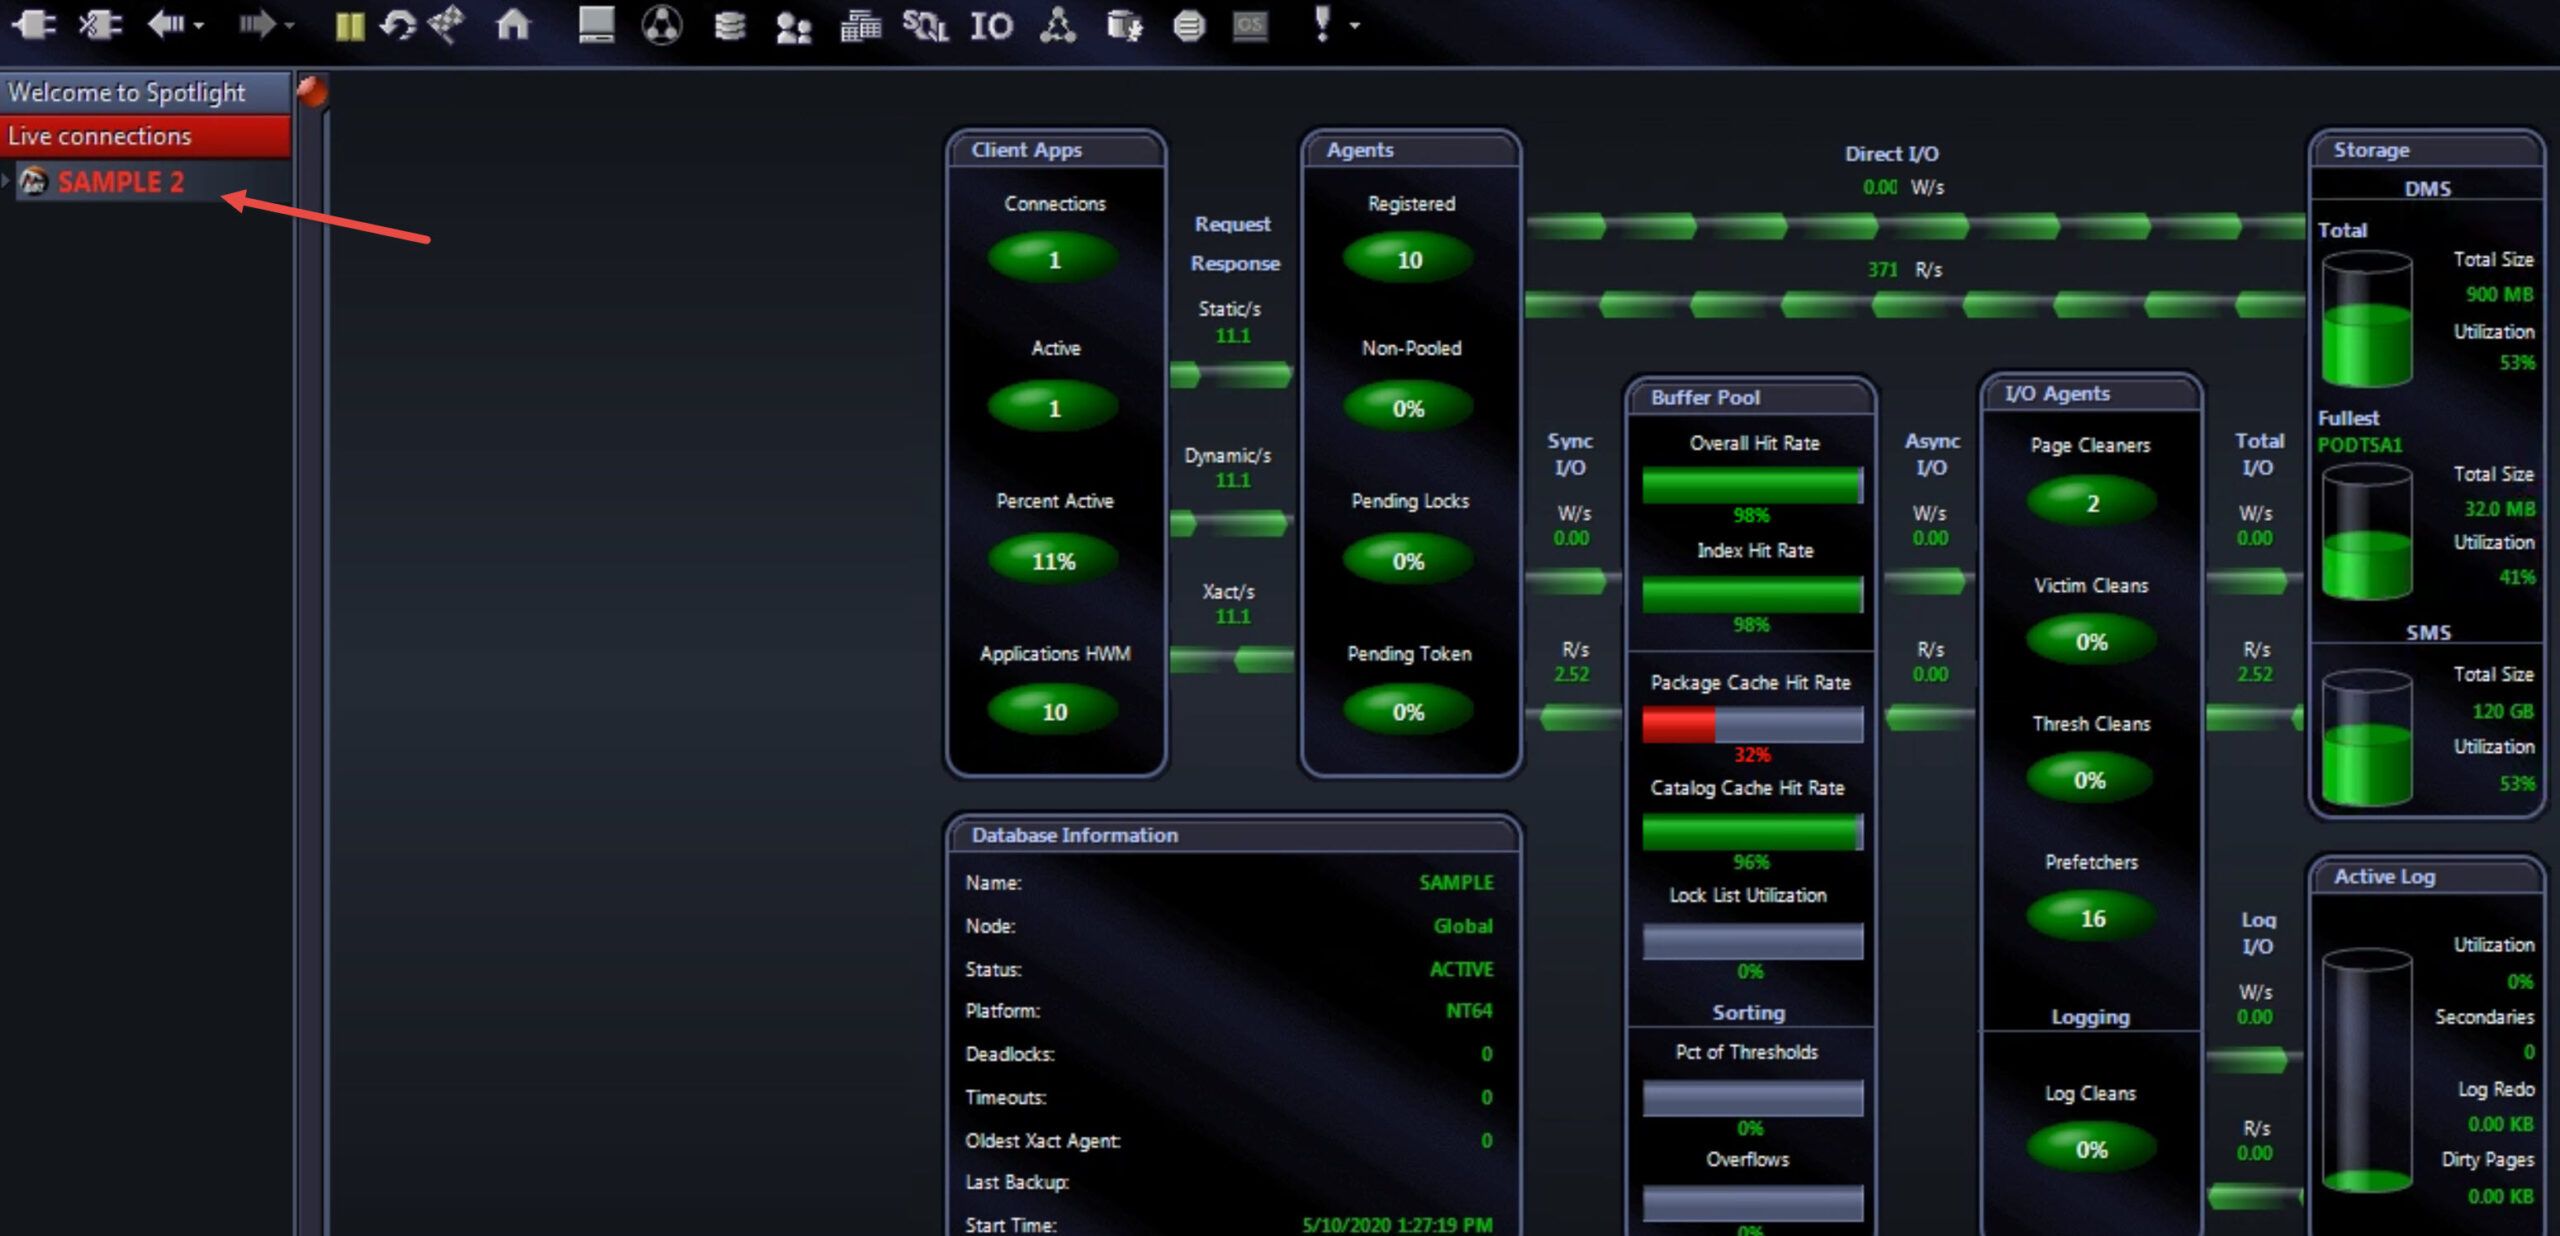
Spotlight showing fatal alarm
Above, the example shows fatal (red) alarm on one of the Hit Rate metrics depicted on the “Db2 Process Model diagram” that is the Spotlight home page. Your eye immediately goes to that problem, a quick identification of a current Db2 performance bottleneck of some kind.
Clicking on ‘Help’ or pressing the F1 key will bring up the Help facility where you can search on words like “Heap” or something more specific, and read about the alarm you’re seeing or other Db2 problem areas that you would like to better learn how to solve.
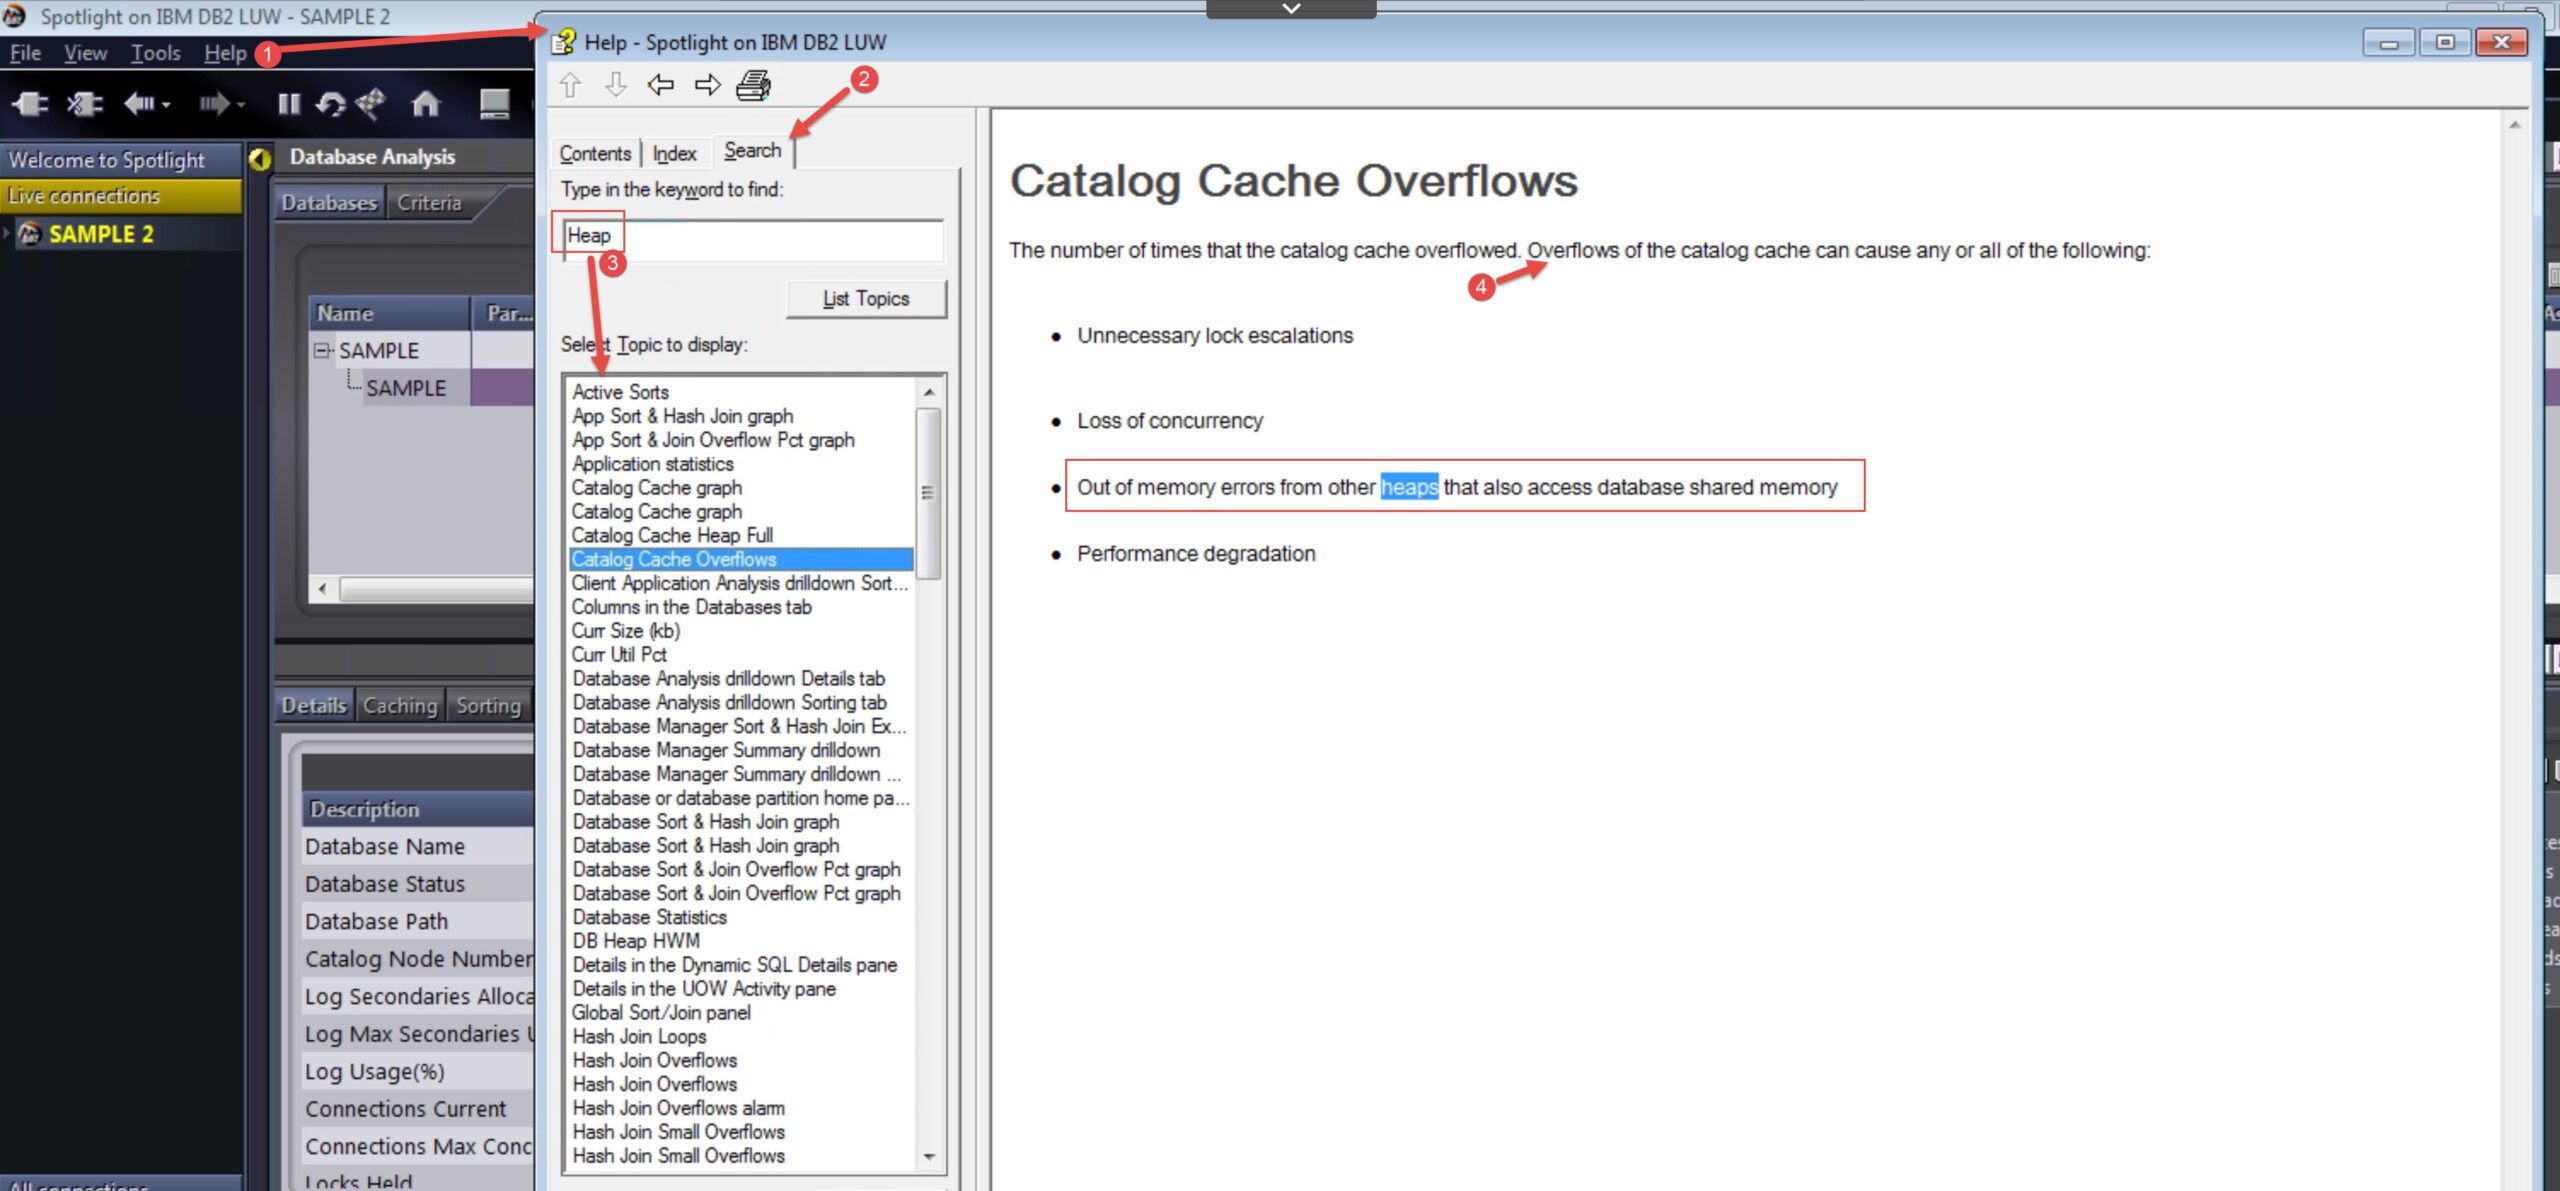
Spotlight Help
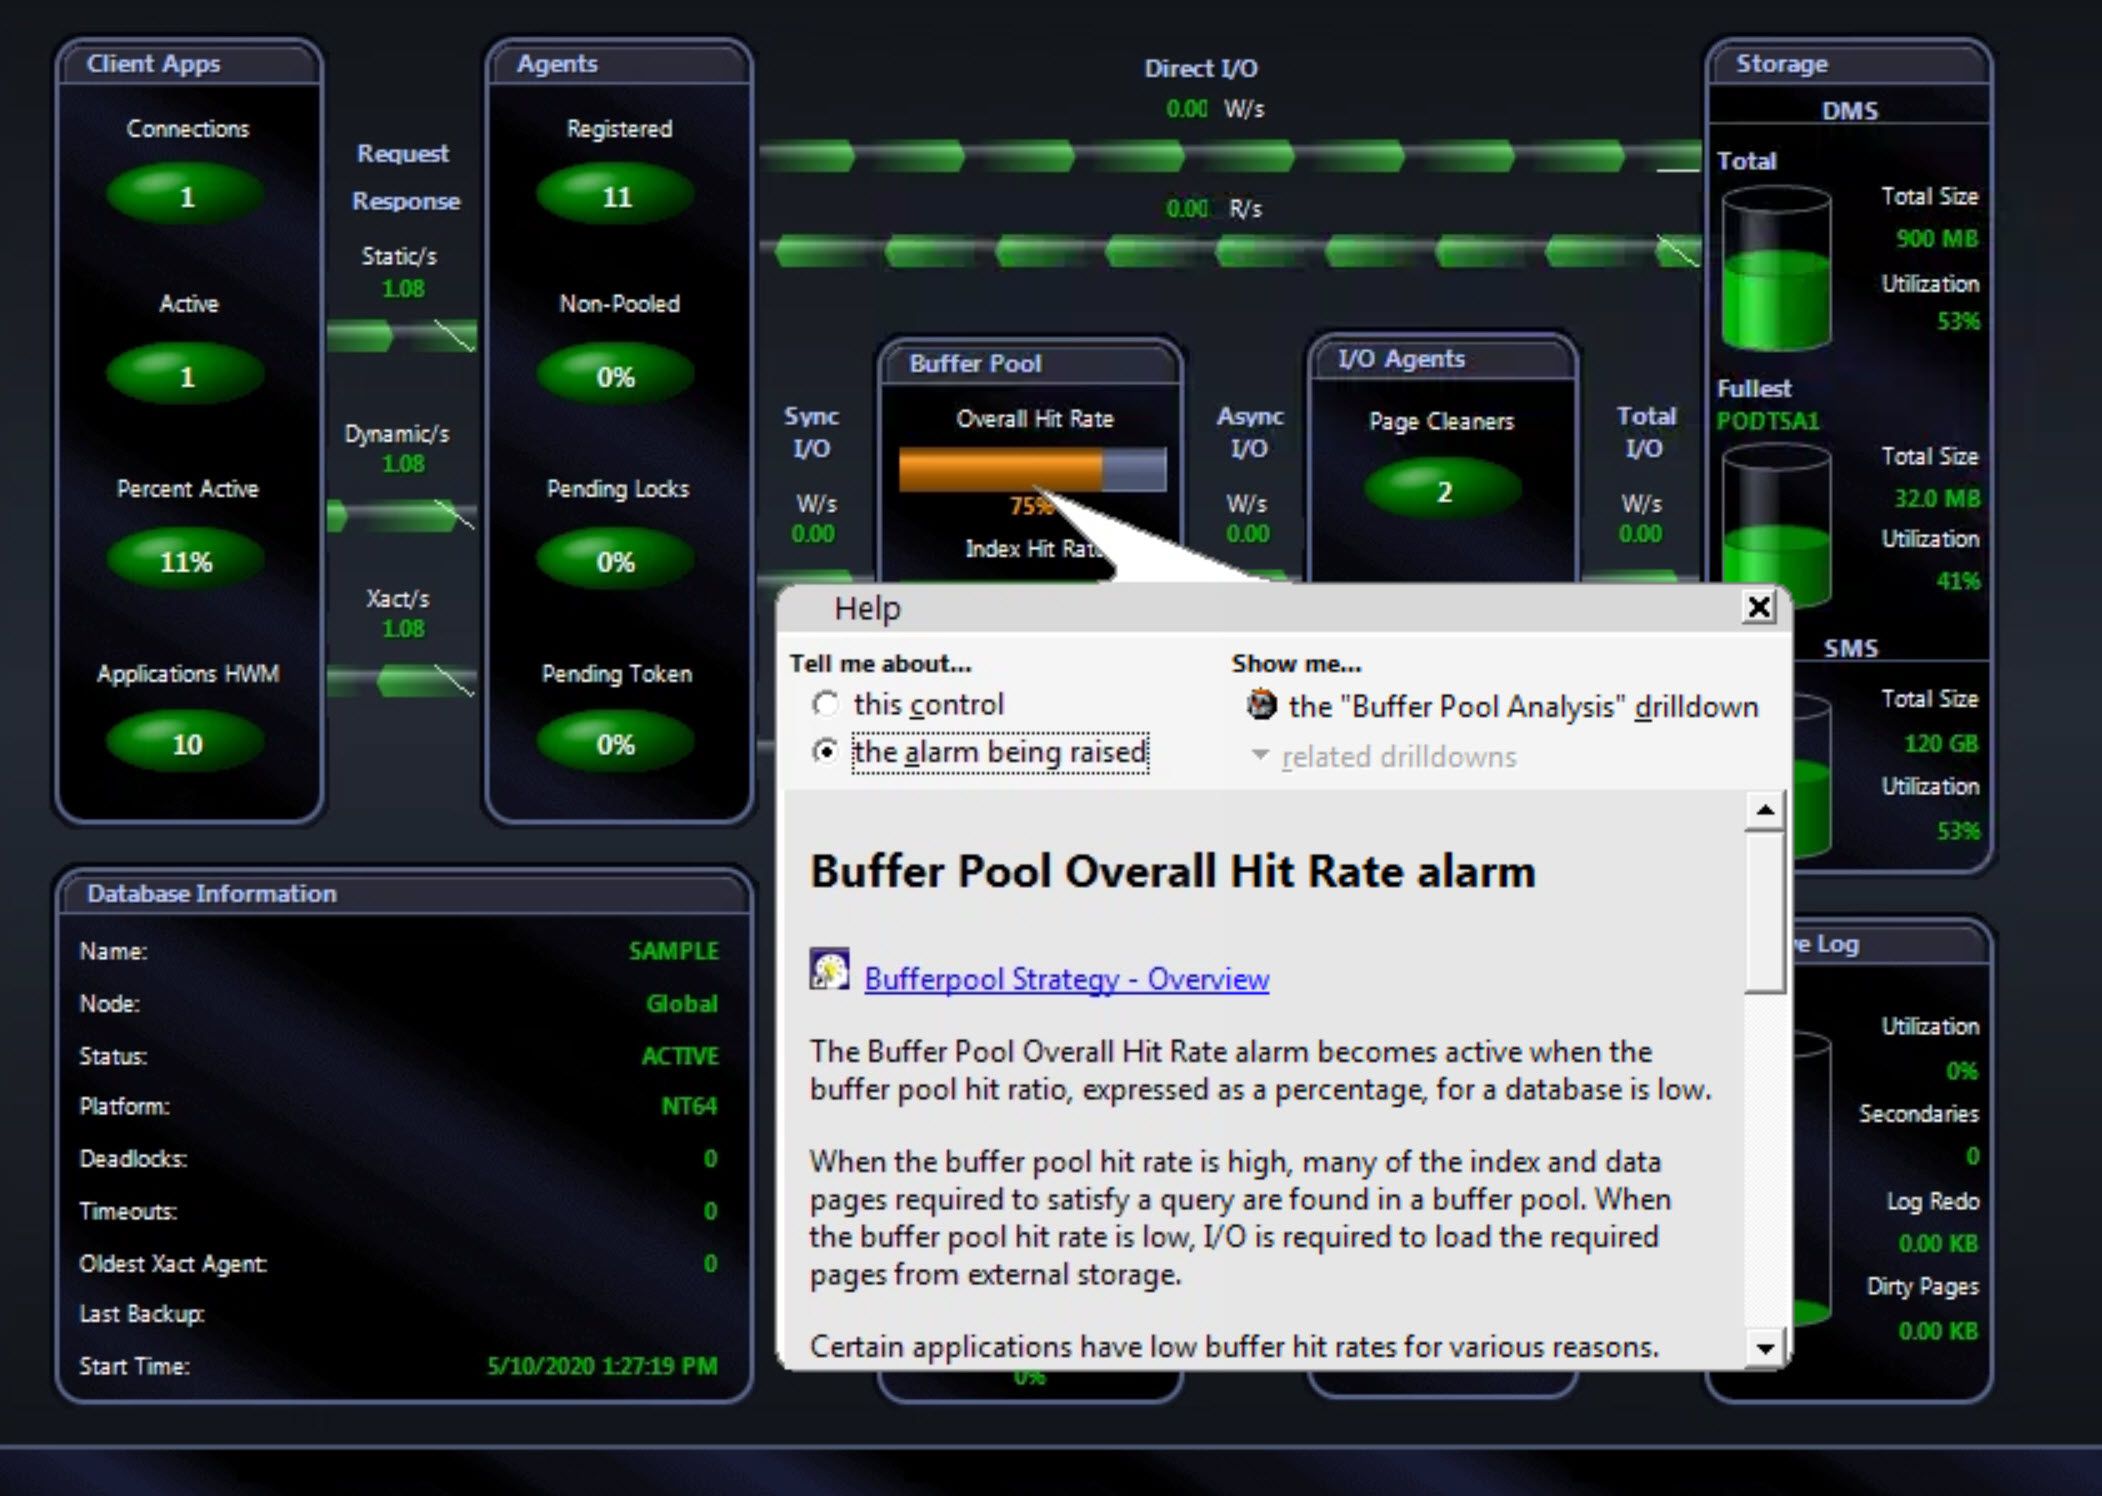
The next example isn’t quite as urgent, perhaps—it’s a “critical” severity alarm this time (orange). It’s a buffer pool problem of some sort. You can drill in for more detail and root cause investigation.
Spotlight showing critical alarm
Click on the Orange Buffer Pool Hit Rate bar to begin the directed diagnostic workflow; you will see pertinent information about the meaning of the alarm, some helpful guidance for possible fixes, and a hyperlink to someplace else in Spotlight to get more information (in this case, the “Buffer Pool Analysis” drilldown):
Spotlight Buffer Pool alarm drilldown
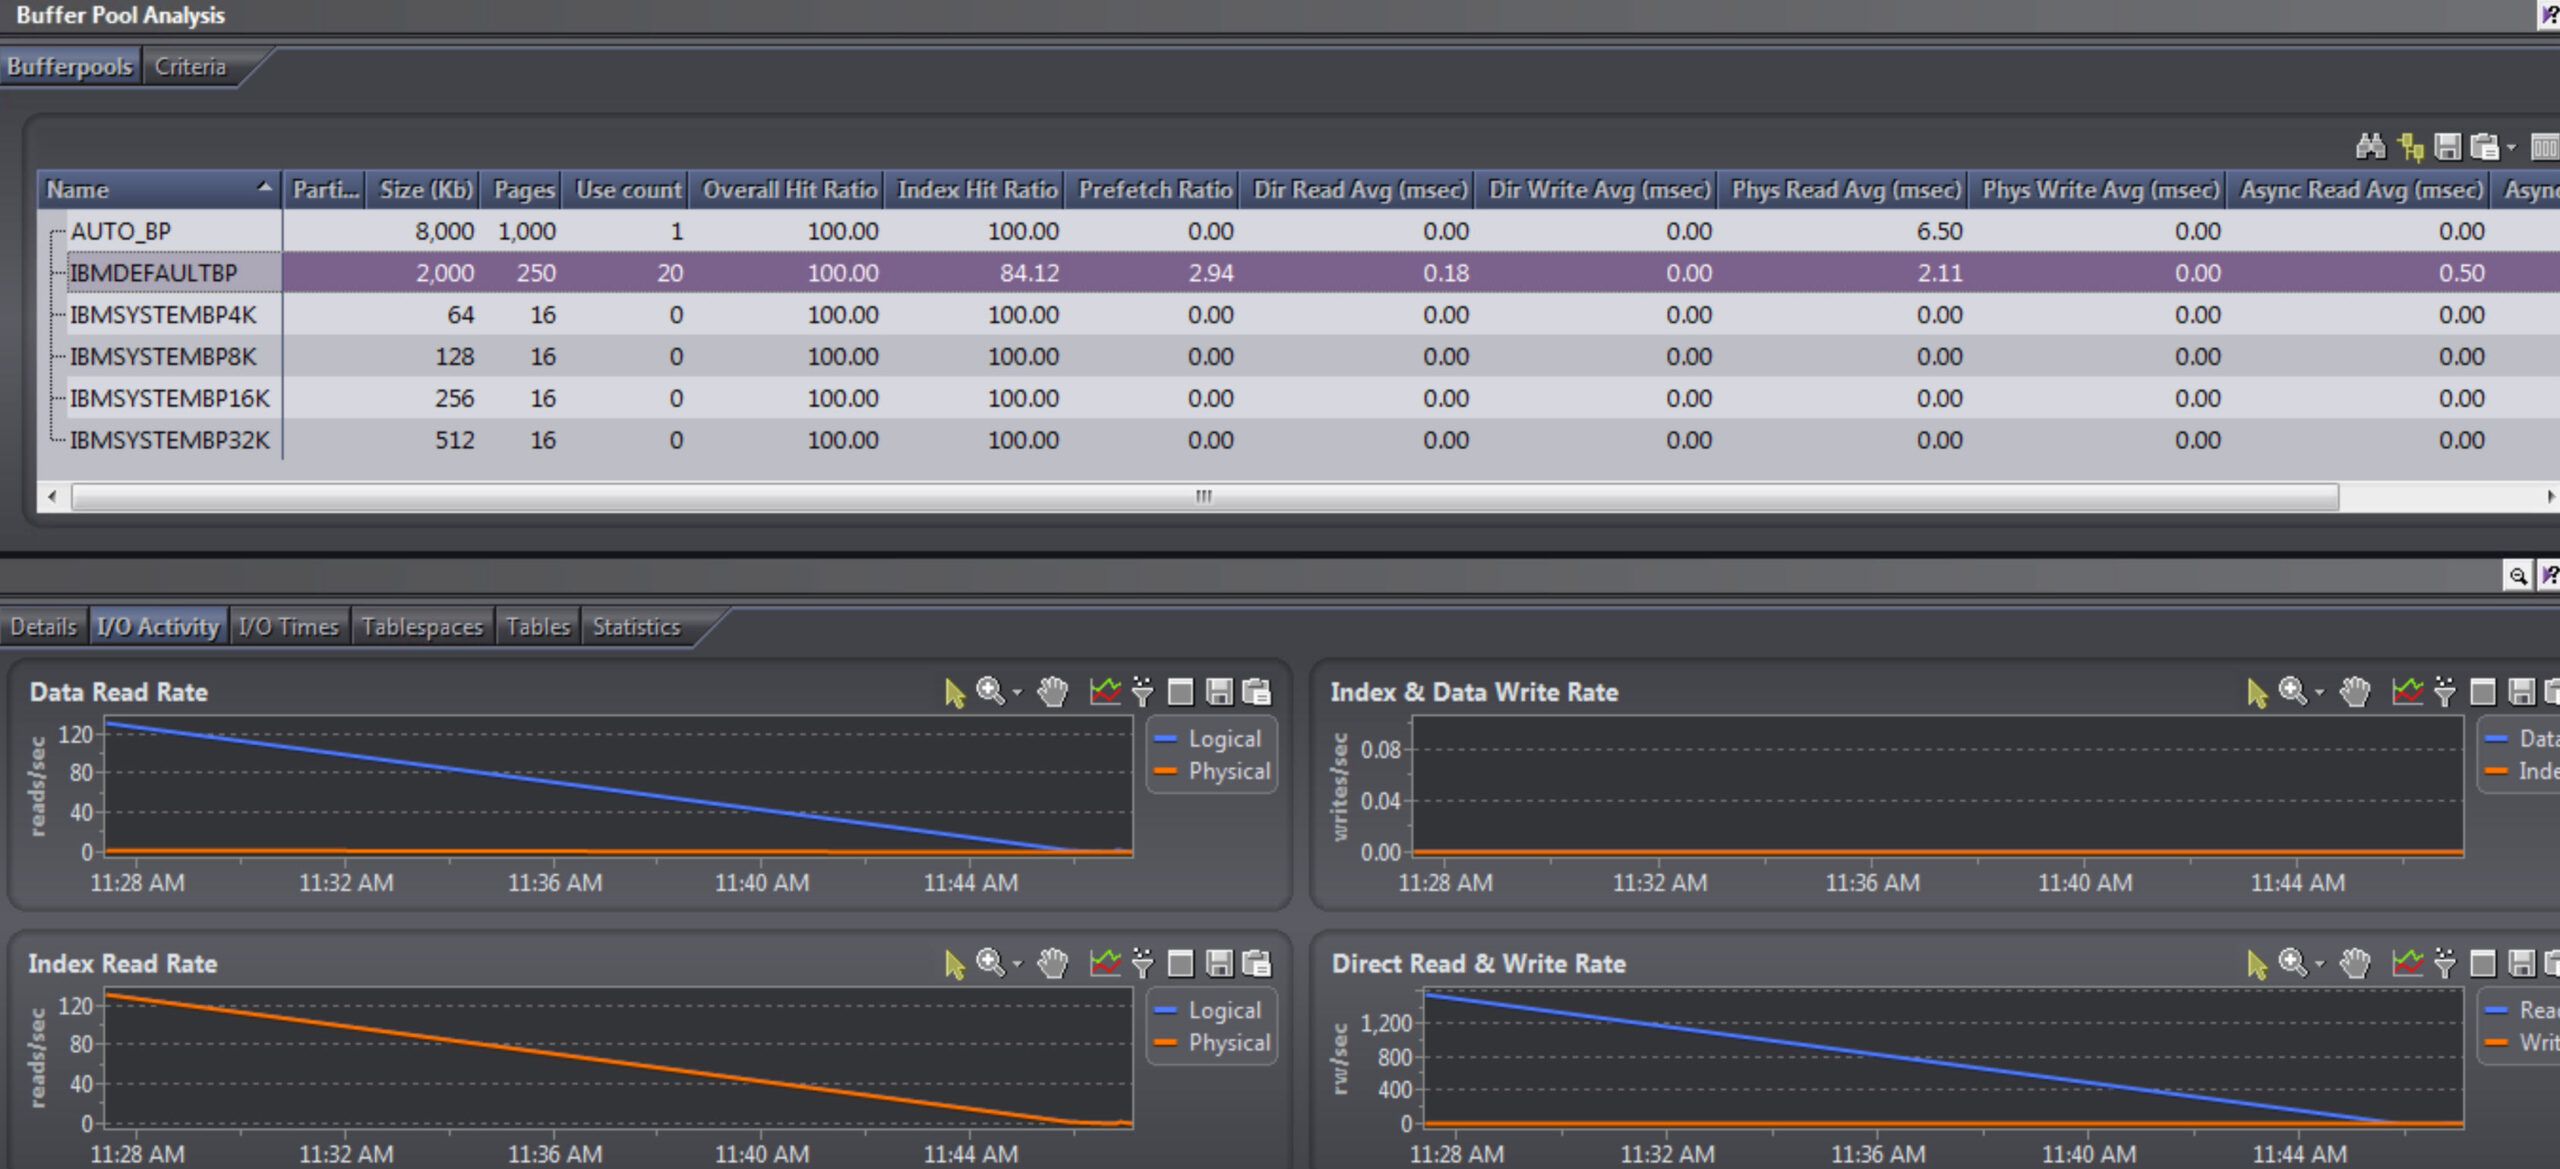
Spotlight Buffer Pool Analysis
So, in a few mouse clicks, you’ll see many of the same metrics you would have received back had you coded and executed a SQL statement against Db2 monitoring table functions. But the collection by Spotlight was all automatic, and the metrics were available as you followed the directed troubleshooting workflow: Home Page (alarm)—Buffer Pool Analysis—specific buffer pool.
This next example shows a common issue—lock contention. Spotlight will let you know how critical (red, orange, yellow by severity) the problem is in terms of the percentage or number of connections waiting for locks.
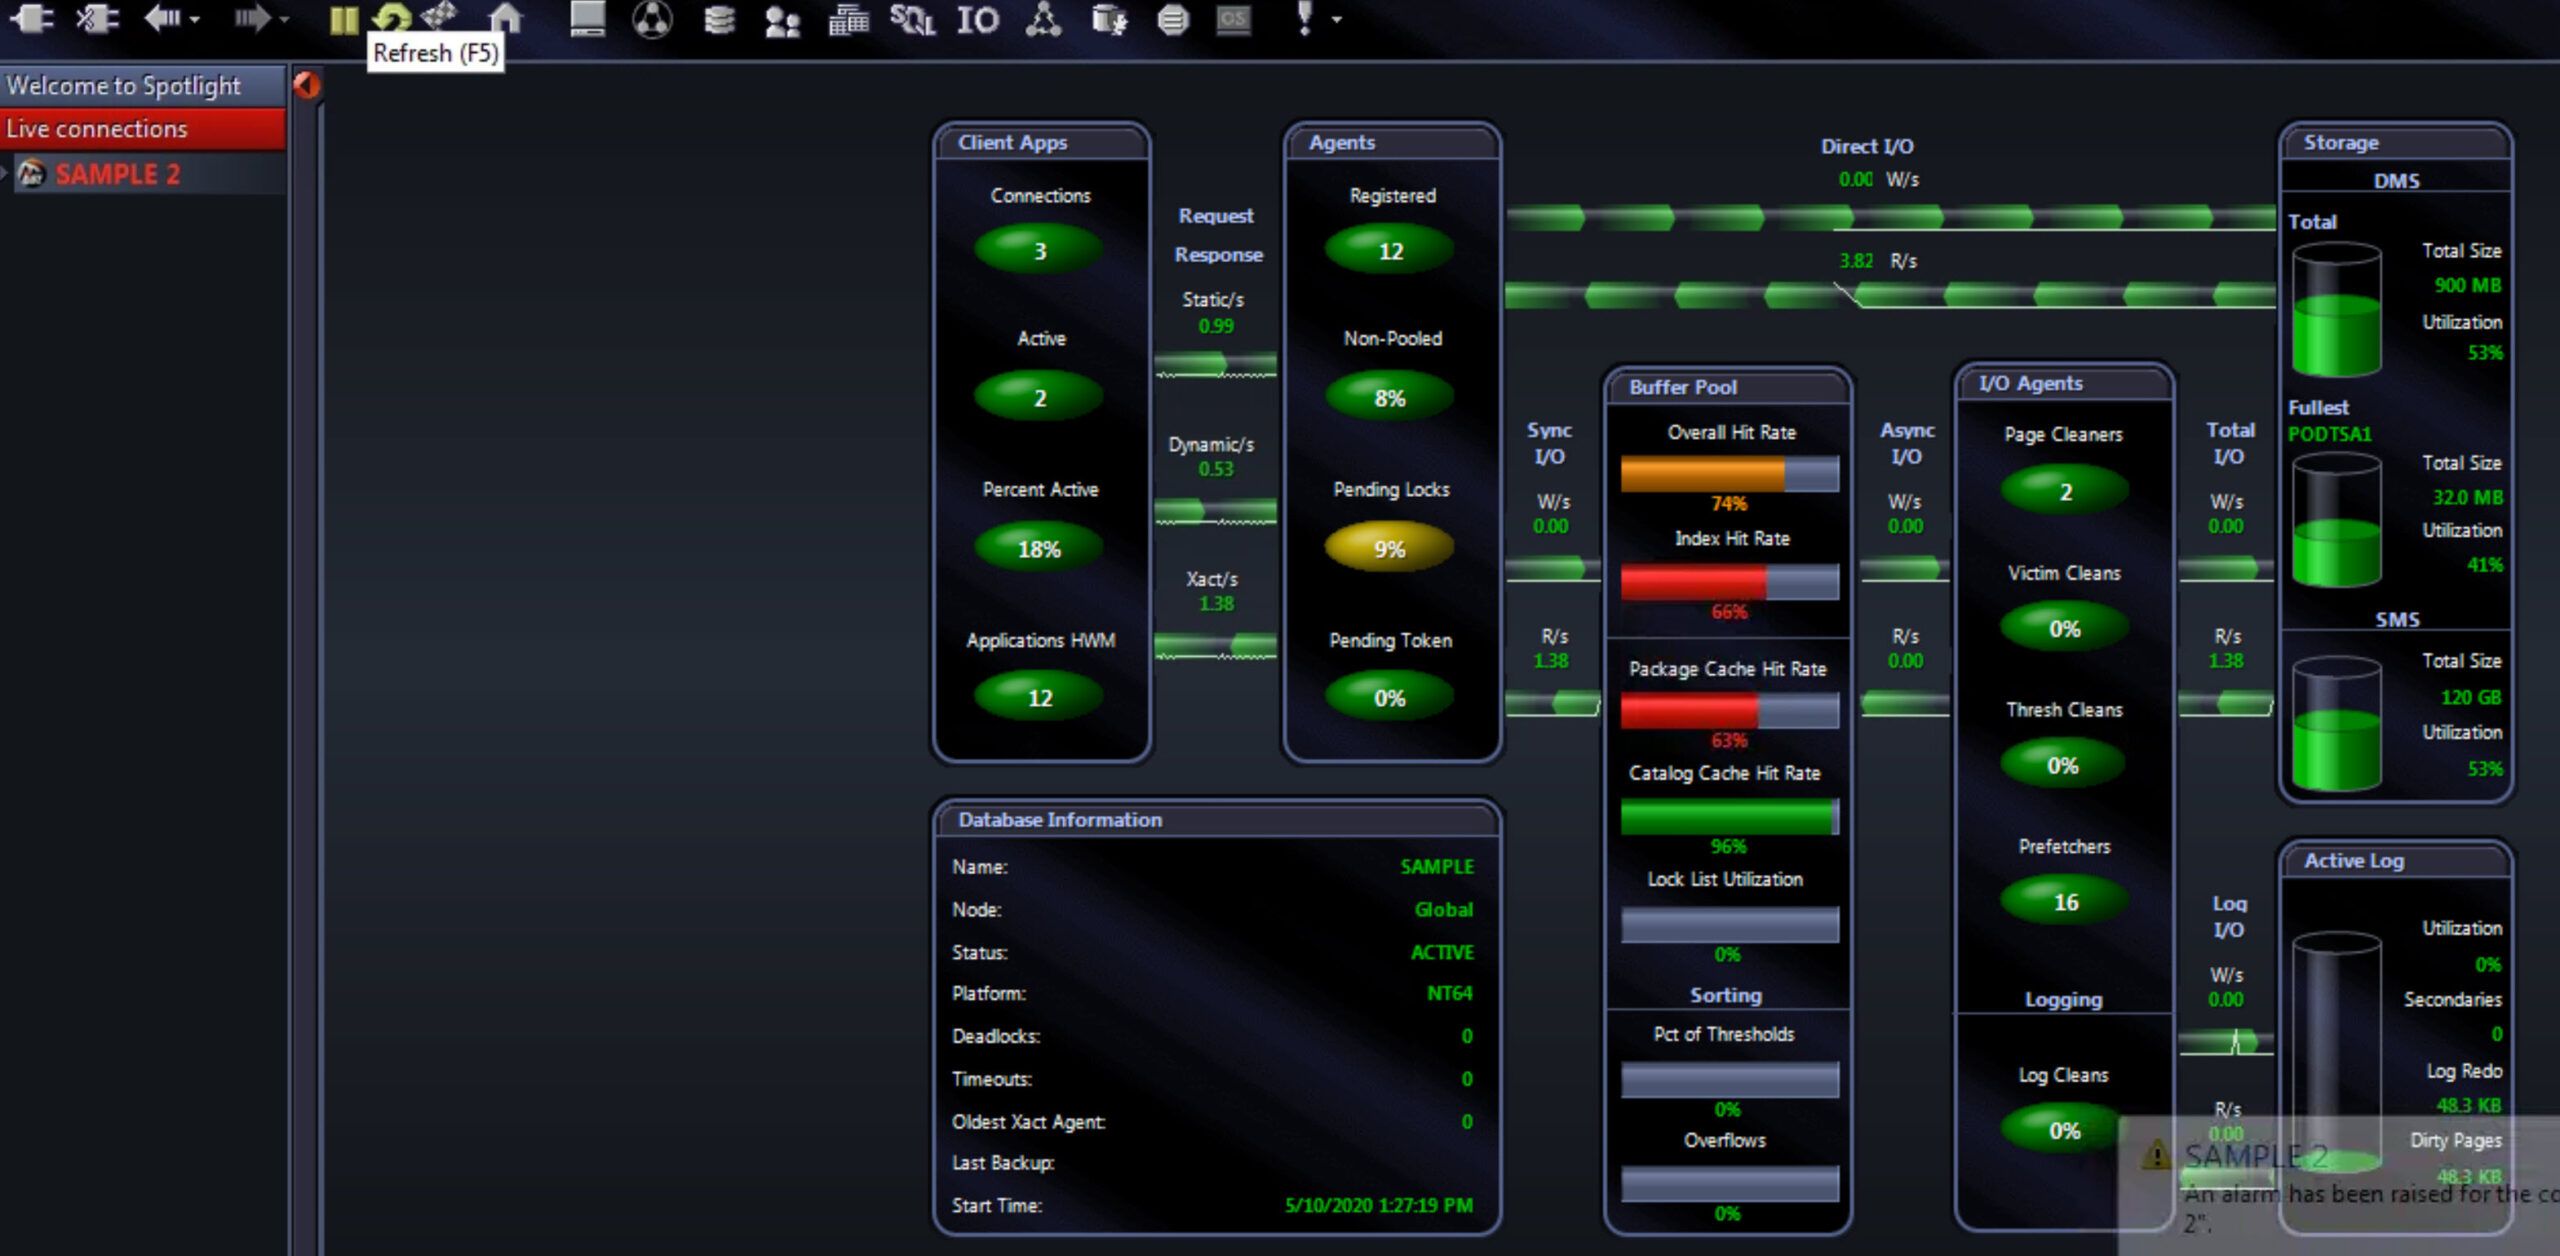
Spotlight several alarms with blocking
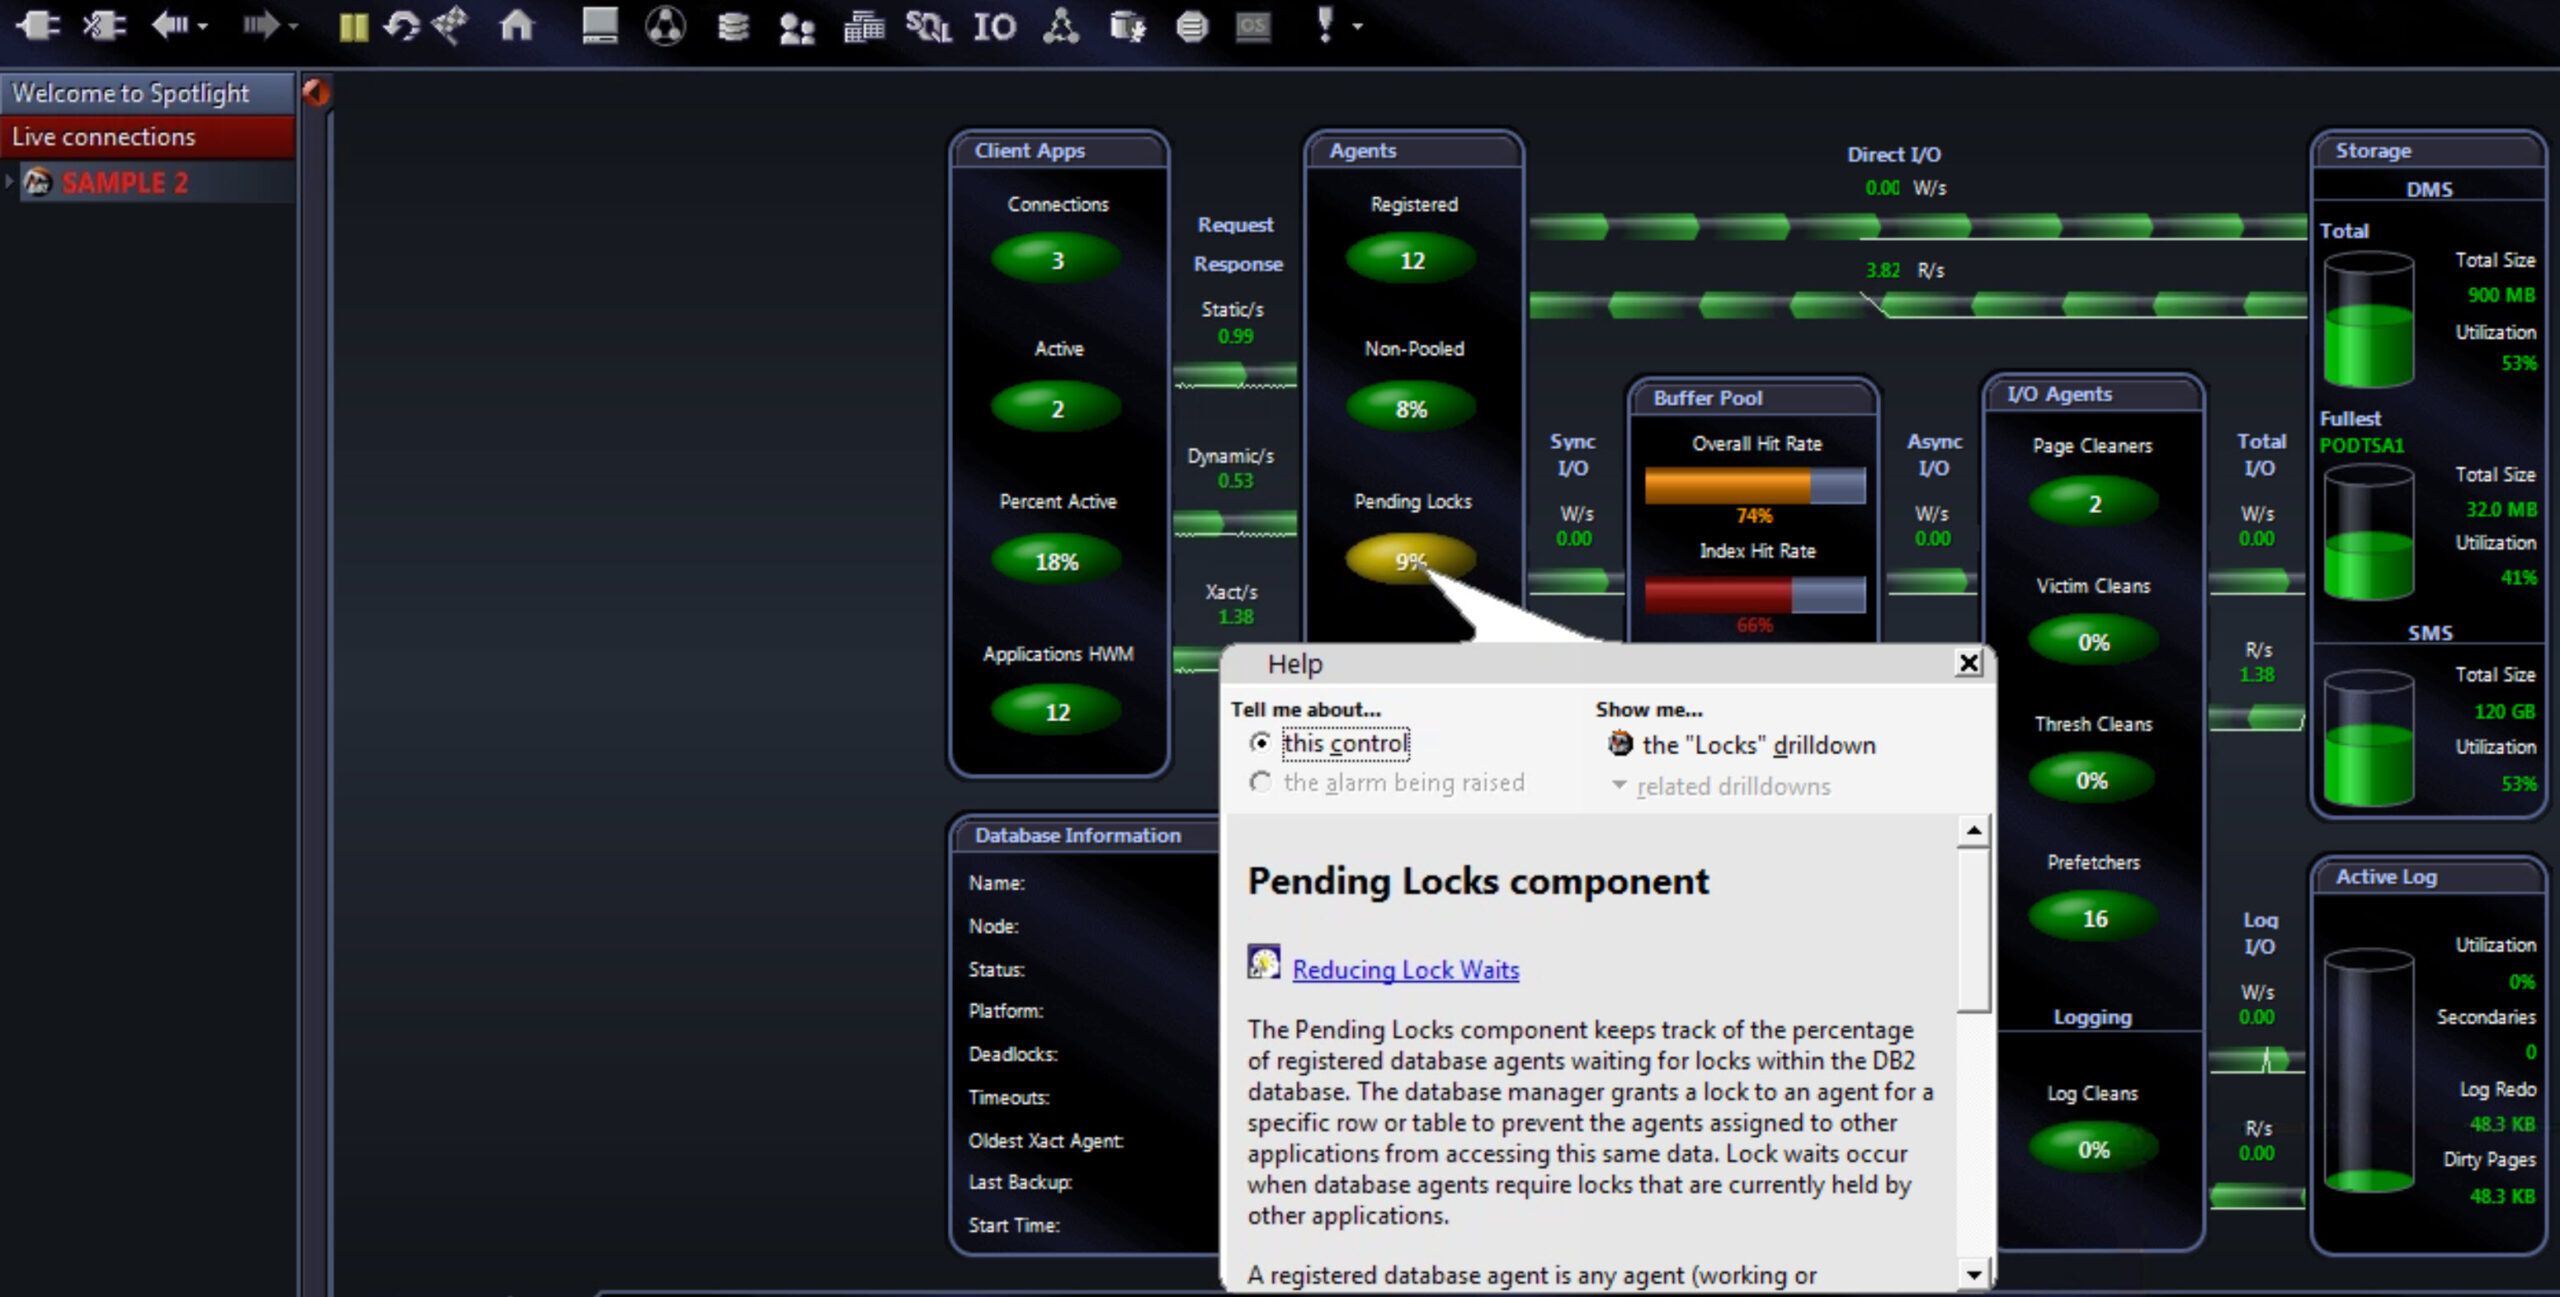
Spotlight lock wait drilldown
Clicking on “the Locks drilldown” link will get you to the list of current connections to this database. Those with “LOCKWAIT” status are our targets—we want to find out why they are waiting (who has locks).
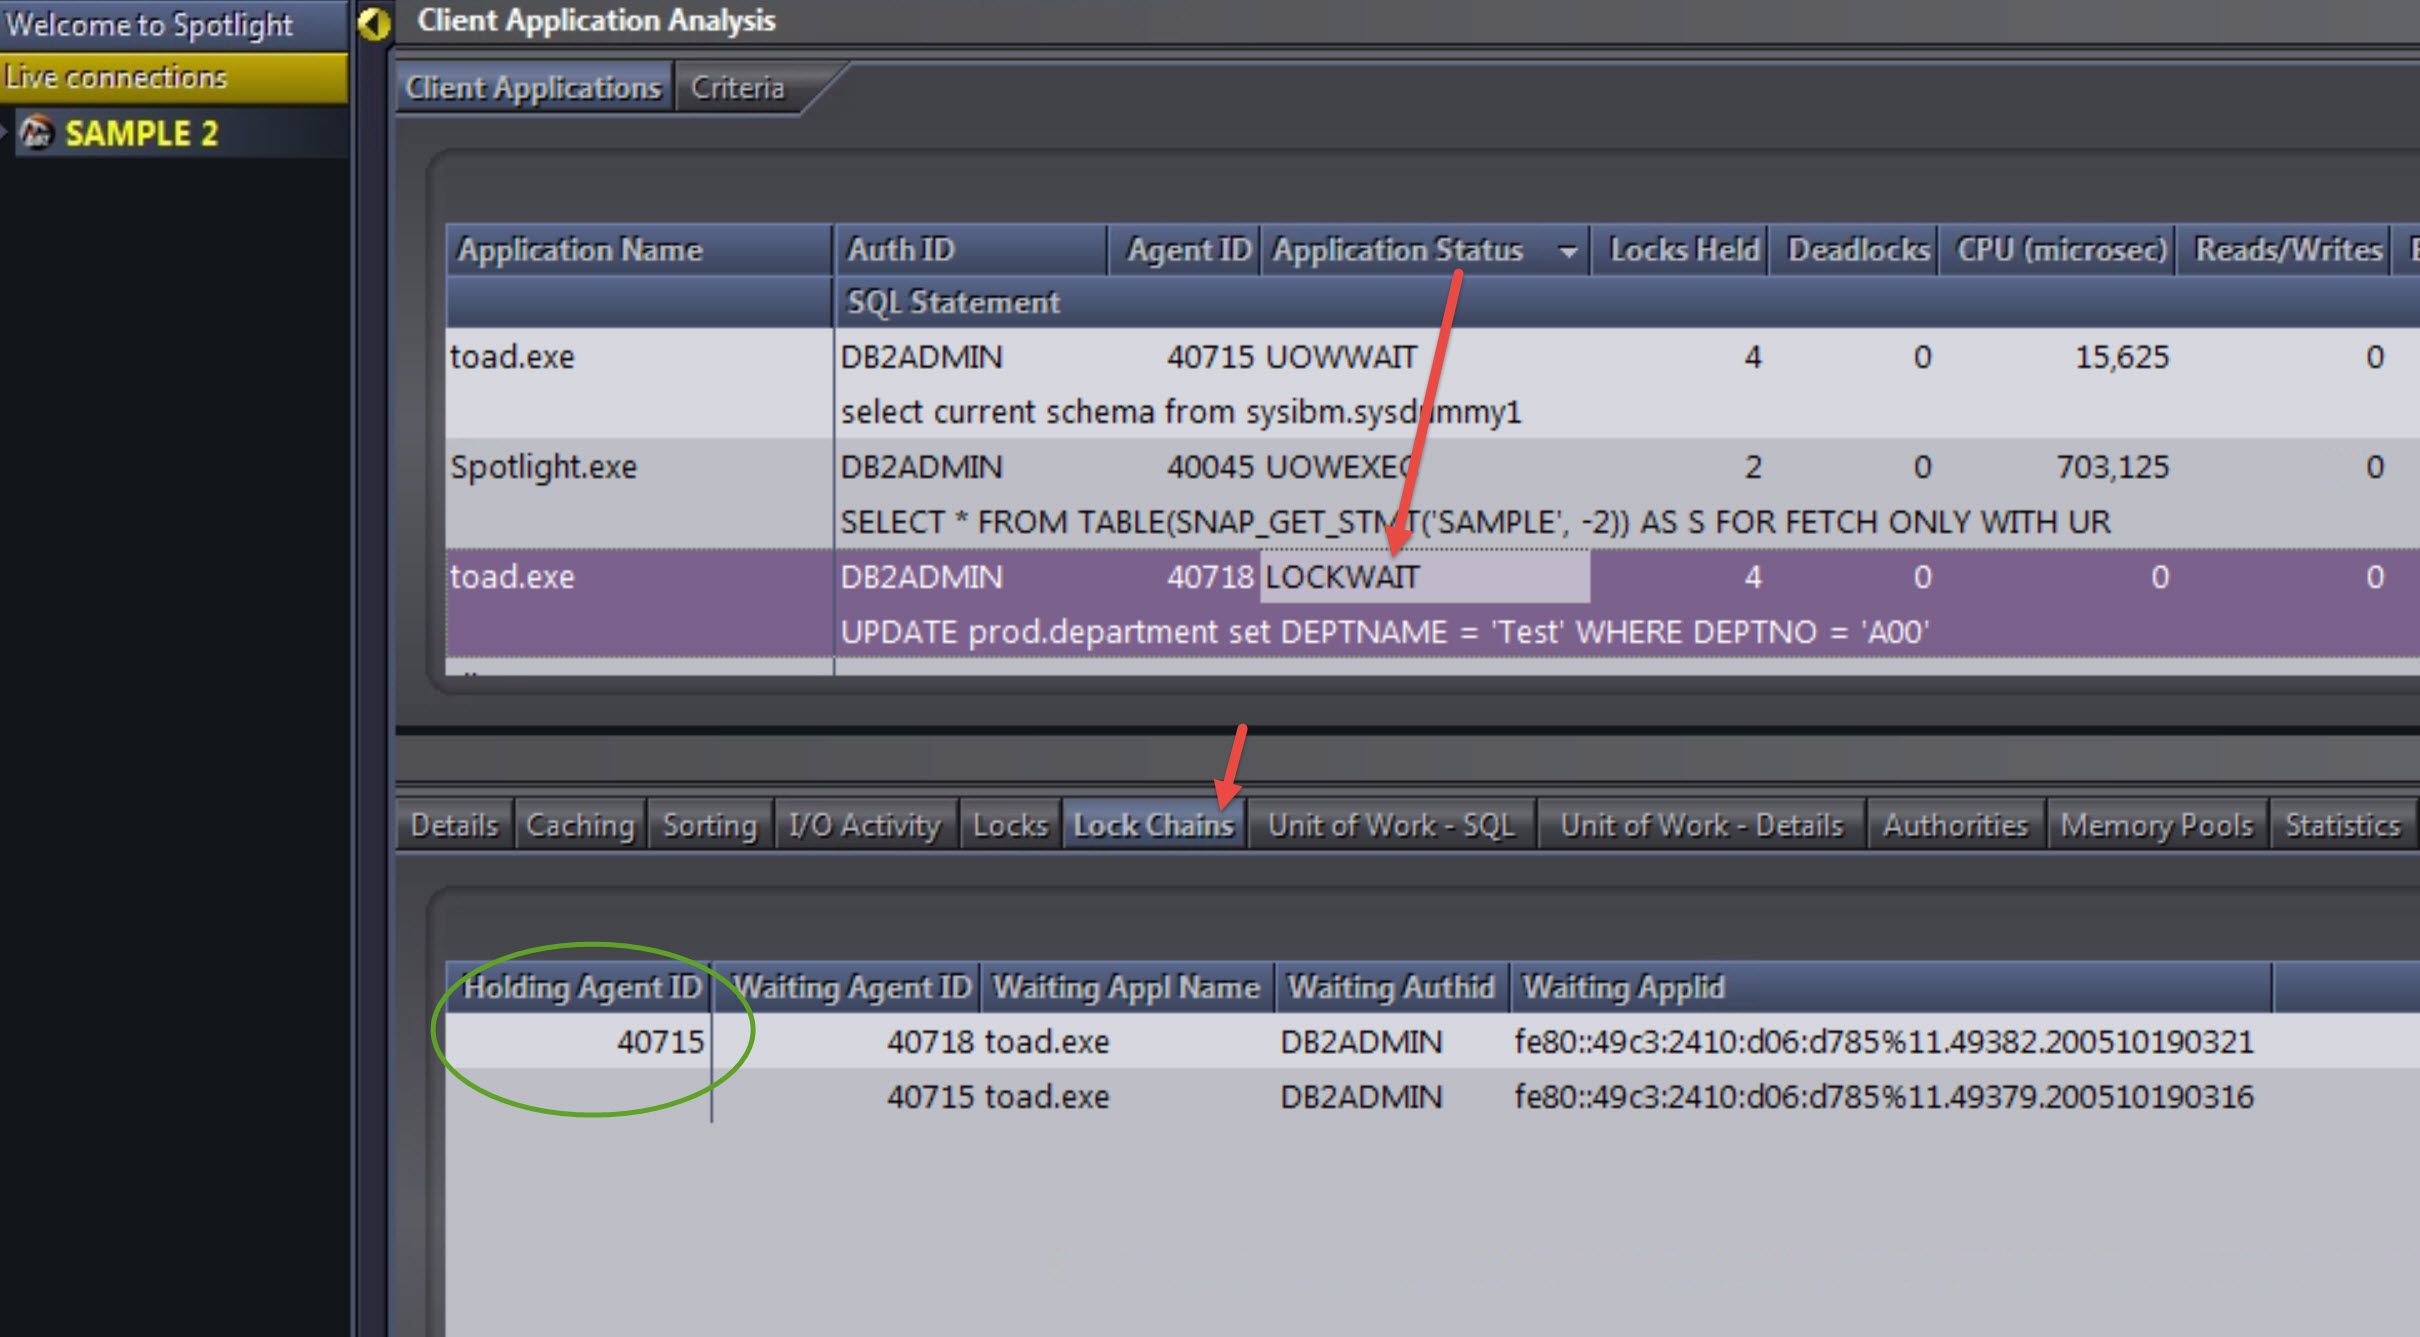
Spotlight lock tree
So, another fairly common relational database issue in many organizations, solved quickly. In fact, another step available on the above screen is to right-click on the culprit (lock holder) and force it off, essentially killing the connection and its processes.
Summary
We saw in the preceding examples that the collection of metrics is automated, by Spotlight, and the directed troubleshooting workflows lead you quickly through finding even more helpful metrics and visualizations that will help with Db2 performance tuning.
As mentioned earlier, to decide which actions to take in performance tuning Db2 (e.g., turning dials, resetting configuration parameters) based on the Db2 Process Model, follow the IBM documentation in the IBM Knowledge Center.
Learn more about Toad for Db2 LUW DBA EditionToad for Db2 LUW DBA Edition is an integrated solution for Db2 LUW database administration. Spotlight on Db2 is just one of a few tools that comprise this solution. Learn more about Toad for IBM Db2 so you can spend less time managing Db2 and more time innovating.
Try Toad for IBM Db2 for freeAre you in a trial now or just learning about Toad for IBM Db2? Find out which edition is right for you with our Toad for IBM Db2 functional matrix. Like what you’ve learned so far about Toad for IBM Db2, why not try it for free for 30 days? |
Questions?
Start a discussion about this blog in the Toad World® forum, Toad for IBM Db2.
Help your colleagues
If you think your colleagues would benefit from this blog, share it now on social media with the buttons located at the top of this blog post. Thanks!
Start the discussion at forums.toadworld.com