Hi, This article hopes to compare Toad v13.0 and SQL Developer v18.1 a bit. Since I work with both tools in my training business, people often ask me to point out the differences in the two. I hope to do so in an objective way.
SQL Editor
Both tools have insights…popup of available objects/columns where you can click and add to your SQL. Both tools have a history of SQL executed.
Code Snippets
Both have code snippets panel where you can drag and drop code examples/formats/hints/formatting/more to the editor window. SQL Developer has a separate snippets panel just for Analytical SQL.
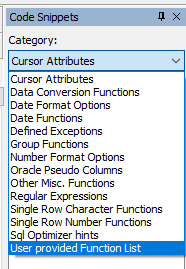
Toad Code Snippets
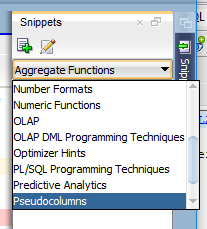
SQL Developer Snippets
Notice the slider bar, there are quite a few more selections than what would fit in this display box.
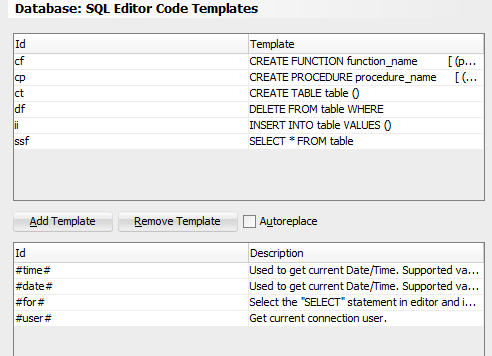
Code Templates
Toad has a more robust code template with just over 40 templates, where SQL Developer has templates as well; their code examples are both in SQL Editor Code Template area (fewer than 10 templates and work more like Toad Auto Replace) and has better code templates in its snippets panel, but again not very many of them.
Toad has quite a few more code templates and they can be setup to be quite interactive with substitution variables. Toad’s templates are signaled with a short name and the CTRL + space bar, or just CTRL + space bar to bring up the whole list. SQL Developer’s are signaled with their shortcut name and the space bar. Both allow for coding shortcuts, with SQL Developer using its Code Template setup and Toad usingits Auto Replace feature.
Toad has a considerable bit more in both the code template area and the auto replace area. Both tools have good coverage of SQL and PL/SQL topics, including optimizer hints that I use from time to time when doing SQL tuning.
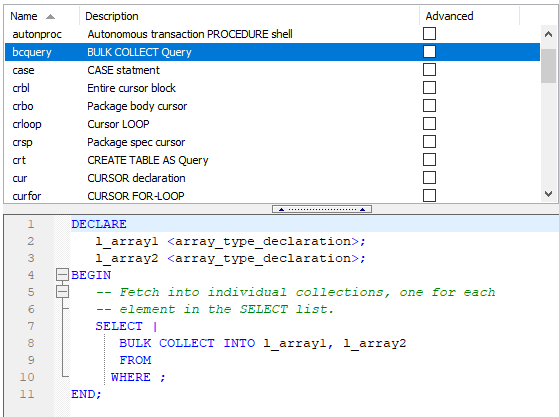
Toad Code Templates
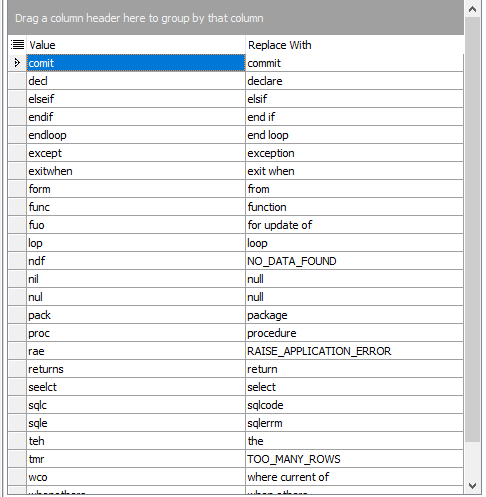
Toad Auto Replace
SQL Developer Code Templates/Auto Replace
PL/SQL Topics
Code Analysis
Toad contains Code Analysis, a nice review using industry standard rules to view PL/SQL code complexity, complexity of the SQL inside the PL/SQL routines, and quality of the PL/SQL code in general. Developers can see how they did with both complexity of the PL/SQL and SQL code. Team leads can quickly see the complexity of the code and make sure the correct people are assigned to a coding project. Click here to read my blog on Code Analysis. SQL Developer doesn’t have anything like this.
PL/SQL Debugger
Both tools have a similar PL/SQL debugger. Both are intuitive to use.
SQL Developer’s debugger in Oracle12 needs some additional permissions to run. I was caught off guard in a class becausethis feature that needed additional setup. I got quick assistance from the Oracle team and was referred to Galo Balda’s blog. I’m not a network hack and his instructions were good but not quite complete. This blog did point me in the right direction and I was able to get the debugger working, but not in time for the class… In older versions of the database and perhaps older versions of SQL Developer, the debugger worked right out of the box.
There is a feature in Toad’s version of the debugger that I like. I can start the debugging process in Toad just by pressing the ‘Trace Into’ button. SQL Developer, I need to put a break point after the Begin if I want to start line-by-line debugging (using the ‘Step Into’ from the beginning of the program.) Other than this feature, both debuggers work very similarly, as they both use the same interface into the Oracle RDBMS.
PL/SQL Profiler
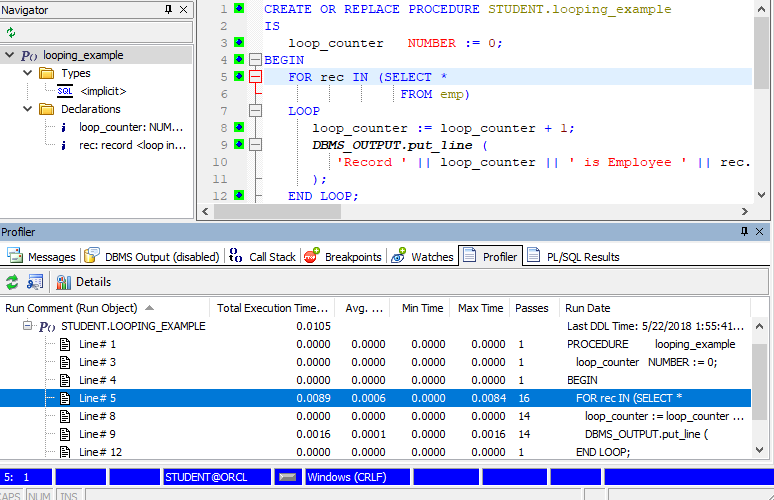
Toad has a nice interface to the PL/SQL Profiler.
Toad PL/SQL Profiler
Easy to use and get line-by-line execution time and number of passes in loops, etc. Easy to see exactly where your PL/SQL routine spent its time. Also, when you click on any line in the profiler output, the related line in the editor window highlights.
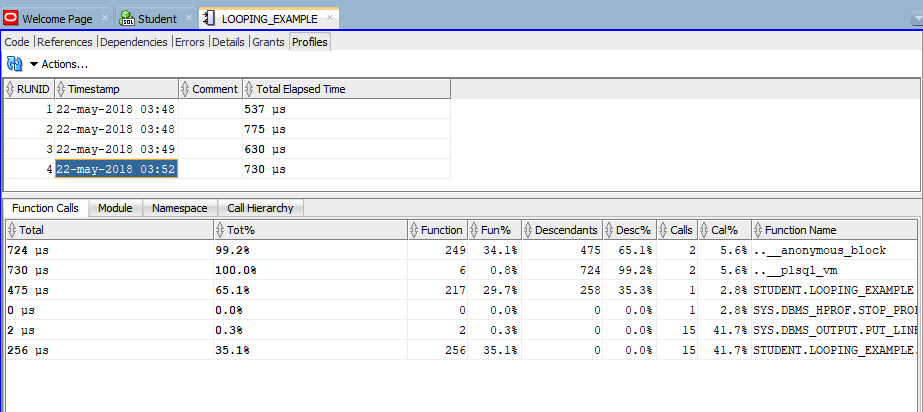
SQL Developer Hierarchical Profiler
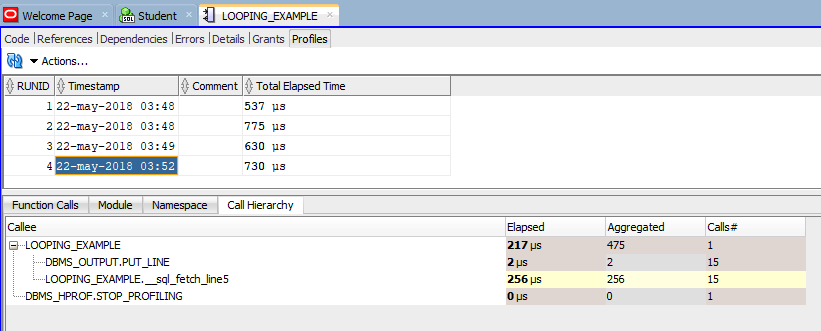
SQL Developer Hierarchical Profiler
SQL Developer has a nice interface to the Hierarchical Profiler introduced in Oracle11. This profiler gives a considerable amount of additional detail. In the above ‘Call Hierarchy’ tab, you can see the lines that took the longest to execute as well. The first panel above gives additional information about the entire execution process.
Tuning Topics
This is probably where some of the bigger differences between the two tools are
Both tools have quite a bit of flexibility when it comes to the exposed Explain Plan content. Both tools can show the current explain plan after execution as well.
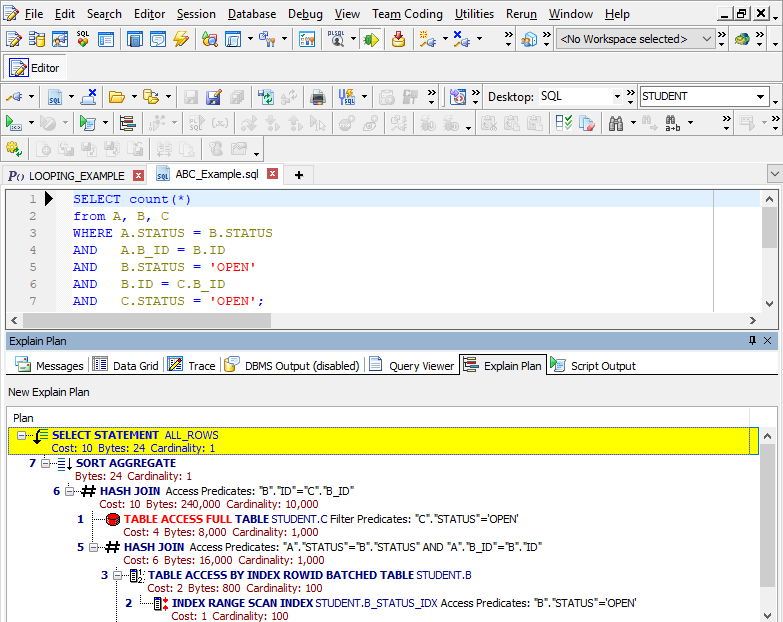
Toad Explain Plan
Toad Explain Plan in DBMS_XPLAN mode
Toad can display the current Explain Plan after execution. Toad can also display Explain Plans in DBMS_XPLAN format. There are a few other display options as well. The tree format is more for the novice perhaps.
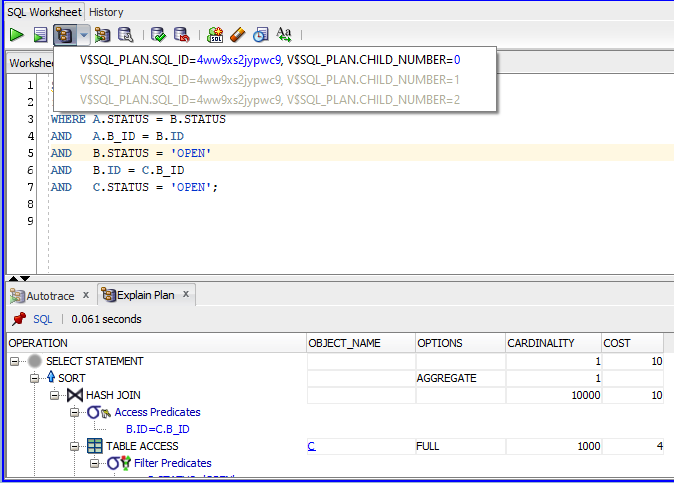
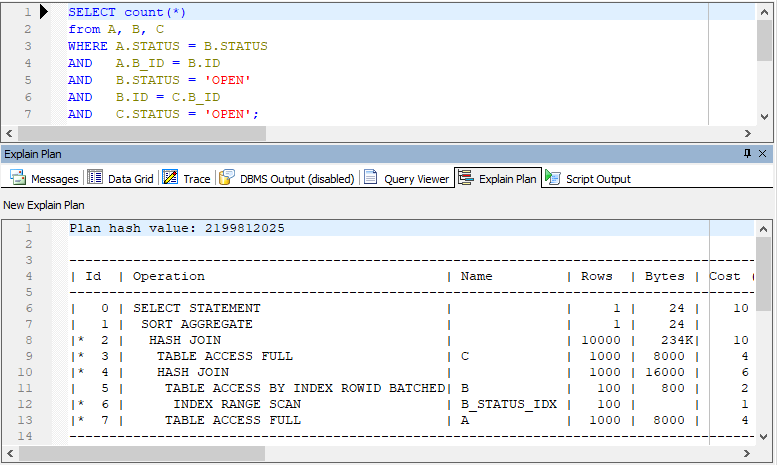
SQL Developer Explain Plans
SQL Developer produces an explain plan and pulls in the outline and some additional information. This is the explain plan that it executed with and you can easily see any additional child cursors.
Toad does quite a bit more with the 10046 trace (pronounced “10 thousand 46”). This is a SQL trace that shows considerably more information about the executed SQL including wait events, time executed, and also the actual explain plan used with actual row counts. Oracle11 enhancements to the SQL trace facility included information from the estimated row (cardinality) from the hard parse. I find SQL trace a valuable tool when performing SQL tuning and I cover this feature in detail in my 2-day SQL Performance Tuning class.
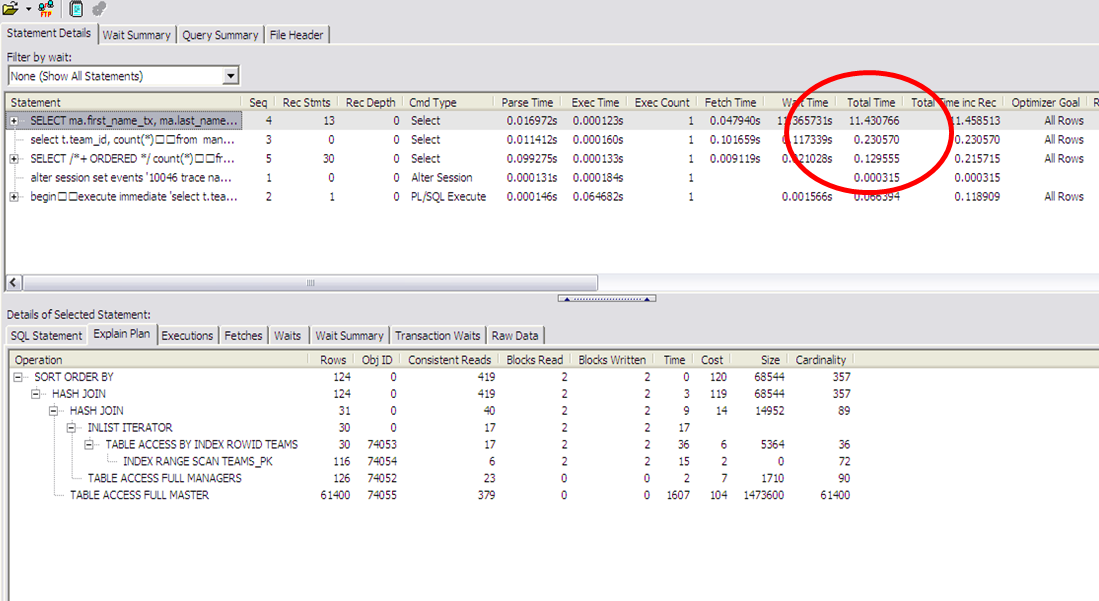
Toad Trace Tab
Both tools display the wait events well but Toad has a great interface to run the SQL trace in an individual SQL statement!
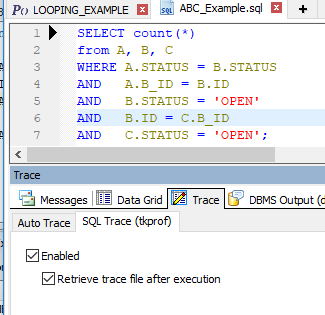
Toad Trace Tab
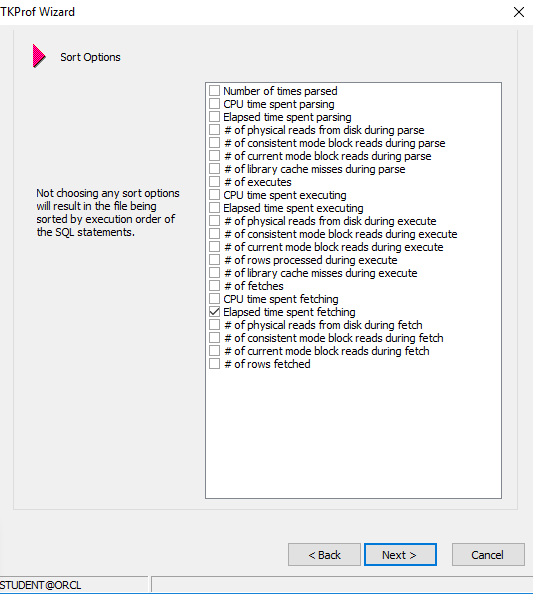
Check these boxes and you don’t even have to know the trace file name, let alone have to go find it down in the Oracle sub directories. Toad will run the trace on your SQL and bring the trace back in the TKProf interface (a great interface for TKProf) or the Trace File Browser (a true gem for interpreting SQL trace files). SQL Developer doesn’t have this ability.
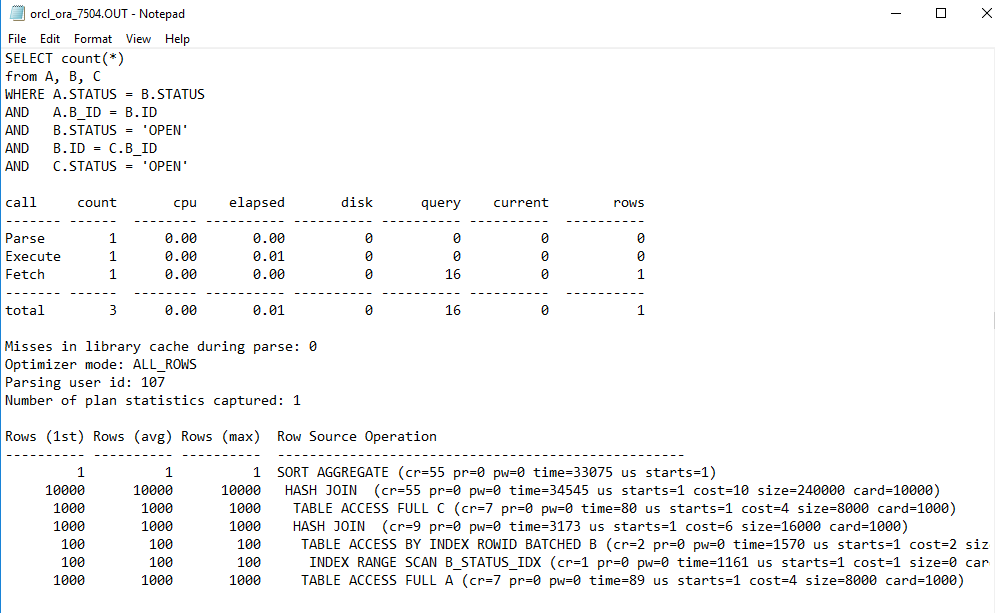
Toad TKProf Interface
This interface has been Toad for a long time. For those of us who work with SQL Trace, this interface sure makes life easy.
SQL Trace Output
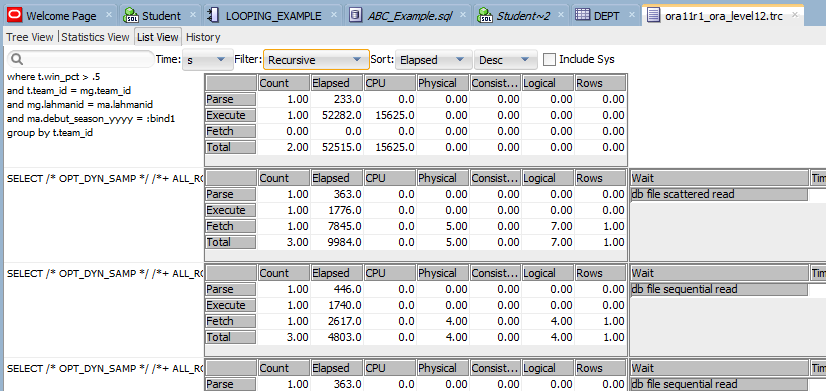
SQL Trace in SQL Developer
SQL Developer has had this interface to the SQL trace for quite a while. It does not need TKProf. You do have to get the trace file to your workstation. The dropdown menus gives you similar sort orders of the SQL by type of statistic. This interface gives you the various useful runtime statistics but it does not give the actual explain plans with their actual row counts. It’s good but not great.
Trace File Browser in Toad
Trace File Browser in Toad
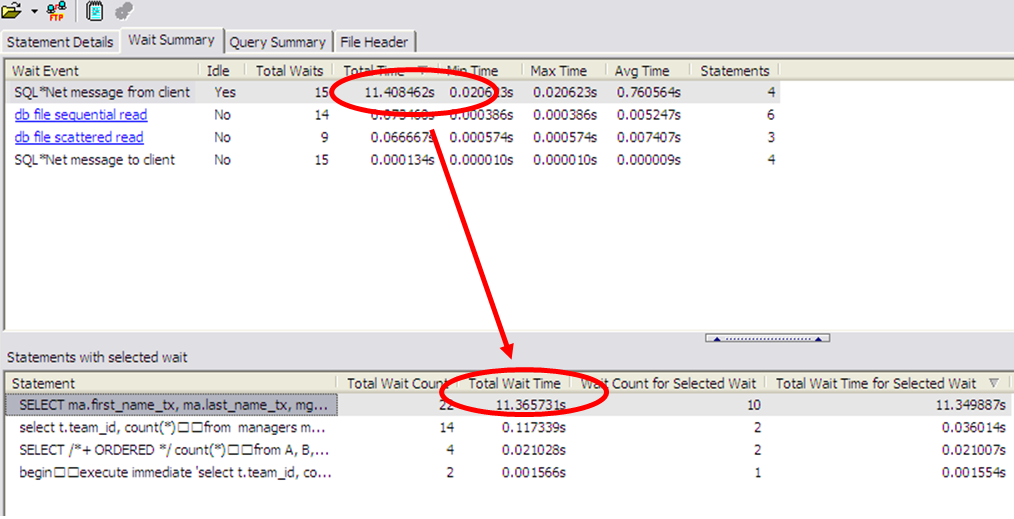
This is a really cool feature only found in Toad. It’s the Trace File Browser. If you are licensed for this, Toad will retrieve your trace file and open it up in this interface instead of the TKProf interface. This feature doesn’t require TKProf. This facility MAY have been my idea! I was explaining to a friend on the Toad Team how it would be nice to have an interface that organized the SQL trace file contents by wait events. This way, you could quickly find the top wait events and go backwards to the offending SQL. The first Trace File image shows statement details, giving similar information to that of the SQL trace output. Go to the next tab over and view the Wait Events! The problem here slaps you in the face. Drill on that wait event with all the time and the bottom of the panel shows the SQL that threw that particular event and the time spent on that event. The problem SQL is that easy to find.
Toad also contains a part of SQL Optimizer, a proactive SQL tuning and advising tool for any single SQL statement. This tool actively reviews your SQL and makes changes and runs the SQL to find the best performing solution. Both Toad and SQL Developer can run the Oracle SQL Tuning Advisor, part of the Oracle RDBMS.
Chapter 10 in my latest book, Toad for Oracle Unleashed, covers Toad as a SQL Tuning tool. Click here to see its table of contents on Amazon.com
Conclusion
There are more differences, such as reports. Both SQL Developer and Toad have quite a number of pre-written reports that display top SQL, Oracle parameters, tablespace information, and more. With SQL Developer, it is rather easy to imbed your own SQL into this report interface. Toad has imbedded a full-featured report writer from DevExpress.
Toad has a master detail record viewer, SQL Developer does not. Both tools have a query builder, but I feel Toad’s is more robust and you can convert the SQL to ANSI joins or regular syntax and appears to do quite a bit more with where clauses, sub queries, and other parts of SQL. SQL Developer’s seems to only do ANSIjoins and the columns for the WHEREclause appear to need to be selected before you can add compares. Being honest, this is my first look at SQL Developer’s query builder and I have used both Toad’s and Toad Data Point’s query builder quite a bit.
Toad has a Code Testing component. This code tester can run and rerun ALL of your tests that you define to it, or, just give it parameters and it generates the tests. This kind of setup makes testing the code again when there has been changes a snap! It’s a full regression testing kind of environment too. Toad allows you to also automate this testing flow so running the testing becomes a snap. Click here to watch a video about using Code Testing.
Toad can do quite a bit of database administration, including creating/working with/and moving the new Oracle12 PDBs to the cloud. Toad has a number of additional database checks, health checks, and other features on its DBA version of Toad.
Toad has an interface to a shared environment called Toad Intelligence Central where your code and reports can be shared with others, executed from there, distributed from there, as well as some controls over groups and who can see what.
Quest has a Toad product for over a half dozen different databases. Toad has various flavors at various costs. SQL Developer is for the Oracle database and is free from Oracle Corp. SQL Developer has interfaces to many of its various database types such as TimesTen and APEX.
I hope you find this information helpful when working with these tools.
Start the discussion at forums.toadworld.com