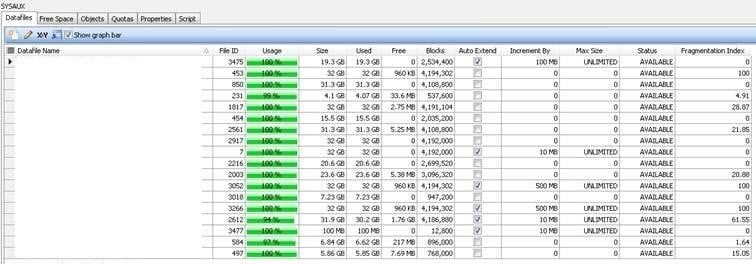
If you find that SYSAUX is growing and its size is too big, besides figuring out why this has happened (bug, some purge job disabled, or some structure problems in objects), you need to find the objects and purge them manually.
The cause of the problem
Two components of Server Manageability (SM) that reside in the SYSAUX tablespaces can cause this problem. The components involved are the Automatic Workload Repository (AWR) and Optimizer Statistics History (OPTSTAT). Both of these components have retention periods associated with their data, and the MMON process should run nightly, as part of the scheduled maintenance tasks, to purge data that exceeds these retention periods. From version 11G onwards, the MMON purging process has been constrained to a time-limited window for each of the purges; if this window is exceeded, then the purging stops and an ORA-12751 error is written to an m000 trace file.
For the AWR data, held in tables with names commencing with WRH$, the probable cause is that a number of the tables are partitioned. New partitions are created for these tables as part of the MMON process. Unfortunately, it seems that the partition-splitting process is the final task in the purge process. As the later partitions are not split, they end up containing more data. This results in partition pruning within the purge process, making it less effective.
The second component in the AWR data is the WRM$ tables, which are actually metadata, and, in my praxis, even if they’re big, they are easily fixable directly by Oracle…of course, that is when their child WRH$ tables data have previously been fixed.
For the OPTSTAT data, held in tables with names commencing with WRI$, the problem is also more likely to be related to the volume of data held in the tables. WRI$ tables hold historical statistical data for all segments in the database for as long as specified by the stats history retention period. Thus, if the database contains a large number of tables with a long retention period – say 30 days – then the purge process will have issues trying to purge all of the old statistics within the specified window.

Analyzing the problem
One way to analyze the problem is to use the original Oracle script. For this approach you must have access to the DB server—which is not always possible.
@?/rdbms/admin/awrinfo
Also, this is a fixed script, and not so easy to modify without a deeper understanding of what the script does (if you need to adapt it to your needs).
So, I would use a different approach – a small, modified script:
break on report
compute sum OF MB on report

select occupant_desc, space_usage_kbytes/1024 MB
from v$sysaux_occupants
where space_usage_kbytes > 0
order by space_usage_kbytes;
The result is:
OCCUPANT_DESC MBServer Manageability – Automatic Workload Repository 361,724
--------------------------------------------------------------- ----------
Automated Maintenance Tasks 0
Oracle Streams 1
Logical Standby 1
OLAP API History Tables 1
Analytical Workspace Object Table 1
PL/SQL Identifier Collection 2
Transaction Layer - SCN to TIME mapping 3
Unified Job Scheduler 11
LogMiner 12
Server Manageability - Other Components 16
Server Manageability - Advisor Framework 304
SQL Management Base Schema 10,113
Server Manageability - Optimizer Statistics History 14,179
                                                                 ----------
sum                                                                 386,369
With this easy script you focus directly on where to search for solutions. However, another simple, “top 10 SYS objects by size” script can show you more details on the object level:
col MB for 999G990
col blocks for 9999999999
col segment_name for a30
col partition_name for a30
col segment_type for a20
col tablespace_name for a20
select * from (
               select bytes/1024/1024 MB, blocks, s.SEGMENT_NAME, s.partition_name, s.segment_type, s.tablespace_name
                 from dba_segments s
                where owner='SYS'
             order by bytes desc
)
where rownum <=10
;

      MB      BLOCKS SEGMENT_NAME                   PARTITION_NAME                 SEGMENT_TYPE         Tablespace
-------- ----------- ------------------------------ ------------------------------ -------------------- --------------------
  81,111    10382208 SYS_LOB0001310633C00038$                                     LOBSEGMENT           SYSAUX
  80,720    10332160 SYS_LOB0001310627C00004$                                     LOBSEGMENT           SYSAUX
  77,555     9927080 WRH$_SQL_PLAN                                                 TABLE                SYSAUX
  28,018     3586304 WRH$_SQL_PLAN_PK                                              INDEX                SYSAUX
  21,642     2770176 WRH$_ACTIVE_SESSION_HISTORY    WRH$_ACTIVE_928736751_188739   TABLE PARTITION      SYSAUX
  16,090     2059520 WRH$_FILESTATXS                WRH$_FILEST_928736751_188739   TABLE PARTITION      SYSAUX
   7,950     1017600 SYS_LOB0005791561C00005$                                     LOBSEGMENT           SYSAUX
   7,734      989952 WRH$_SQLSTAT                   WRH$_SQLSTA_928736751_188739   TABLE PARTITION      SYSAUX
   6,361      814208 WRH$_FILESTATXS_PK             WRH$_FILEST_928736751_188739   INDEX PARTITION      SYSAUX
   3,779      483712 WRH$_EVENT_HISTOGRAM_PK        WRH$_EVENT__928736751_188739   INDEX PARTITION      SYSAUX
--------
 330,960
The first four segments are 268,404GB, which is 81.1% of first top 10segments and 69.47% of the whole SYSAUX.
So, concentrate on just them to start out with.
For the first two LOB segments from the top of the previous result, we need to get the tables that own those LOBs:
select OWNER,TABLE_NAME from dba_lobs where SEGMENT_NAME IN ('SYS_LOB0001310633C00038$ ','SYS_LOB0001310627C00004$');

OWNER                          TABLE_NAME
------------------------------ ------------------------------
SYS                            WRH$_SQLTEXT
SYS                            WRH$_SQL_PLAN
Let us focus on the first table, WRH$_SQLTEXT.
Check the table’s total number of records:
select /*+ FULL (t) PARALLEL (t, 8) */ count(*) from  sys.WRH$_SQLTEXT t;

  COUNT(*)
----------
 5.574.297
So, not too many records, but the LOBs are occupying a huge amount of space, which is expected.
But the question is, how many of that table’s records might be fully obsolete (not needed), such that we can remove them?
For this table, we need to find the latest possible snap_id (this is the connection with a timestamp).
Let us say, find the first snap_id before 35 days from today. To get that information, run the next query:
select max(snap_id) from dba_hist_snapshot where BEGIN_INTERVAL_TIME >= SYSDATE -35;

MAX(SNAP_ID)
------------
      259459
So everything below the snap_id=259459 is obsolete data and should be removed.
(Please be aware that “should” does not actually indicate that those data “can” be removed!)
Now let us see how many records are below that snap_id in table sys.
WRH$_SQLTEXT:
select /*+ FULL (t) PARALLEL(t, 4) */ count(*) from  sys.WRH$_SQLTEXT t where snap_id < 259459;

  COUNT(*)
----------
 5.572.096
So 5,572,096 records from a total of 5,574,297 are obsolete (99.96%). That is really too much. And this is why we have to check all the totals and the number of records that are actually needed.
A quick check of ASH (wrh$_active_session_history table):
SELECT SYSDATE - a.sample_time ash_days, SYSDATE - s.begin_interval_time snap_days, c.RETENTION740
FROM sys.wrm$_wr_control c,
( SELECT /*+ PARALLEL(w, 4) */
db.dbid, MIN (w.sample_time) sample_time
FROM sys.v_$database db, sys.rh$_active_session_history w
WHERE w.dbid = db.dbid
GROUP BY db.dbid) a,
( SELECT /*+ PARALLEL(w, 4) */
db.dbid, MIN (r.begin_interval_time) begin_interval_time
FROM sys.v_$database db, sys.wrm$_snapshot r
WHERE r.dbid = db.dbid
GROUP BY db.dbid) s
WHERE a.dbid = s.dbid AND c.dbid = a.dbid;
ASH_DAYS SNAP_DAYS RETENTION
--------------------------- ----------------------- -----------------
+0000000
06:28:10.536000 +000003572
20:11:28.945 +30 00:00:00.000000
The ASH “tables” data has 740days of history and the main parent table sys.wrm$_snapshot has even more, 3572days…Obviously, those two data are totally disproportionate.
So, it looks like we need to expand our focus beyond those few objects from the first top 10 list.
And this is why delete action in any way is not a good way in such heavy damaged environments.
For analysis always use real tables, not views
A major tip is to always use core objects and not parent “DBA” based views. For example,
DBA_HIST_SNAPSHOT:WHERE status = 0
CREATE OR REPLACE FORCE VIEW SYS.DBA_HIST_SNAPSHOT (
SNAP_ID,DBID,INSTANCE_NUMBER,STARTUP_TIME,BEGIN_INTERVAL_TIME,END_INTERVAL_TIME,FLUSH_ELAPSED,SNAP_LEVEL,ERROR_COUNT,SNAP_FLAG,SNAP_TIMEZONE)
AS
SELECT
snap_id,dbid,instance_number,startup_time,begin_interval_time,end_interval_time,flush_elapsed,snap_level,error_count,snap_flag,snap_timezone
FROM WRM$_SNAPSHOT
And this is why you might get misleading results.
Purge by ‘delete’
There are many articles on how manually purge AWR records. So I will not cover this topic, other than to point out that the number of deleted records is important when you decide to use this technique. In my case this was not possible.
Check what Oracle does (purging by ‘delete’)
The default Oracle method of purging data is to run a dedicated procedure.
exec DBMS_WORKLOAD_REPOSITORY.DROP_SNAPSHOT_RANGE(low_snap_id =>xxxx,high_snap_id =>zzzz);
where you indicate a range of xxxx and zzzz, which you easily can retrieve by query:
select min(snap_id),max(snap_id) from sys.WRM$_SNAPSHOT where begin_interval_time< to_date('xx.yy.201z','dd.mm.YYYY');
…putting those values for the filter (whatever they are in your case).
If you check the ASH of such a session, you will see something like:
IID    AAS SQL_ID           CNT     PCT Object (Sub Object) Type Event                              tablespace and file#
--- ------ ------------- ------ ------- ------------------- ---- ----------------------------- -------------------------
  1   0.00 fqq01wmb4hgt8      3    2.50 KOTTD
nbsp;             T    ON CPU.....................   SYSAUX               497
                              3    2.50 KOTTD
nbsp;             T    db file sequential read....   SYSAUX               454
                              5    4.17 KOTTD
nbsp;             T    ON CPU.....................   SYSAUX               454
                              6    5.00 KOTTD
nbsp;             T    db file sequential read....   SYSAUX               453
                              6    5.00 KOTTD
nbsp;             T    ON CPU.....................   SYSAUX               453
                              6    5.00 KOTTD
nbsp;             T    ON CPU.....................   SYSAUX              1817
                              7    5.83 KOTTD
nbsp;             T    db file sequential read....   SYSAUX              2561
                              7    5.83 KOTTD
nbsp;             T    db file sequential read....   SYSAUX              2917
                              8    6.67 KOTTD
nbsp;             T    db file sequential read....   SYSAUX              1817
                              8    6.67 KOTTD
nbsp;             T    db file sequential read....   SYSAUX              2003
                              9    7.50 KOTTD
nbsp;             T    ON CPU.....................   SYSAUX              2216
                              9    7.50 KOTTD
nbsp;             T    ON CPU.....................   SYSAUX              2003
                             10    8.33 KOTTD
nbsp;             T    ON CPU.....................   SYSAUX              2561
                             13   10.83 KOTTD
nbsp;             T    db file sequential read....   SYSAUX              2216
                             20   16.67 KOTTD
nbsp; T ON CPU..................... SYSAUX 2917
And when you look in “fqq01wmb4hgt8” sql_id, you see (showing the formatted version):
DELETE FROM WRH$_FILESTATXS tab
      WHERE     (:beg_snap <= tab.snap_id AND tab.snap_id <= :end_snap AND dbid = :dbid)
            AND NOT EXISTS
                  (SELECT 1
                     FROM WRM$_BASELINE b
                    WHERE (tab.dbid = b.dbid)
                      AND (tab.snap_id >= b.start_snap_id)
                      AND (tab.snap_id <= b.end_snap_id))
Where the plan for that sql_id looks fantastic:
Plan hash value: 3361514849
------------------------------------------------------------------------------------------------------
| Id  | Operation                      | Name               | E-Rows |E-Bytes| Cost  | Pstart| Pstop |
------------------------------------------------------------------------------------------------------
|   0 | DELETE STATEMENT               |                    |    558K|    17M|    39 |       |       |
|   1 |  DELETE                        | WRH$_FILESTATXS    |        |       |       |       |       |
|*  2 |   FILTER                       |                    |        |       |       |       |       |
|*  3 |    HASH JOIN RIGHT ANTI        |                    |    558K|    17M|    39 |       |       |
|*  4 |     TABLE ACCESS BY INDEX ROWID| WRM$_BASELINE      |      1 |    13 |     1 |       |       |
|*  5 |      INDEX RANGE SCAN          | WRM$_BASELINE_PK   |      2 |       |     1 |       |       |
|   6 |     PARTITION RANGE ITERATOR   |                    |    558K|    10M|    36 |   KEY |   KEY |
|*  7 |      INDEX RANGE SCAN          | WRH$_FILESTATXS_PK |    558K|    10M|    36 |   KEY |   KEY |
------------------------------------------------------------------------------------------------------
But, a plan is one thing (which depends on DB parameters as well having updated dictionary statistics) and real life is another: This object has a 16,090MB segment size (from the previous report) and if you want to check the actual number of records (I did look in table stat) – I get 225M records.
So besides the plan being wrong (especially for bigger tables), deleting so many records from this table would take too much time. Last but not least, this is just the first of more than 115 tables involved in the purge process.
The bottom line: This way of manipulating the purge is the main reason why 99.9% of scheduled purge jobs fail and why manual work is necessary.
Regardless of whether you define a small snap_id period, this procedure cannot finish successfully in the amount of time supposed to, because of the huge amount of data and time to process. And this is exactly why scheduled jobs cannot finished, so it fails.
And even if it succeeded, you would still have problems with the segment size, which remains the same regardless of the number of records deleted. So you still have a lot of manual work to do.
If you do not want to query ASH and collect SQLs, the easiest and the best way is to trace the session.
Trace part
To be able to reproduce what Oracle does exactly, the easiest way is to trace the Oracle session.
You can do that with the script trace_purge_session, while the log of the action is in the trace_purge_session.LST file.
This trace will reproduce the DBNAME_ora_xxxx_ADBA_AWR_PURGE_20170831_162914.trc file.
DBNAME and xxxx are custom values which depend on your database, while “20170831_162914” represents the date and time when you run the trace file, so it will be different in every case.
Using the Toad Trace File browser, a nice feature from Toad (or TKPROF), you can easily extract SQLs from the traced session, and this is the content of the traced_statements_to_analyze.sql file.
If you do not have a small database with same Oracle version that can run your trace session, another way is to truncate tables on a database that can do it. The script for that is truncate.sql.
By truncating the tables, your traced session will execute very quickly; in my case it took about six minutes. The end result is irrelevant because we want to retrieve only statements that Oracle is using in as fast a way as possible.
Truncate scripts
So now, when we have a list of delete statements, for each table we need to create fix scripts that will be composed of truncate and insert statements.
The whole process for each script may be described as:
- Create WRH$_X_2 table with content that needs to be saved
- Truncate original WRH$_X table
- Return records from WRH$_X_2 table to WRH$_X.
And, as you see in my case, I did that for all 115 tables from the traced_statements_to_analyze.sql file.
Each script has a name like: xxx-WRH$_TABLE_NAME_FIX.sql, so for instance, 001-WRH$_SQLTEXT_FIX.sql, 019-WRH$_LATCH_FIX.sql… With the number at the beginning I ensured that they all can be executed in the way that Oracle is executing the delete statements (gotten from the trace file). The order is always important and, with this naming method, easily preserved.
All these scripts are placed in a zip file execute_scripts.zip. Extract them in the same directory where master.sql is placed.
In each of those generated 115 files, at the top of the file you may find something like:
--sys.wrh$_sql_plan

--total  : 464.939.836

--usefull:  13.367.438
…which shows you how many records there are now and how many of them are really needed. Retrieving the data was tedious but an important part of the work.
So, in my case, I have 64 actual purge scripts, while the other 51 are either empty (had no records in my case) or were WRM$ tables, which I didn’t wanted to touch manually.
Each script has an error handling part and will terminate complete execution if any unexpected error occurs. This effect is produced by using the WHENEVER SQLERRROR command, which ensures that all important parts of the script run without any error and in case of error will stop further execution, as stated before.
If an error does occur (which has not happened to me in several runs on three different databases), execution is stopped so you will need to run that script run again manually from the point at which it stopped after analyzing the error and fixing the problem.
All commands that come after the detected errors can be then run as if nothing had happened.
The beauty of these scripts is that they can run 100% online on any production system with little overhead, allowing new AWR data to be inserted at the same time. This is achieved with looping and sequentially processing record by record, while allowing the WHEN DUP_VAL_ON_INDEX exception to be silently ignored.
In each script source, you can find a looping commit, which may put some pressure on the log file sync, but this is nothing that can’t be allowed for one-time execution. The looping commits prevent deadlock; if there was no loop commit, with AWR actively saving records at the same time you were executing a script deadlock would occur 100%of the time (ORA-00060: deadlock detected while waiting for resource).
In the scripts I use a /*+ PARALLEL(t, 4) */ hint for saving data in a replica table; you can adapt that (lowered or raised) to your needs, but keep in mind to have the best execution plan possible in that execution part.
In all the scripts, change “SOME_TABLESPACE” to your real tablespace name. This tablespace will temporary hold the data, but do not use SYSAUX for that.
The easiest way to generate purge fix scripts is to copy a previous one and then with search/replace change the WRH$ table name to a new one. For a template you may use the “113-WRH$_MVPARAMETER_FIX.sql” file. (included with execute_scripts.zip)
Putting all calls in one place is done through the master.sql script, which is a wrapper for all those calls as well as some post-purge calls (directly put in master.sql). This is done by the code:
PROMPT Post purge tasks …
select dbms_stats.get_stats_history_retention from dual;

select dbms_stats.get_stats_history_availability from dual;

column a_snap_id new_value v_snap_id
select min(snap_id) a_snap_id from sys.WRM$_SNAPSHOT where begin_interval_time>=(trunc(sysdate)-30);
select &&v_snap_id snap_id from dual;

COL a_dbid new_value v_dbid;
SELECT TO_CHAR(dbid) a_dbid FROM gv$database where inst_id=1;
select &&v_dbid dbid from dual;

exec dbms_workload_repository.drop_snapshot_range(low_snap_id => 1, high_snap_id=>&&v_snap_id);
select dbms_stats.get_stats_history_availability from dual;
exec dbms_stats.purge_stats(sysdate-30);
select dbms_stats.get_stats_history_availability from dual;
exec dbms_stats.gather_table_stats('SYS','WRM$_DATABASE_INSTANCE');
exec dbms_stats.gather_table_stats('SYS','WRM$_SNAPSHOT');
exec dbms_stats.gather_table_stats('SYS','WRM$_SNAPSHOT_DETAILS');
…which is important to run at the end. And this part fixes WRM$ tables, directly by Oracle!
The log of the execute action is in the master.lst file.
I will show just the end of the script:
17:06:34 SQL>exec dbms_stats.gather_table_stats('SYS','WRH$_TABLESPACE'); --last fix statement of last script

PL/SQL procedure successfully completed.

Elapsed: 00:00:00.23
17:06:34 SQL>
17:06:34 SQL>
17:06:34 SQL>PROMPT Post purge tasks ...
Post purge tasks ...
17:06:34 SQL>select dbms_stats.get_stats_history_retention from dual;

GET_STATS_HISTORY_RETENTION
---------------------------
                         31

Elapsed: 00:00:00.41
17:06:34 SQL>
17:06:34 SQL>select dbms_stats.get_stats_history_availability from dual;

GET_STATS_HISTORY_AVAILABILITY
---------------------------------------------------------------------------
12-MAY-15 12.57.04.400279000 AM +02:00

Elapsed: 00:00:00.02
17:06:34 SQL>
17:06:34 SQL>column a_snap_id new_value v_snap_id
17:06:34 SQL>select min(snap_id) a_snap_id from sys.WRM$_SNAPSHOT where begin_interval_time>=(trunc(sysdate)-30);

 A_SNAP_ID
----------
    259129

Elapsed: 00:00:00.04
17:06:34 SQL>select &&v_snap_id snap_id from dual;

   SNAP_ID
----------
    259129

Elapsed: 00:00:00.01
17:06:34 SQL>
17:06:34 SQL>COL a_dbid new_value v_dbid;
17:06:34 SQL>SELECT TO_CHAR(dbid) a_dbid FROM gv$database where inst_id=1;

A_DBID
----------------------------------------
928736751

Elapsed: 00:00:00.02
17:06:35 SQL>select &&v_dbid dbid from dual;

      DBID
----------
 928736751

Elapsed: 00:00:00.02
17:06:35 SQL>
17:06:35 SQL>exec dbms_workload_repository.drop_snapshot_range(low_snap_id => 1, high_snap_id=>&&v_snap_id);

PL/SQL procedure successfully completed.

Elapsed: 00:09:31.26
17:16:06 SQL>
17:16:06 SQL>select dbms_stats.get_stats_history_availability from dual;

GET_STATS_HISTORY_AVAILABILITY
---------------------------------------------------------------------------
24-AUG-17 12.57.04.400279000 AM +02:00

Elapsed: 00:00:00.02
17:16:06 SQL>
17:16:06 SQL>exec dbms_stats.purge_stats(sysdate-31);

PL/SQL procedure successfully completed.

Elapsed: 00:04:37.31
17:20:43 SQL>
17:20:43 SQL>select dbms_stats.get_stats_history_availability from dual;

GET_STATS_HISTORY_AVAILABILITY
---------------------------------------------------------------------------
24-AUG-17 05.16.06.000000000 PM +02:00

Elapsed: 00:00:00.02
17:20:43 SQL>
17:20:43 SQL>exec dbms_stats.gather_table_stats('SYS','WRM$_DATABASE_INSTANCE');

PL/SQL procedure successfully completed.

Elapsed: 00:00:00.51
17:20:44 SQL>
17:20:44 SQL>exec dbms_stats.gather_table_stats('SYS','WRM$_SNAPSHOT');

PL/SQL procedure successfully completed.

Elapsed: 00:00:01.04
17:20:45 SQL>
17:20:45 SQL>exec dbms_stats.gather_table_stats('SYS','WRM$_SNAPSHOT_DETAILS');

PL/SQL procedure successfully completed.

Elapsed: 00:00:12.85
17:20:58 SQL>
As you can see, in my case the whole action lasted around 10 hours. This depends on the size of your data as well as the speed of your database.
The whole master script can be run multiple times as a whole execution (all 115 scripts), but not in parallel. Ideally the start of script would be after the Oracle automation purge job finish
Final checking
After I run this on my DB, the situation with the SYSAUX occupants was as follows:
OCCUPANT_DESC MBServer Manageability – Automatic Workload Repository 13,738
---------------------------------------------------------------- ----------
Automated Maintenance Tasks 0
Oracle Streams 1
Logical Standby 1
OLAP API History Tables 1
Analytical Workspace Object Table 1
PL/SQL Identifier Collection 2
Transaction Layer - SCN to TIME mapping 3
Unified Job Scheduler 11
LogMiner 12
Server Manageability - Other Components 16
Server Manageability - Advisor Framework 304
SQL Management Base Schema 10,113
Server Manageability - Optimizer Statistics History                  14,179
                                                                 ----------
sum                                                                  38,384
From 370GBthe space used dropped to 13.7GB, which is 3.70%of the remaining space.
Graphically it looks like this (before and after the purge):
Talking in number of records (before and after):
|
1,176,879,395 records |
44,627,169 records |
Which is3.8% of the remaining records!
Imagine what the overhead on the database would be to delete 1.1 billion records in a classic delete action. The horror!
As you see, 269,394MB of space has been recovered and returned to the system.
Purge job
After all is done and fixed, check that the purge job is present and enabled. If it is not, you can create it with a simple script, which is necessary to ensure the purging of data automatically:
BEGIN
sys.dbms_scheduler.create_job(
job_name => '"SYS"."PURGE_OPTIMIZER_STATS"',
job_type => 'PLSQL_BLOCK',
job_action => 'begin
dbms_stats.purge_stats(sysdate-3);
end;',
repeat_interval => 'FREQ=DAILY;BYHOUR=6;BYMINUTE=0;BYSECOND=0',
start_date => systimestamp at time zone 'Europe/Paris',
job_class => '"DEFAULT_JOB_CLASS"',
comments => 'job to purge old optimizer stats',
auto_drop => FALSE,
enabled => TRUE);
END;
Last but not least
I must admit that in my purge solution, there is a place where some new AWR data will not be saved for short time. If you look in the code:
create table WRH$_RSRC_PLAN_2 tablespace SOME_TABLESPACE as (
   SELECT
          *
     FROM sys.WRH$_RSRC_PLAN tab
    WHERE    (tab.dbid = &&v_dbid AND tab.snap_id >= &&v_snap_id)
          OR EXISTS
               (SELECT 1
                  FROM sys.wrm$_baseline b
                 WHERE b.dbid = &&v_dbid AND tab.snap_id >= b.start_snap_id AND tab.snap_id <= b.end_snap_id))
;
truncate table sys.WRH$_RSRC_PLAN drop storage;
select /*+ PARALLEL(t, 4) */ count(*) from WRH$_RSRC_PLAN_2 t ;
So, from the moment when the script starts to create the WRH$_2 replica table and the time when it truncate original one, all new inserted records in original table will be lost with the truncate. This is not a problem from my point of view, because this is not so long and all other data are still inserting (in other WRH$ tables), and if something small is missing…in AWR that might not be such a big problem – it will be purged in 30 days.
To be 100% sure that there will be no AWR activity in the database while you perform maintenance, Oracle suggests doing maintenance with the database opened in restricted mode, and then after maintenance returning the DB to the normal opened state:
shutdown immediate;
startup restrict;
   master.sql;
shutdown immediate;
startup;
But this is general advice and IMHO more oriented to segments that have child/parent records, which was not the case here.
Another tip is to stop AWR (the database can be online–no need to restart it), but this is not really necessary either, in my opinion.
Don’t touch any partitions, regardless of whether or not they are empty, because Oracle will drop them (if needed) by itself.
So, the general approach for any environment that cannot be handled normally with the Oracle purge call is:
- trace the Oracle purge job
- create scripts in order from the trace results (avoiding WRM$ tables)
- use truncate in scripts while preserving records that are needed (period and baselines)
- run all the scripts sequentially as sys user
- enable or start the Oracle automation purge job, which should fix the remaining unfixed records
If you have questions or enhancements to this discussion, I’m open for talk at any time.
Doc references
How to Purge WRH$_SQL_PLAN Table in AWR Repository, Occupying Large Space in SYSAUX Tablespace. (Doc ID 1478615.1)
High Storage Consumption for LOBs in SYSAUX Tablespace (Doc ID 396502.1)
Hope this helps someone.
Cheers!
Damir Vadas
Most Fortune 500 companies choose ToadTool for Oracle Application Developers, more widely known as Toad®, was designed by Oracle developer, Jim McDaniel, to make his job easier. It was so helpful that Jim decided to share it. Fast forward to more than 20 years later, Toad is a trusted tool used in most Fortune 500 companies and across the globe. There are many reasons why people buy Toad rather than staying with the “free” SQL Developer tool Oracle offers. One main reason developers and DBAs choose Toad for Oracle is to reduce time and effort to develop and manage Oracle databases. But did you know that with Toad for Oracle you can automate administration tasks and proactively manage your databases while embracing performance optimization and risk mitigation? Did you know Toad can now find and control sensitive data across all your Oracle databases? What else can Toad do that you didn’t know about? Which edition will benefit you the most? We’re so confident that you will love Toad, we’re offering our top 2 editions to you to try for free for 30 days. 
|
Start the discussion at forums.toadworld.com