Introduction
In an earlier article we discussed using Oracle Database instance on AWS RDS from Toad Data Point. We discussed establishing a connection with Oracle Database and creating a database table. Toad Data Point provides additional features for database data than just connecting and creating a database table. In this article we shall discuss creating different types of reports (CSV, Excel Spreadsheet, and PDF) from database data using Toad Data Point.
This article has the following sections.
- Setting the Environment
- Using the Toad Report Wizard
- Using the Import/Export Wizard to export to CSV File
- Exporting Data Report to a PDF File
- Adding a Watermark to a Data Report
- Exporting Query Result to an Excel Spreadsheet
Setting the Environment
The prerequisites are the same as for the earlier article.
Create an Amazon Web Services account at https://aws.amazon.com/resources/create-account/.
Download and install Toad Data Point from https://www.quest.com/products/toad-data-point/.
Using the Toad Report Wizard
Toad Data Point provides the Toad Report Wizard for generating reports from database data. To launch the Toad Report Wizard, right-click on the database table from which a report is to be generated in the Object Explorer>Tables and select Data Reports as shown in Figure 1.
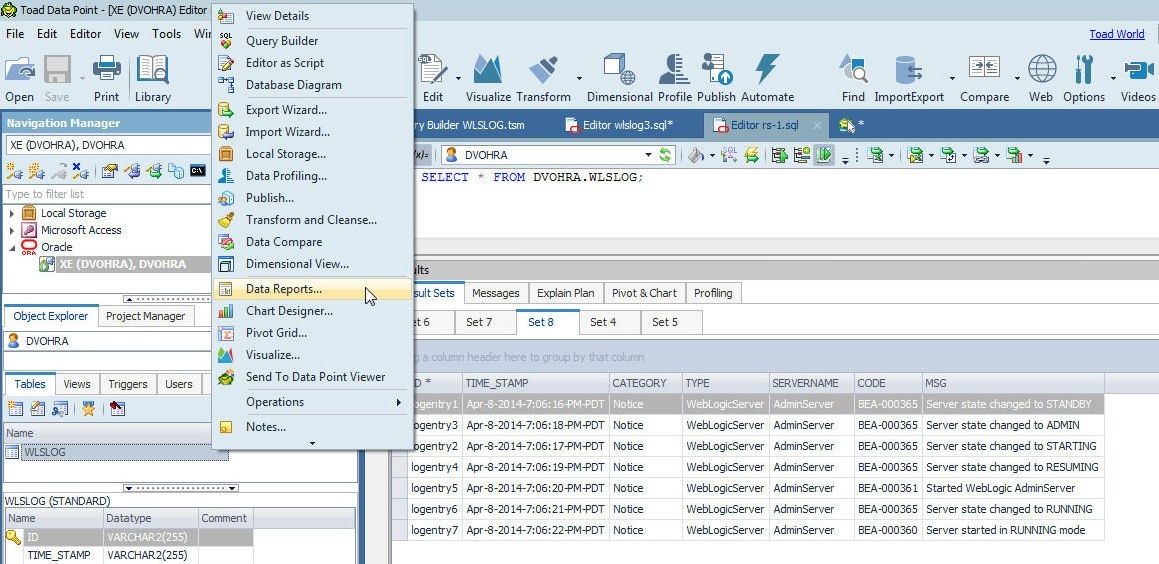
Figure 1. Selecting Data Reports
The Toad Data Report Wizard gets launched. Choose report type as Standard Report and click on Next as shown in Figure 2.
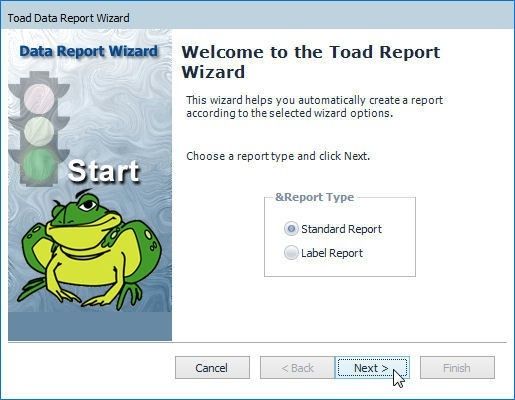
Figure 2. Toad Data Report Wizard
Next, choose columns to display in the report from the Available Fields. Columns may be selected one at a time as shown in Figure 3.
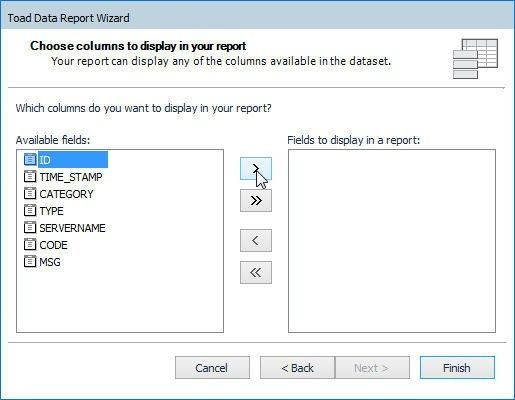
Figure 3. Selecting Columns to Display in a Report
All columns may be selected, as shown in Figure 4.
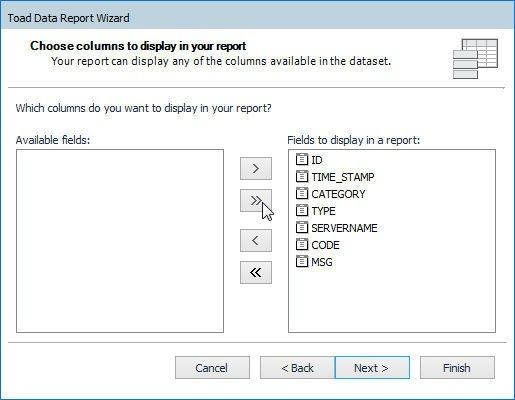
Figure 4. Selecting All Columns
Click on Next as shown in Figure 5.
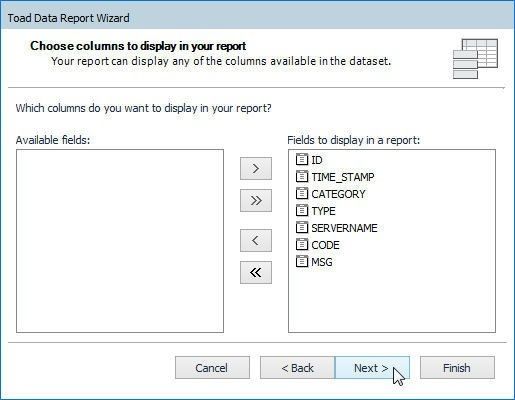
Figure 5. Next
Add any grouping levels. Select the default grouping levels and click on Next as shown in Figure 6.
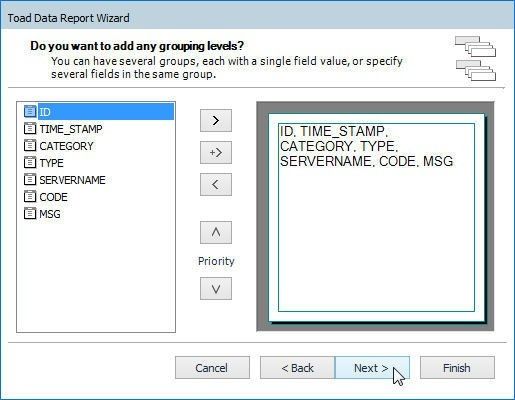
Figure 6. Adding Grouping Levels
Select Layout (Columnar by default) and Orientation (Portrait by default) for the report as shown in Figure 7. Tick the checkbox Adjust the field width so all fields fit on page. Click on Next.
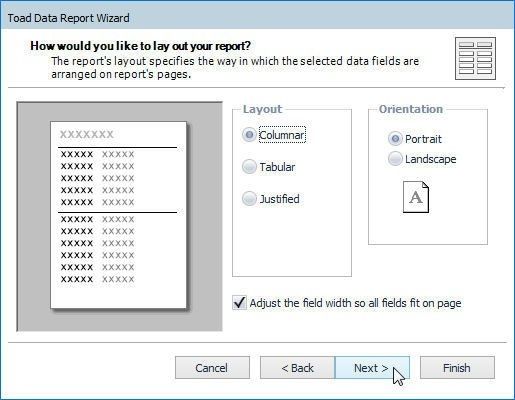
Figure 7. Selecting Report Layout and Orientation
Select a style from Styles (Bold is default) and click on Next as shown in Figure 8.
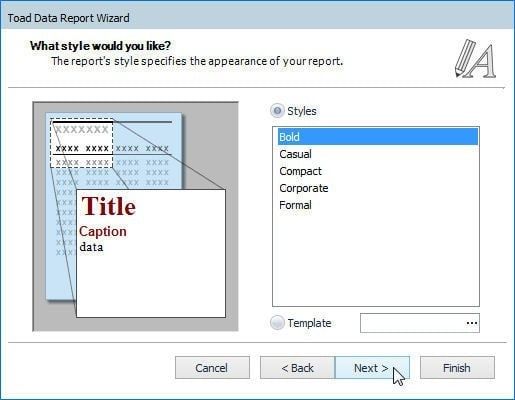
Figure 8. Selecting a Style
Specify a Report Title and click on Finish as shown in Figure 9.
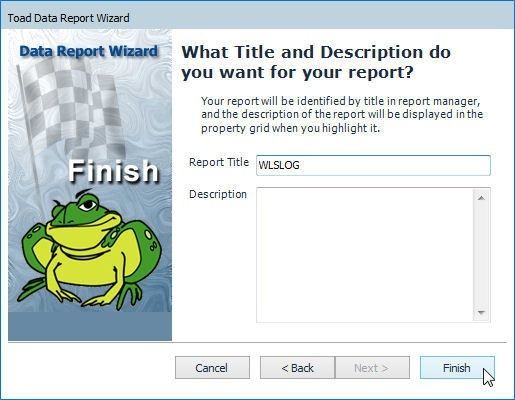
Figure 9. Specifying a Report Title
The report template gets created as shown in Figure 10.
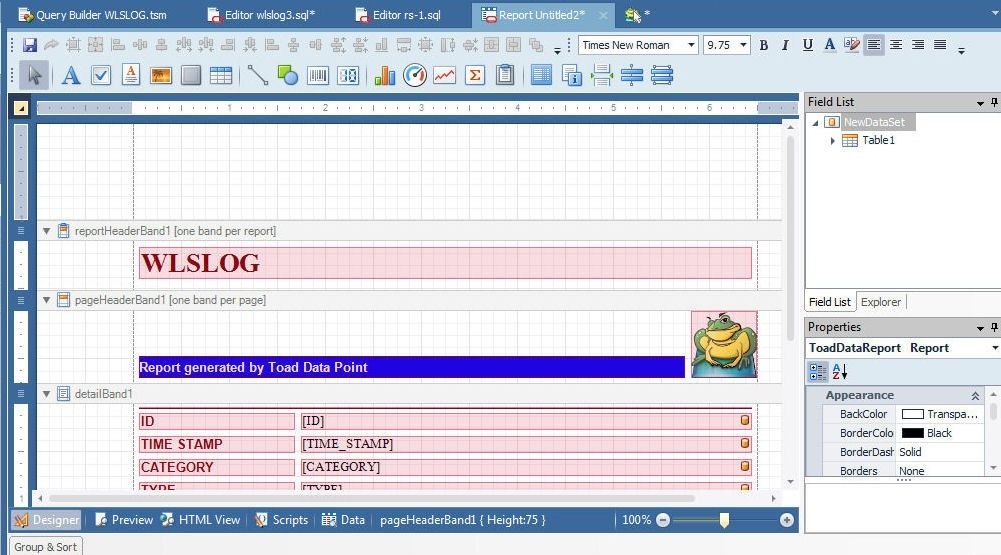
Figure 10. Report Template
The Designer tab is selected by default. To preview the report click on the Preview tab and the report preview gets displayed, as shown in Figure 11.
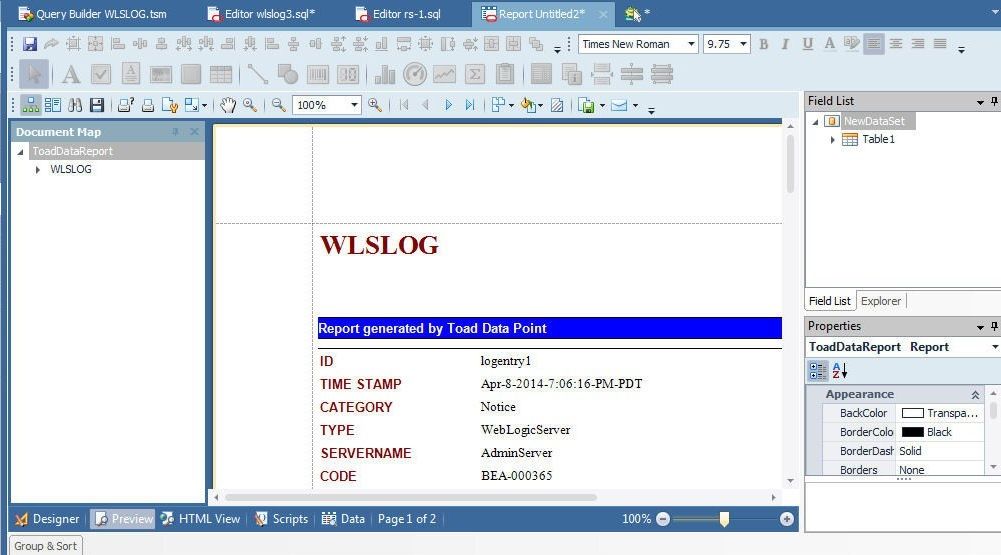
Figure 11. Report Preview
A report section is created for each row of data in the database table, as shown in Figure 12.
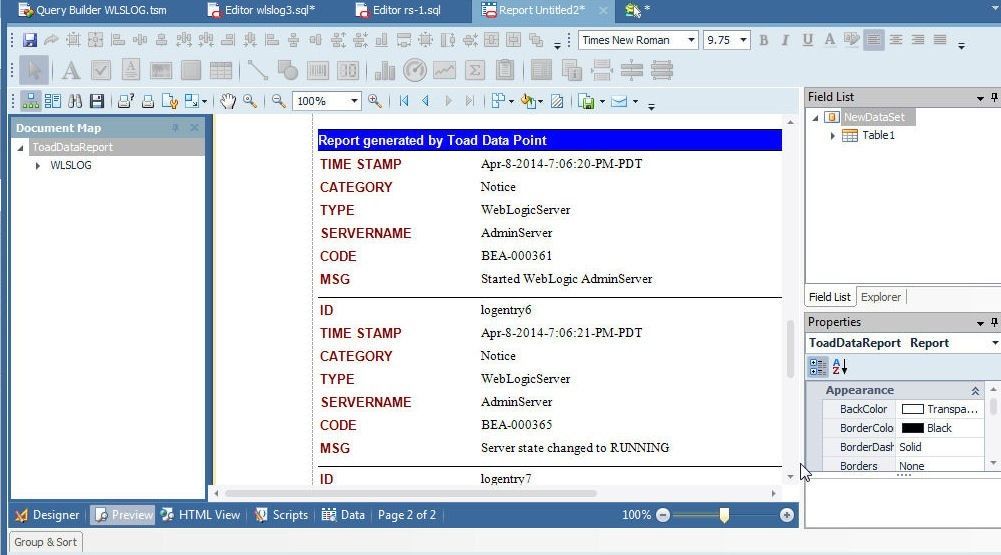
Figure 12. Report Sections
Click on the WLSLOG in the margin to list the report pages, as shown in Figure 13. Page 1 and Page 2 get listed.
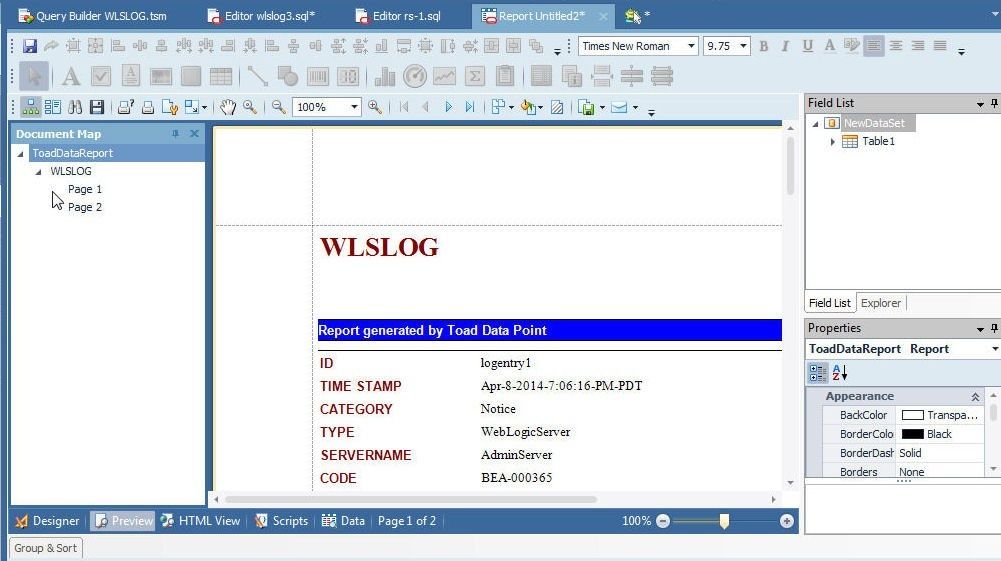
Figure 13. Report Pages
To display the HTML view click on the HTML View tab as shown in Figure 14.
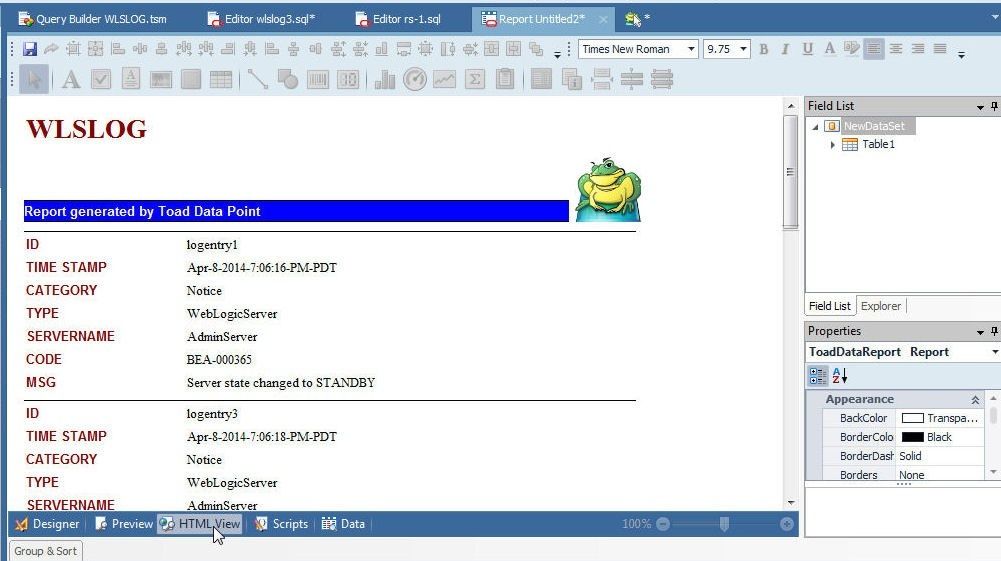
Figure 14. HTML View of Report
To display the report data click on the Data tab as shown in Figure 15.
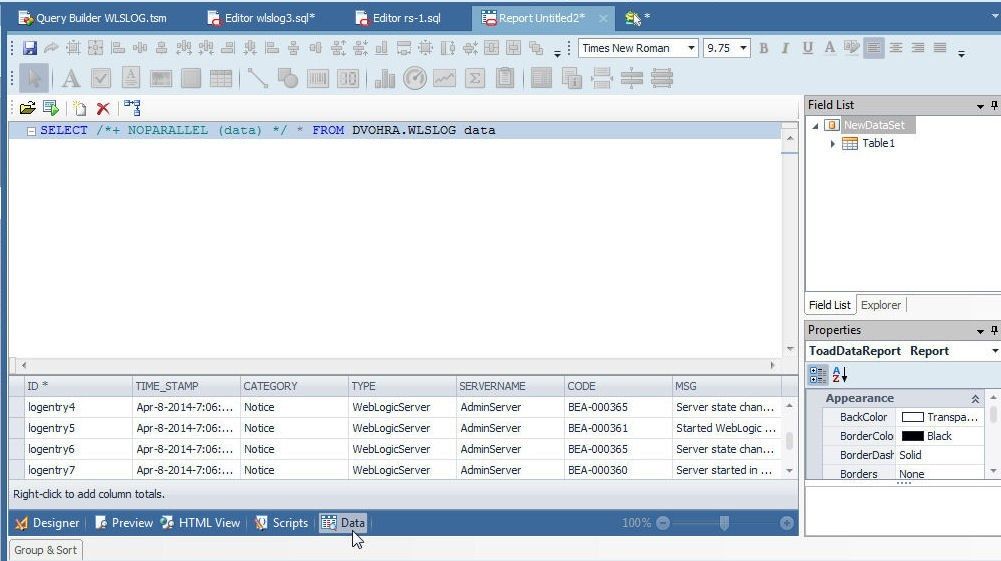
Figure 15. Report Data
To save the report right-click on report file tab and click on Save File As as shown in Figure 16.
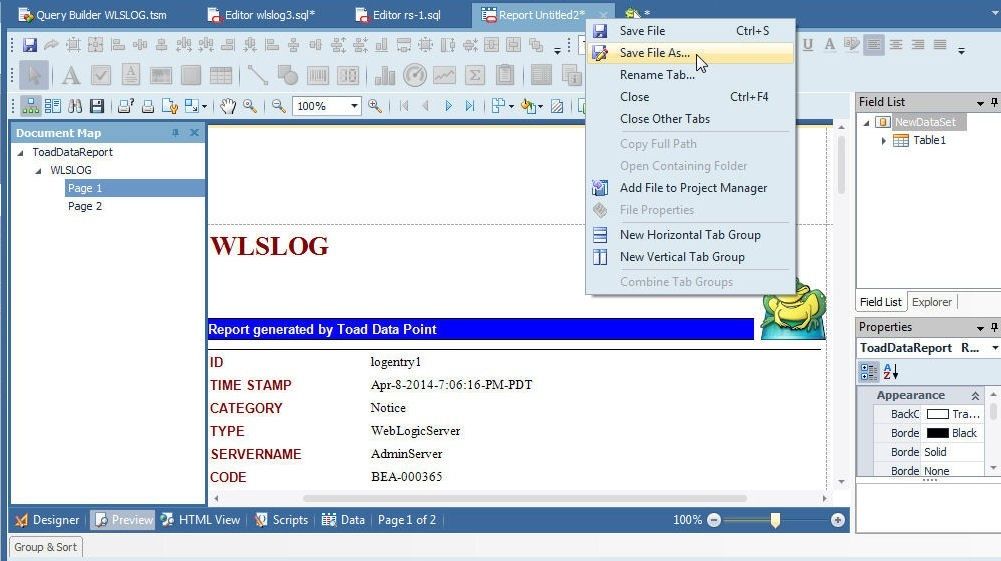
Figure 16. Save File As
In the Save As dialog specify a file name (.tdr) and click on Save as shown in Figure 17.
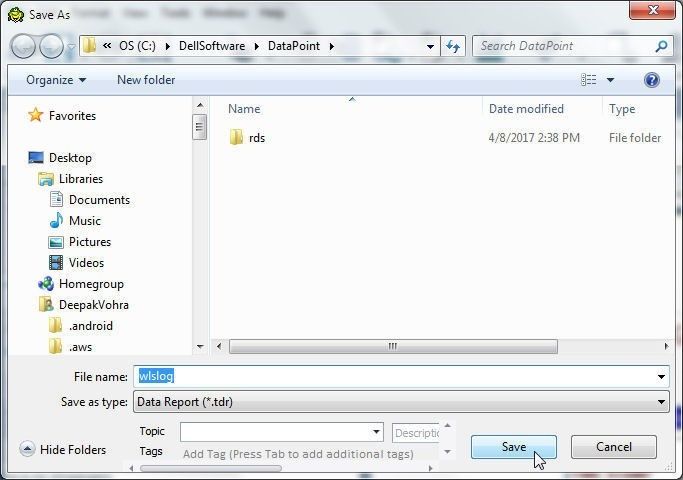
Figure 17. Saving Report File
The report may be sent via email with the Send via Email button, as shown in Figure 18.
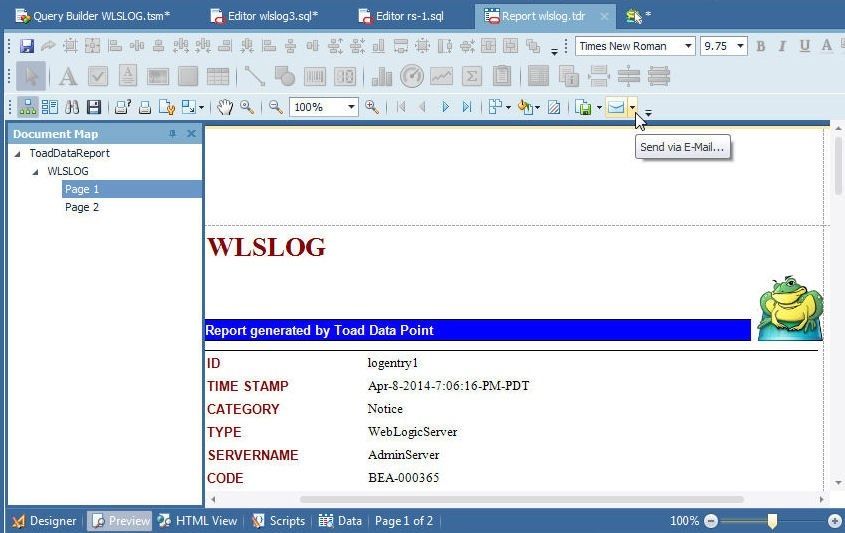
Figure 18. Send Via Email
Using the Import/Export Wizard to export to CSV File
Toad Data Point provides an Import Export Wizard to import/export a report. Click on the ImportExport button in the Toolbar as shown in Figure 19. Click on Import Export Data.
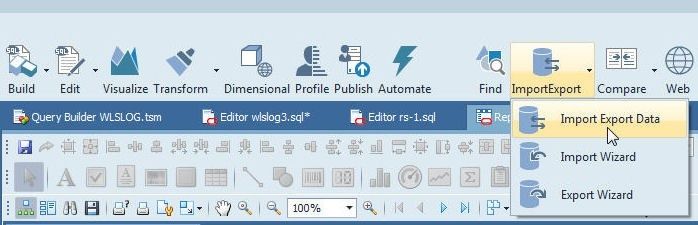
Figure 19. ImportExport
In the Data Import Export wizard two columns are provided: Get Data From and Put Data in, as shown in Figure 20. In the Get Data From select Datasource Object and in the Put Data in select File.
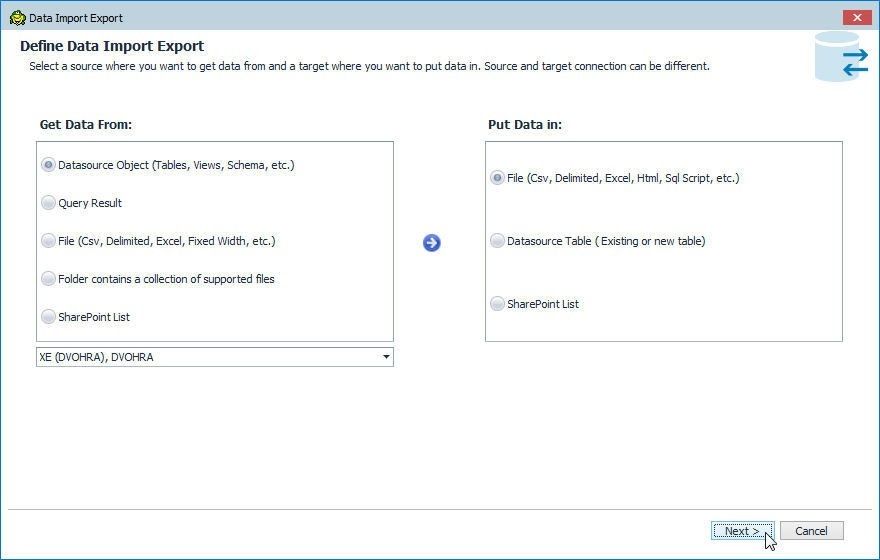
Figure 20. Data Import Export Wizard
The Export Wizard gets launched, as shown in Figure 21. Click on Next.
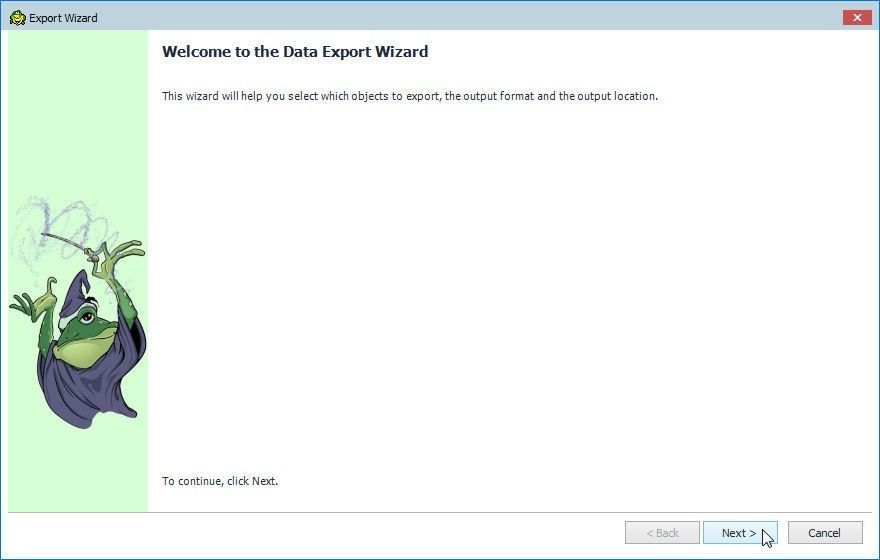
Figure 21. Export Wizard
Next, select objects to export. Click on Add as shown in Figure 22.
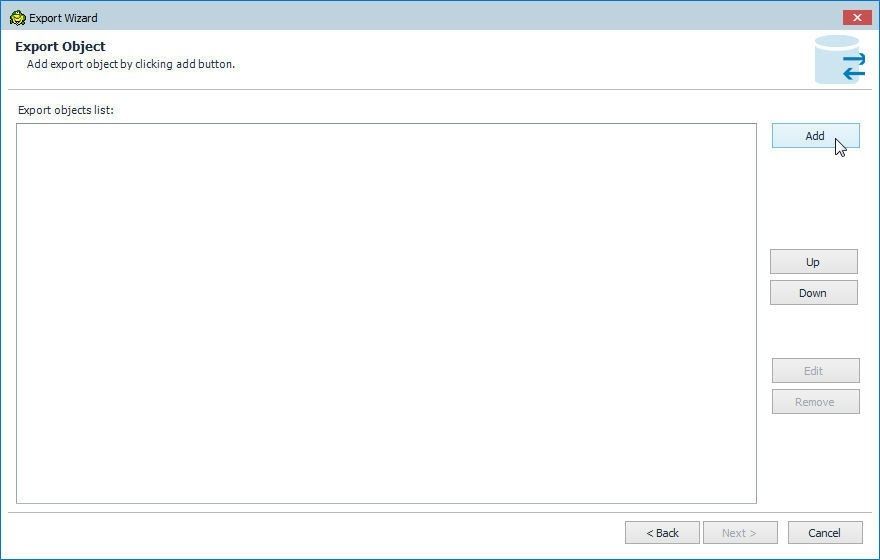
Figure 22. Add Export Object
Select object/s to export as shown in Figure 23. The Export Category lists the different type of objects that may be exported: Tables, Views, Synonyms, Public Synonyms, Schemas, Text list, Query and Query File. Select the WLSLOG table and click on Next.
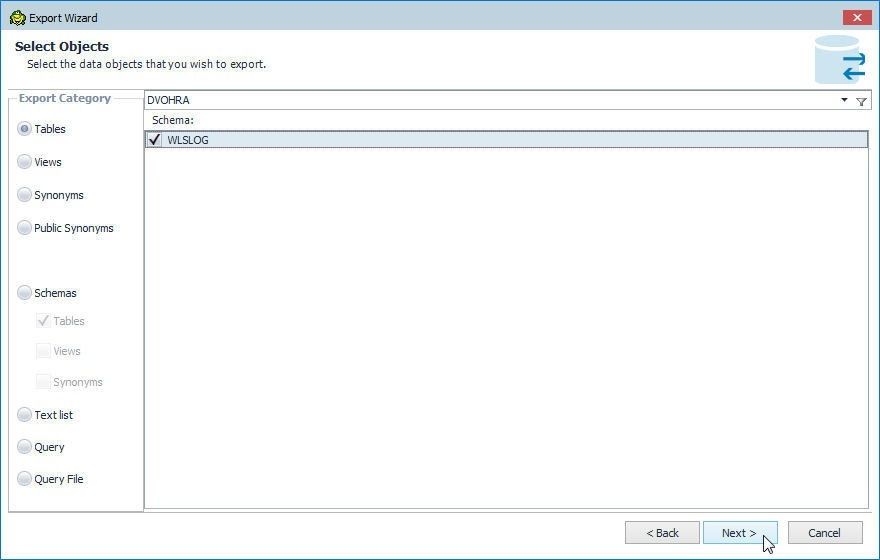
Figure 23. Selecting Objects to Export
Select an output format. To export to CSV file select Comma Separated Values. Provide additional detail about the output format such as Quote Character and whether to Always quote strings/char and Always quote date time values. Select Use column names for a header row and specify the Read buffer size and File encoding. The default settings for the Comma Separated Values output format are shown in Figure 24. Click on Next.
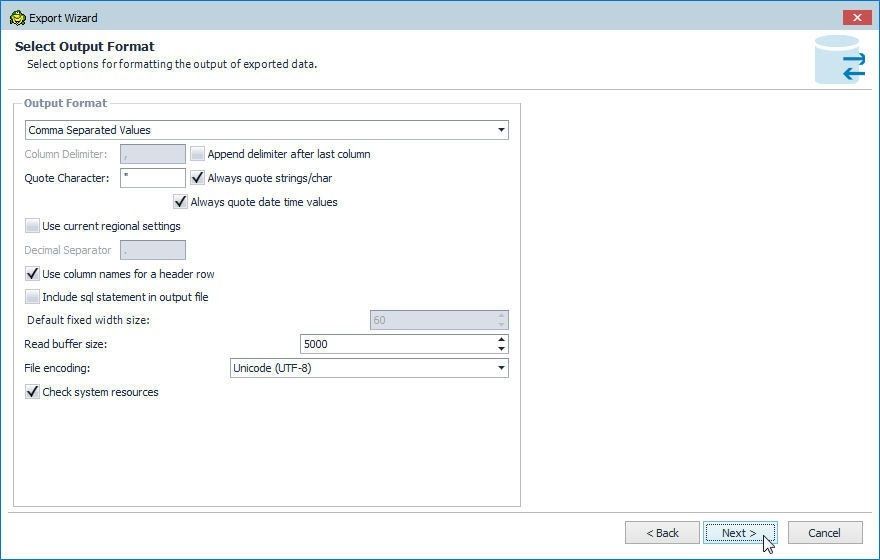
Figure 24. Comma Separated Values Output Format
Select the columns to export. Select all columns as shown in Figure 25.
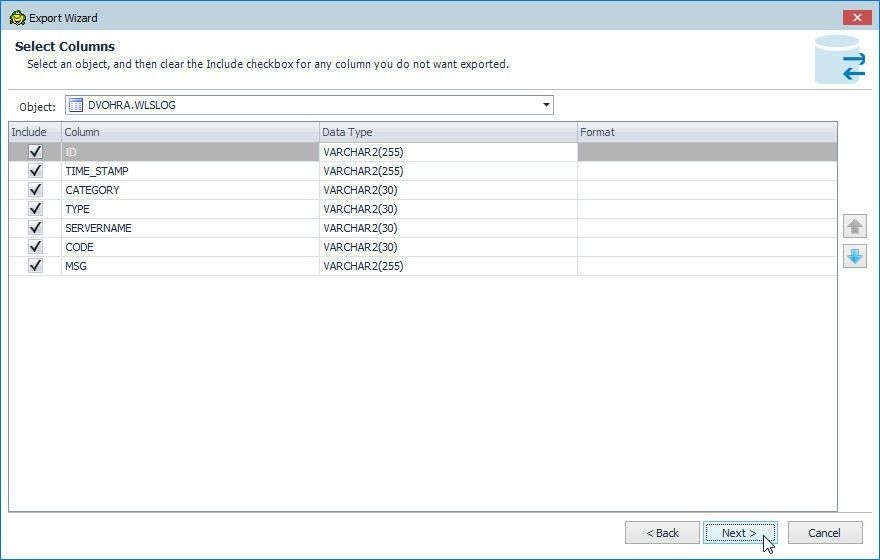
Figure 25. Selecting Columns to Export
Select Output Options as shown in Figure 26. The File output option is selected by default. Specify a directory and file name (WLSLOG.csv) to export to. For Existing File the Overwrite option is provided. The Add Date/Time suffix to filename option is selected by default. Click on Next.
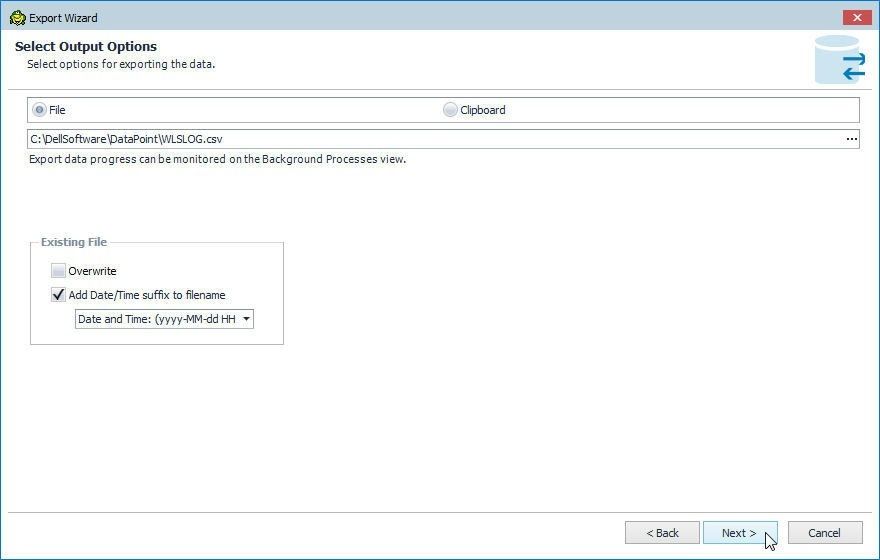
Figure 26. Selecting Output Options
Multiple objects may be selected in a single export. The Export objects list lists the WLSLOG table, as shown in Figure 27. Click on Next.
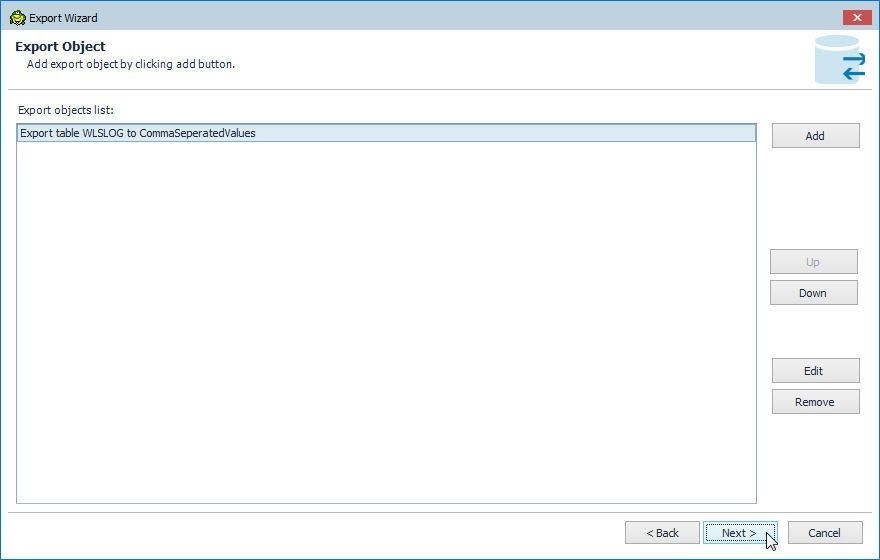
Figure 27. Export Objects List
Next, to complete the save settings, optionally select Save template and SaveLog options. Click in the checkbox Export data as shown in Figure 28. Click on Finish.
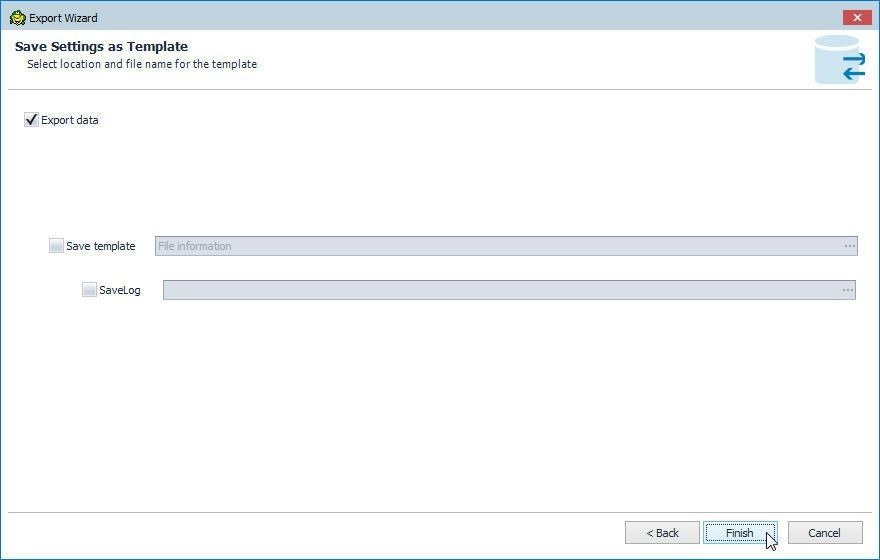
Figure 28. Export Data
Data gets exported and the Export Finished dialog gets displayed, as shown in Figure 29. The Export data summary results include the number of rows read, number of rows exported, and status and file name exported to.
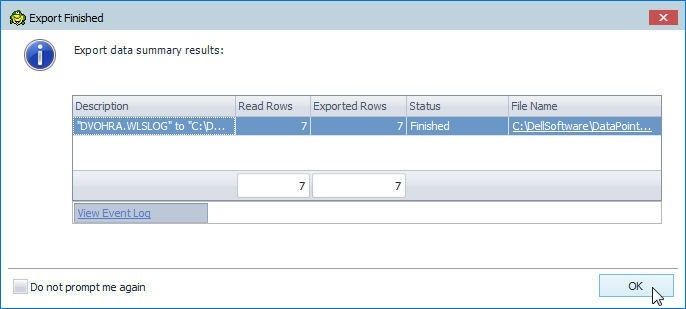
Figure 29. Export Summary
Open the .csv file to which the data is exported in a Notepad or other text editor, as shown in Figure 30.
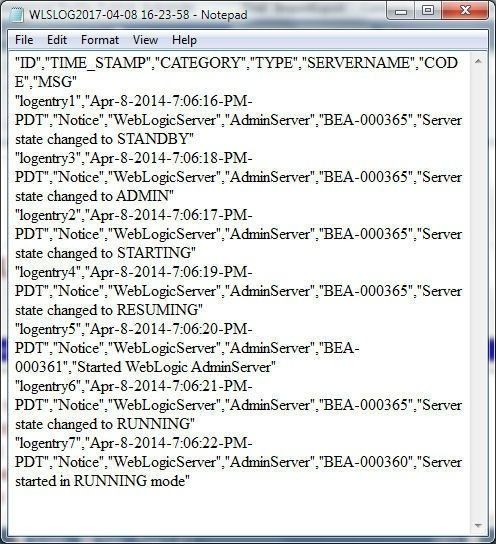
Figure 30. WLSLOG.csv File
Exporting Data Report to a PDF File
To export a report to a PDF file, click on Export Document as shown in Figure 31.
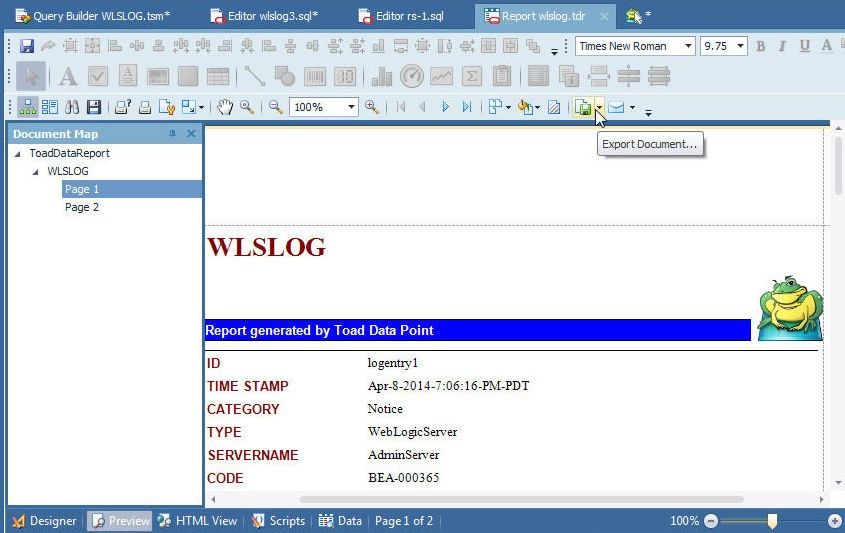
Figure 31. Export Document
Select from the list of output formats. For exporting to a PDF document select PDF File as shown in Figure 32.
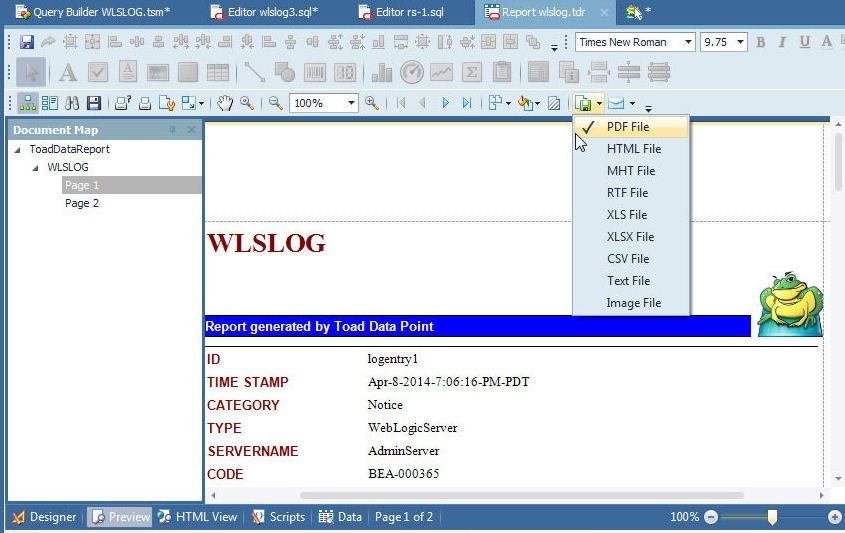
Figure 32. Selecting PDF File as Output File format
In the PDF Export Options select the default settings as shown in Figure 33 and click on OK.
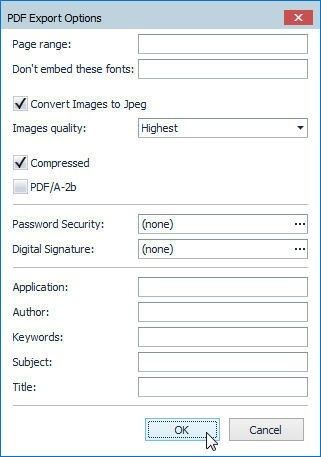
Figure 33. PDF Export Options
In Save As dialog specify a File name (ToadDataReport.pdf) and click on Save as shown in Figure 34.
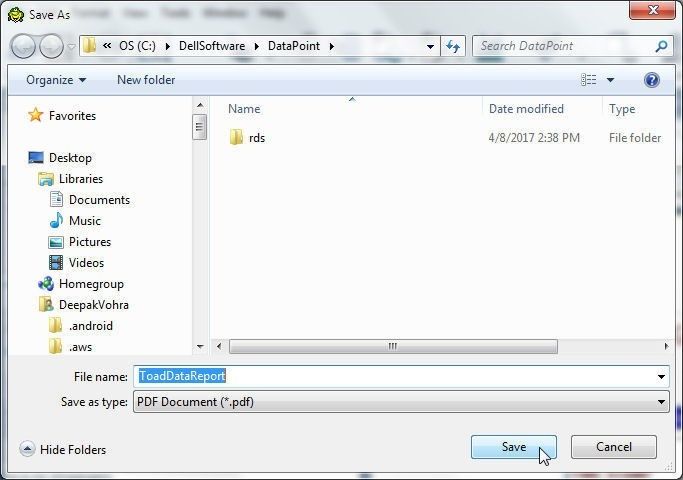
Figure 34. Saving PDF File
The report gets exported to a PDF file. An Export dialog gets displayed for user input on whether the exported file should be opened, as shown in Figure 35.
Figure 35. Export
The PDF Report gets displayed in Adobe Acrobat or Adobe Reader as shown in Figure 36.
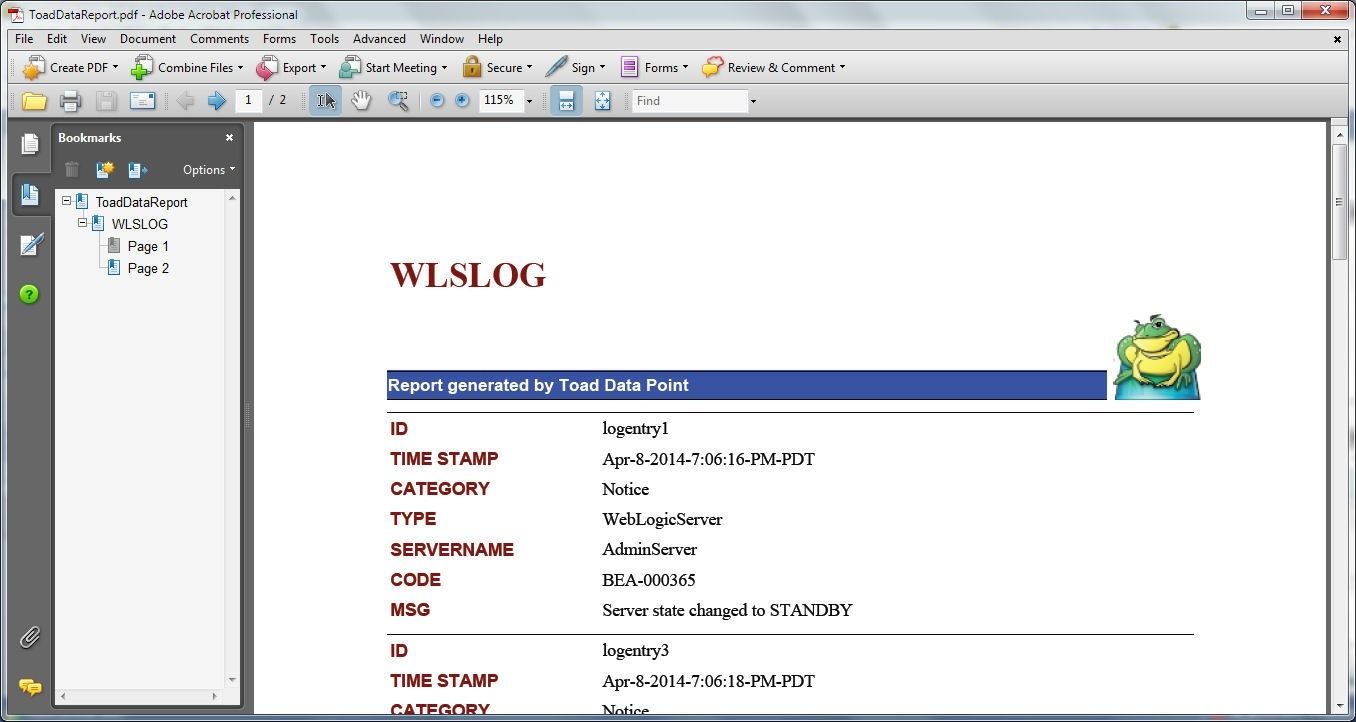
Figure 36. PDF Report
The Export Document lists options to export to other output formats. To export to an image file select Image File as shown in Figure 37.
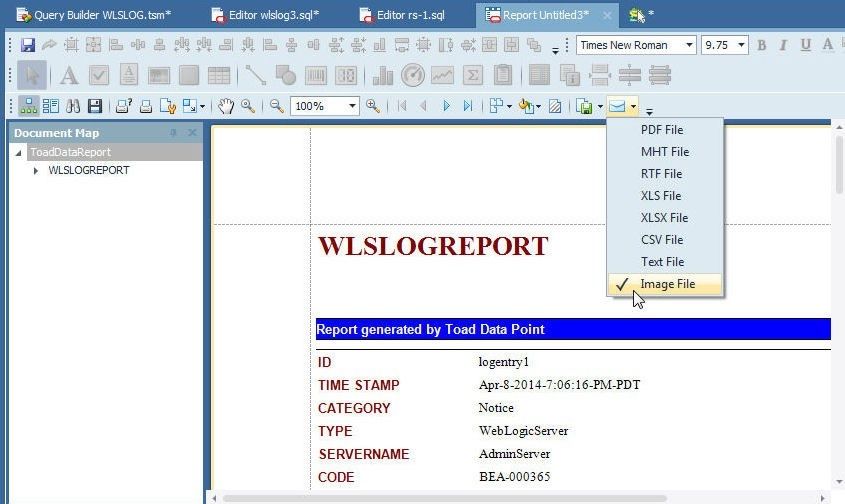
Figure 37. Exporting to an Image File
Select the Image Export Options, such as Image Format, Resolution, Export mode, and click on OK as show in Figure 38.
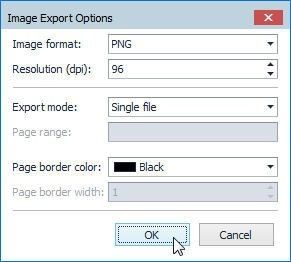
Figure 38. Image Export Options
Adding a Watermark to a Data Report
The Data report has the provision to add a watermark to a report. To add a watermark select Watermark as shown in Figure 39.
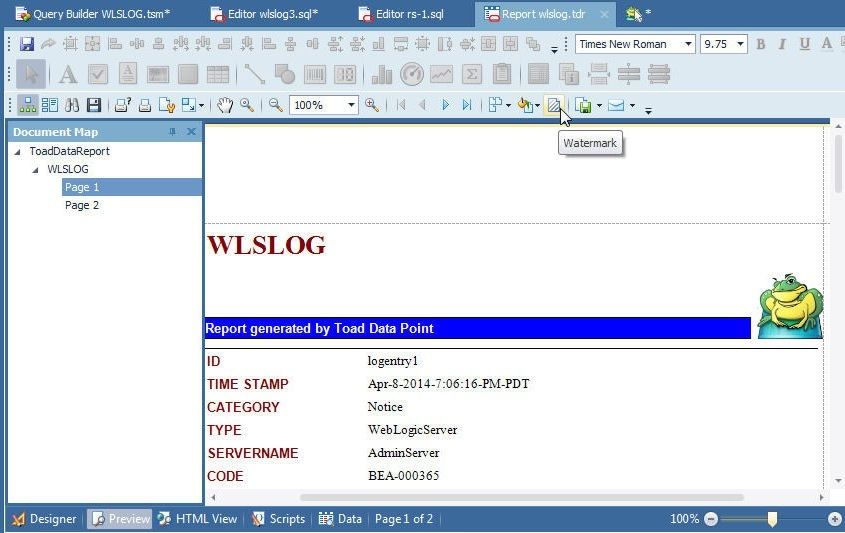
Figure 39. Selecting Watermark
In the Watermark dialog select from one of the two watermark options: Text Watermark and Picture Watermark. Select the Picture Watermark to add a picture as a watermark as shown in Figure 40.
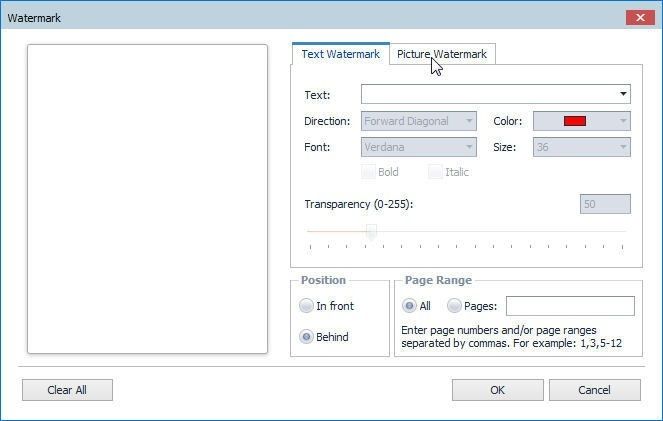
Figure 40. Selecting Picture Watermark
An image is required for a Picture Watermark. Click on Browse in the Load image as shown in Figure 41.
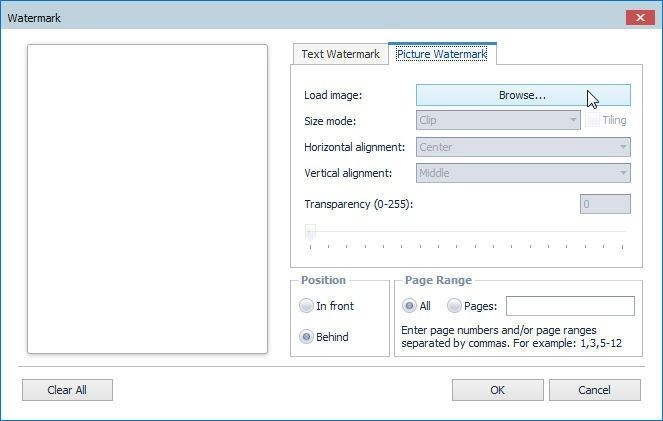
Figure 41. Load image>Browse
In Select Picture select an image to upload and click on Open as shown in Figure 42.
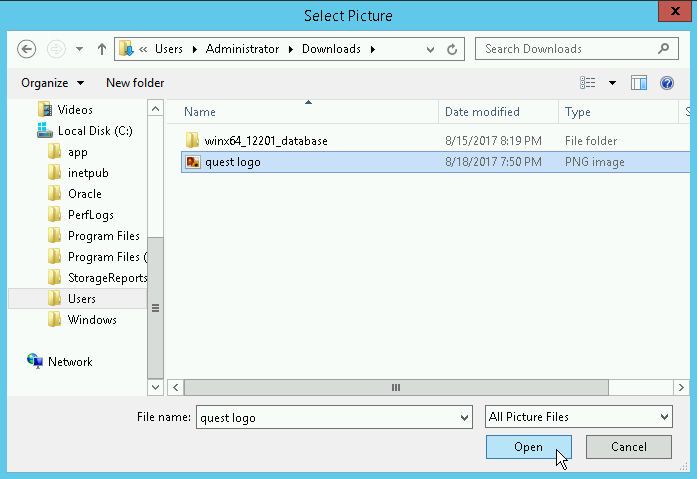
Figure 42. Selecting an image to add as a Watermark
Select the Position (Behind) and Page Range (All) as shown in Figure 43 and click on OK.
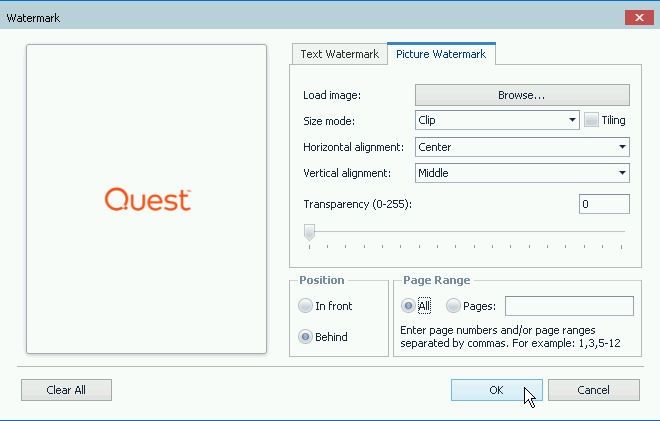
Figure 43. Watermark Configuration
The image gets added as a watermark to each page in the data report as shown in Figure 44.
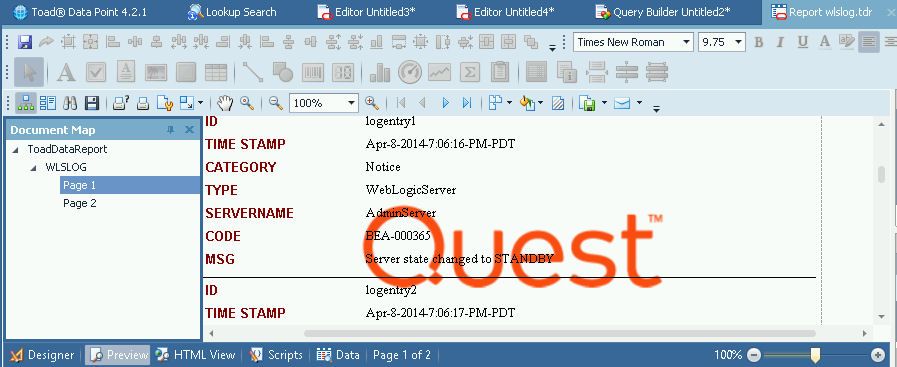
Figure 44. Data Report with a Picture Watermark
Export the data report to a PDF file and the Picture Watermark is added in the PDF file, as shown in Figure 45.
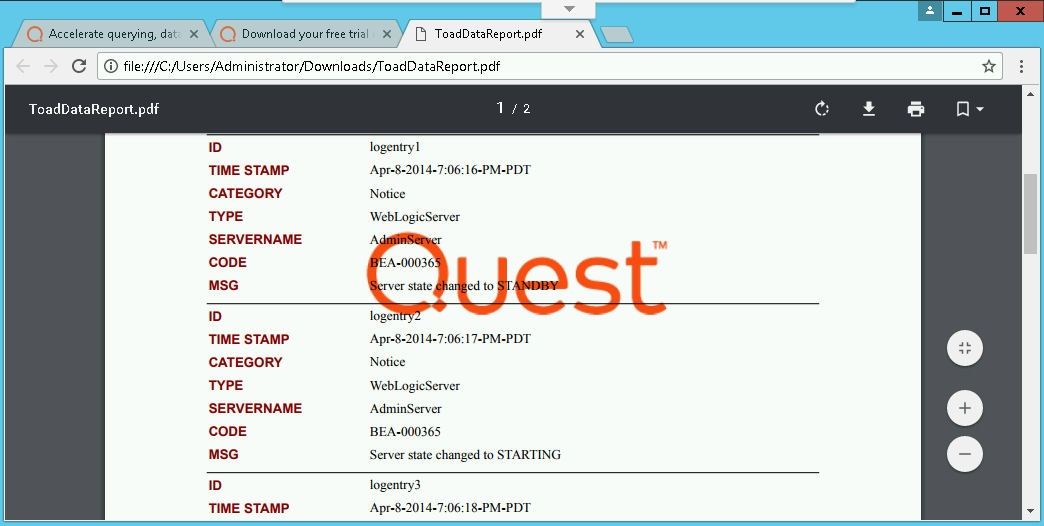
Figure 45. Picture Watermark in PDF File
Exporting Query Result to an Excel Spreadsheet
Query result data may be exported to an Excel file. After generating a query result select Export data to an Excel file as shown in Figure 46.
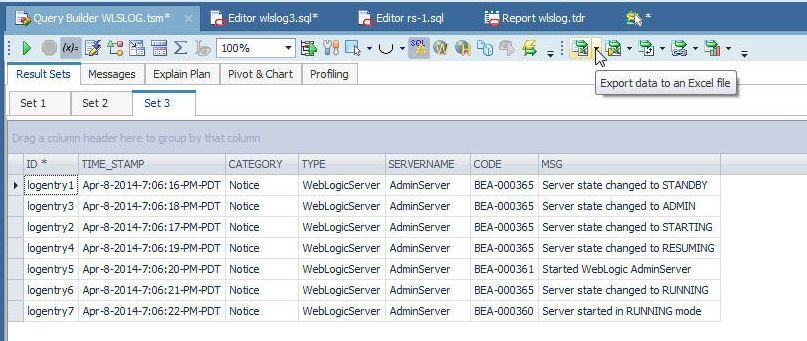
Figure 46. Export data to an Excel file
The query result set gets exported to an Excel file and an Export Finished dialog gets displayed, as shown in Figure 47. A link for the File Name including directory path is also provided.
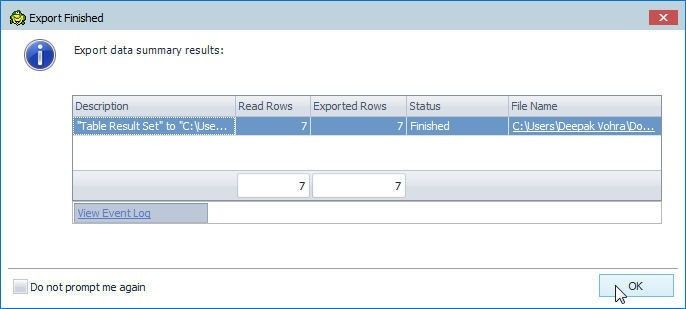
Figure 47. Export to Excel File Finished
The Excel file exported is shown in Figure 48.
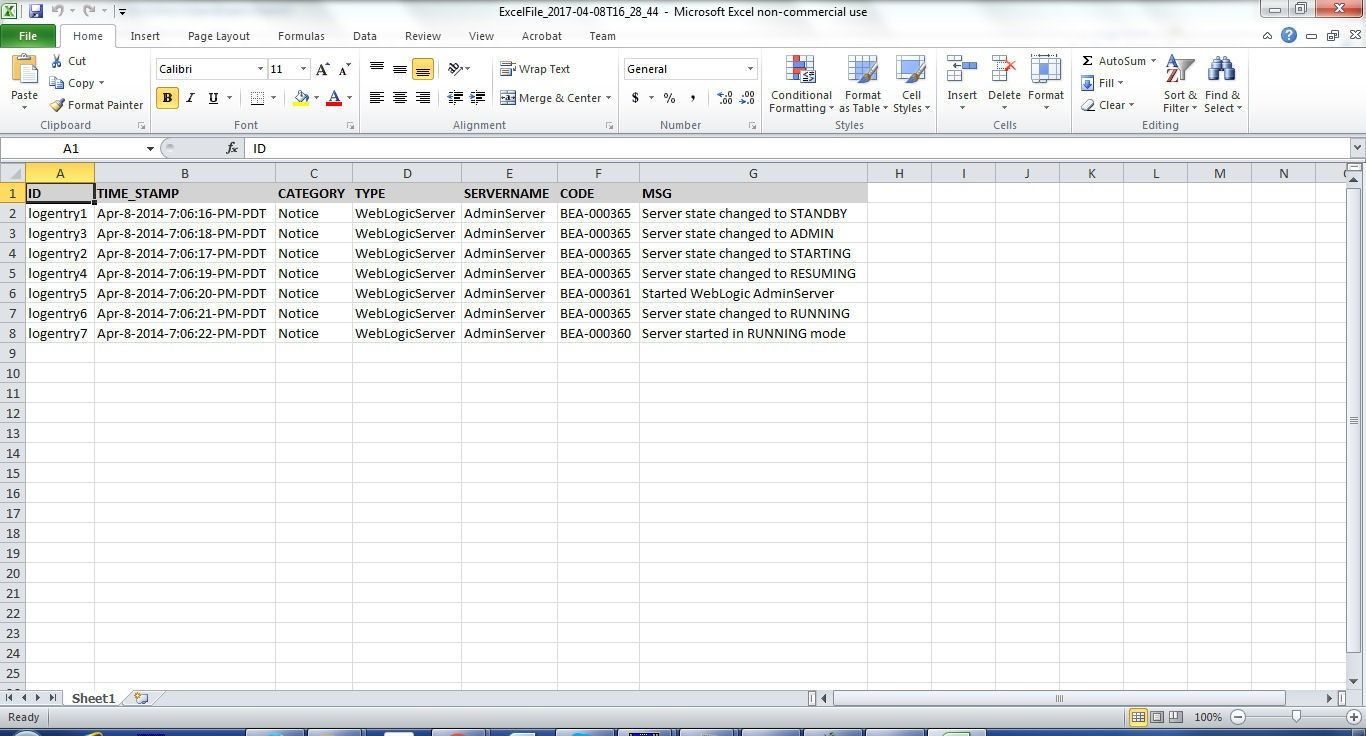
Figure 48. Excel File exported from Query Result
Conclusion
In this article we discussed generating reports from an Oracle Database table in Toad Data Point. Several different kinds of reports were generated: CSV, HTML, Excel and PDF.
Start the discussion at forums.toadworld.com