Hi,
I have used this option to show SQL bind variable content for a while, I want to show you how I avoid running SQL Trace with this Toad Explain Plan feature. Toad has also made it very easy to run SQL Trace right from Toad…but this might even be better!
If you have been in my tuning class or read my tuning blogs, I carry on at length about the importance of reviewing the explain plan the SQL executed with, not an explain plan because you asked for one. In November I illustrated how to have Toad bring back the explain plan from the library cache (click here to see blog post).
This advanced feature is part of the DBMS_XPLAN package and is easy to use with TOAD.
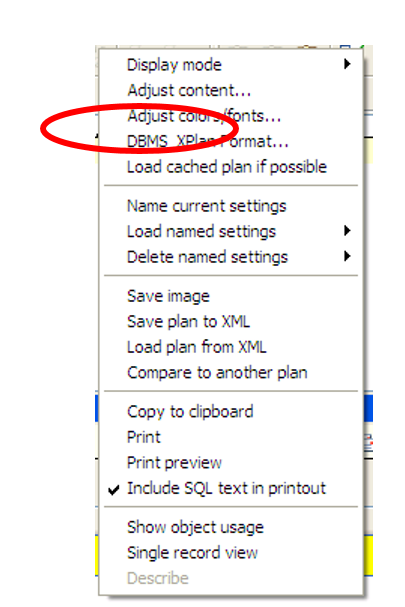
First, right click on the explain plan tab output area and select ‘Adjust DBMS_XPlan Format’. Also click on the ‘Load cached plan if possible’.
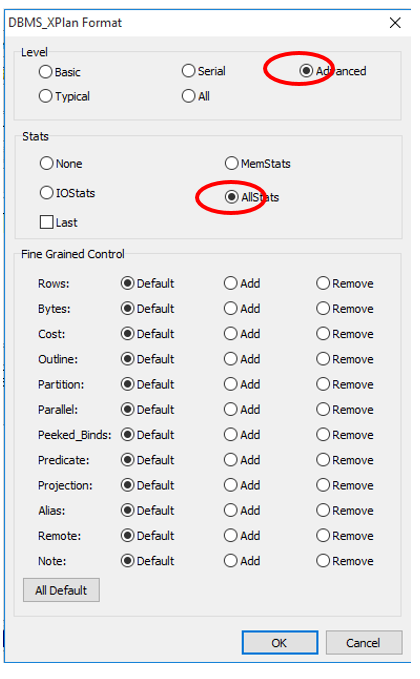
Select the ‘Advanced’ and ‘Allstats’ option and click ‘OK’.
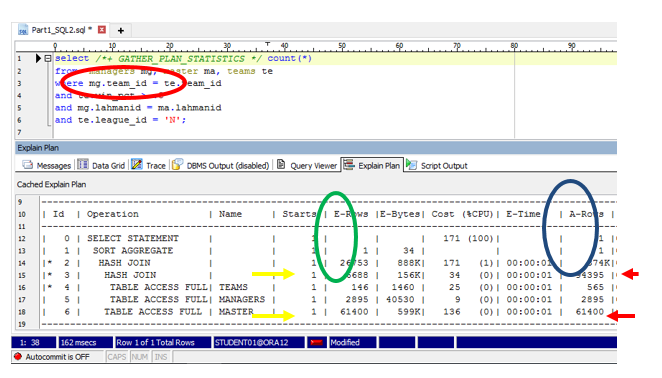
Add the ‘GATHER_PLAN_STATISTICS’ hint as seen in the red circle above. Now click and execute your SQL, execute it, not just show an Explain Plan. After it is done executing, click on the Explain Plan button.
This DBMS_XPLAN with the Advanced feature shows a considerable amount of additional useful detail. It will show bind variables J. I wrote a blog on this back in November.
In my SQL Tuning class…I discuss how to read explain plans. I discuss the 2 main join conditions for SQL containing joins…Nested Loops and Hash Joins.
Nested Loops work best when the first table is much larger than the second. Conversely, the Hash Joins are just opposite…they go smaller to larger.
Oracle’s Cost-based Optimizer (CBO) will join 2 tables at a time and you read from the most indented first. The output from the most indented is passed to the next step up and becomes the first table/input of that join.
This Advanced Feature shows the CBO estimated row counts (E-Rows), as you would see when just asking for an explain plan, see Green Circle. The Actual row counts (see Blue Circle) are the actual row counts (A-Rows) when the SQL executed!!!
I harp on this in the SQL tuning class…you have to see the actual row counts of the problem SQL in an explain plan. I used to run SQL Trace to get this information (ie: see the actual explain plan the SQL executed with) but now I use this facility.
The example SQL has a 3 table join. Notice the first hash join at step 3 above, it takes in the TEAMS table at step 4 (smaller row count) and joins it with the MANAGER table in step 5 (larger row count), producing what the CBO thinks will be 6688 rows out of this join (see step 3). When the SQL executed…there were 94,395 rows! …see Blue Circle…step 3. Now, when you take this row count number and bring in the 3rd table MASTER at step 6…the Hash Join is going larger to smaller…not smaller to larger.
This IS the performance issue with this particular SQL statement.
Read my other blogs on SQL tuning…I cover a lot of useful information about explain plans. It’s nice that Toad has this feature.
Start the discussion at forums.toadworld.com