I have used the Toad explain plan advanced options to show SQL bind variable content for a while. I want to show you how to get this advanced information when doing SQL tuning with Toad. When tuning SQL that contain bind variables, it is important to know the data that maybe causing the performance issue.
If you have been in my tuning class or read my tuning blogs, I carry on at length about the importance of reviewing the explain plan the SQL executed with, not an explain plan generated because you needed one. Last week I illustrated how to have Toad bring back from library cache the actual explain plan that SQL most recently executed with.
This advanced feature of Toad is actually a part of the DBMS_XPLAN package and is easy to use with Toad.
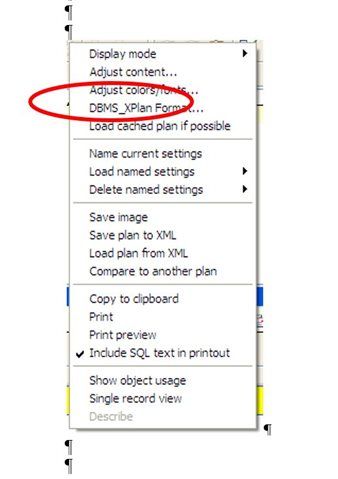
First, right click on the explain plan tab output area and select “Adjust DBMS Format”. You can also click on “Load cached plan if possible”, discussed last week.

Figure 1

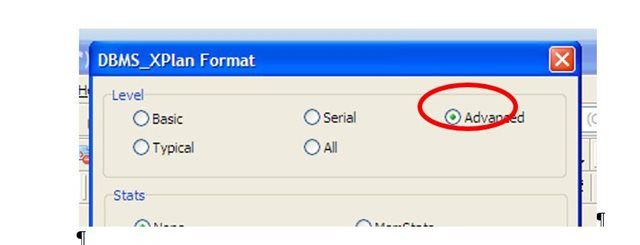
Figure 2
Select the “Advanced” option and click “OK”.
Now click and execute your SQL. When you go to the explain plan tab, you will see a ton more useful information!
Such as:
-
The explain plan
-
Query block and table alias chart
-
Outline (hints needed to reproduce this exact explain plan)
-
The same predicate information (WHERE clause items)
-
Useful column projection information
-
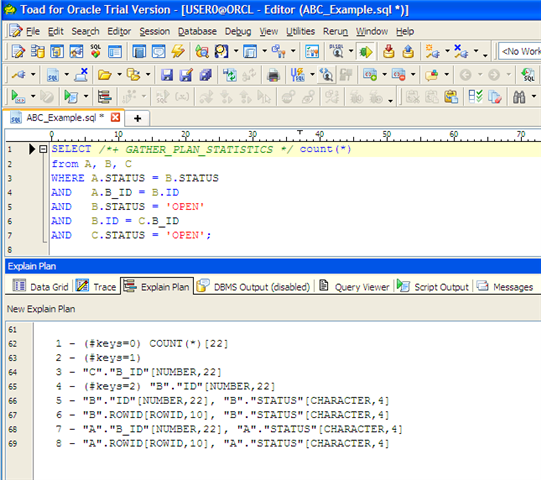
AND if the SQL contained bind variables, this feature will list the bind variables and the data supplied to the bind variables!!!

Figure 3
Read my other blogs on SQL tuning. I cover a lot of useful information about explain plans. It’s nice that Toad has this feature.
Start the discussion at forums.toadworld.com