This trace has been around for quite a while. I’m not sure when it first showed up but easily back to Oracle8i.
This is the Cost-based Optimizer trace. This trace really tells you ‘why did the CBO process this explain plan’…it goes into considerable detail on the hard parsing process that I’ve discussed in various blogs in 2015. Look up the blog on hard parsing and this will reflect here with the actual details.
I like to show this trace in my SQL tuning class after I discuss the hard-parse process because everything I say about hard parsing appears in this trace file…the permutations, the query transformations, the statistics and how they are used, and how the cost numbers are used…its all here…
As far as a tuning resource, I’ve not been that interested in it…except when it comes to hints. This trace is the only way I know of to see if the CBO considered my hints, and if not, why.
Also, I’ve discussed query transformation…where Oracle fixes data type mis-matches and ‘opens access paths’…transitive math…adding additional where clause items…I’ll discuss as one appears in my example trace. This is the ONLY place to see the actual SQL statement Oracle submitted on your behalf.
I am going to write a 10053_trace tool that will not only run the below-mentioned script syntax but display the output without having to ask the DBA for your trace file (will use a database directory). Watch for an announcement on this new tool.
This is the syntax to start and stop this trace. The trace files are all created in the ‘BACKGROUND_DUMP_DEST’ location (init.ora setting).
alter session set events '10053 trace name context forever';
run your SQL statement here…
alter session set events '10053 trace name context off';
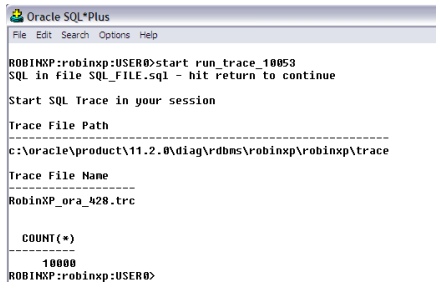
Figure 1
I’ve also written a little .bat file to turn on/off the trace and tell you the name of the trace file and its location!
Ask me for this script.
Watch for my tool on running this and displaying the useful information in various panels…hope to have it working soon…with this tool you will not have to ask for the trace file.
Things in the trace file:
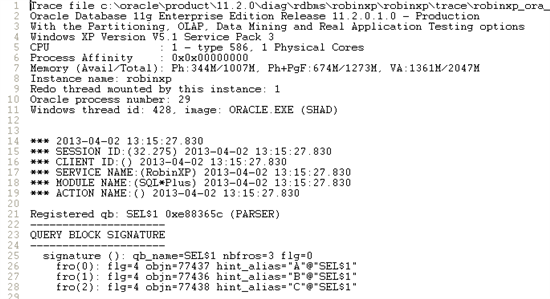
Figure 2
The trace starts out with useful information about the Oracle and session. The Query Block Signature is where the SQL is examined for sub queries and table accesses and the query blocks assigned. These query blocks are used to hold the rowsets for Explain Plan processing.
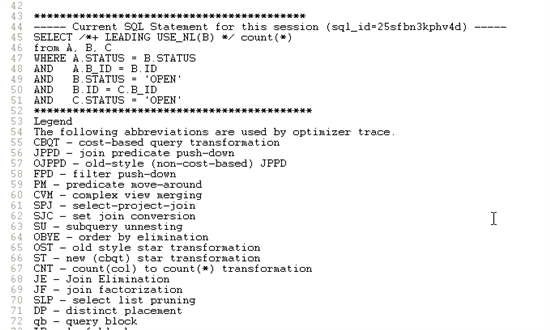
Figure 3
Next is the actual submitted SQL statement and its SQL id. This information appears several times throughout this trace file.
There is a handy legend of what the various terms mean…look at the very first one…CBQT…query transformation…I’m not making this stuff up!
Init.ora parameters appear several times. I’m not showing all of this because of space limitations. The first time are the settings used to process this SQL. There are also the current settings at the database level as well as a list of what the default settings are. I’ve actually used these lists to diagnose a particular performance issue (once upon a time…). ALL of the settings appear…even the undocumented ones (these start with an under bar…).
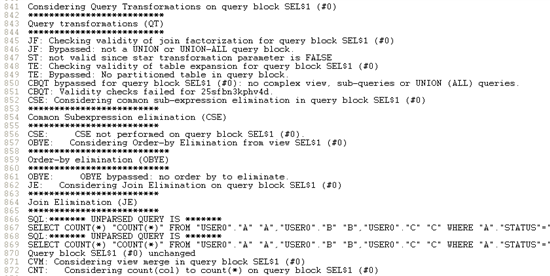
Figure 4
Next comes the query transformation! This trace tells you what it is considering…the legend is useful here too.
This particular SQL…check above…does not have the ‘A=’STATUS’…
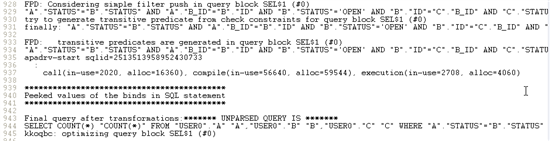
Figure 5
Check out the verbiage! Considering simple filter push at line 928…transitive predicates are generated at line 933…and the SQL that is being submitted for processing at line 943!
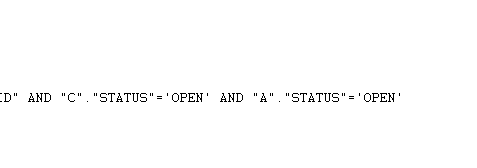
Figure 6
This process added this where clause predicate…because…there MIGHT be an index on this column…transitive math. Review the original SQL…b.status = OPEN and c.status= open and a.status = b.status…therefore…a.status = OPEN !!!
This is simple but look at all the other items considered. This is also where the CBO looks at the sub query to get an idea of approx row count returned. Low rowcount…this section tends to leave the Subquery alone. Higher return rowcounts…this section tends to rewrite the Subquery into an inline view…ie: a join condition.
You see the end result of this in your explain plans but you really don’t know how the CBO got a join out of a simple Subquery. This trace will show these items…
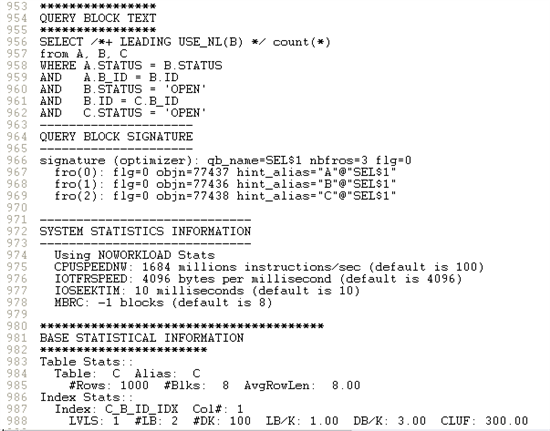
Figure 7
Next, the trace shows the SQL submitted again, the signature blocks (this information seems to repeat itself several times…I’ll show it only once in my upcoming tool…). Notice the System Statistics at line 972 and the object stats starting at line 981! Its all here. We have discussed and will re-discuss these statistics and the role they play in hard parsing…but this is the information the CBO will use to determine approximate row counts for the explain plan lines.
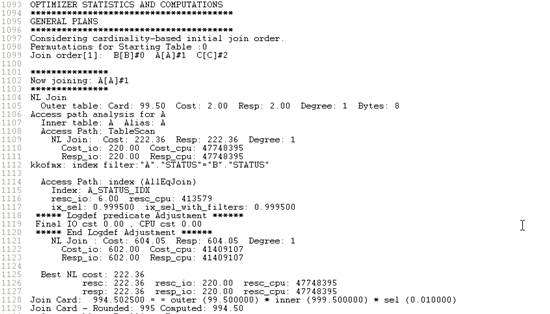
Figure 8
Then we get into the actual permutations. I say this often in my class…the top cost number of the SQL is really the only important number. This cost is used to select one of these permutations over another. The lower the cost, the better the CBO things the SQL will perform. Cost is roughly physical IO but there is a bit more to it…like those machine and IO speeds we saw above…
Anyway…this section shows the output of trying a nested loop join, a sort-merge join, and a hash join operation. Why? Because the CBO doesn’t know which one will be better…so…it tries them all. Brute force I call this.
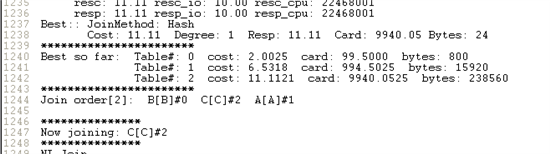
Figure 9
This shows the end of this permutation. You can see the best so far…and the cost of 11.11. The next permutation starts with the join order again (I’ve discussed tricks I do to help this join order…)…but you can see each permutation, the indexes it has tried…you will see it try indexes and permutations with full table scans…etc. you don’t see the actual math but you do see the end result of the statistical decisions.
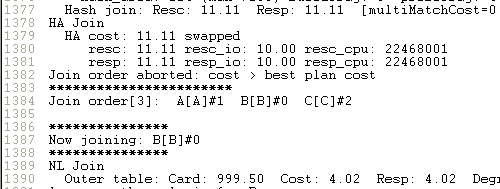
Figure 10
At line 1382…the CBO quit on this permutation as it came out higher than the previous permutation. You will see where these permutations quits on various operations when it notices the cost is way higher than the one it already has.
As I said in class…the CBO runs a permutation and saves that top cost number. This becomes the one to beat. Matches…it keeps the first permutation output.
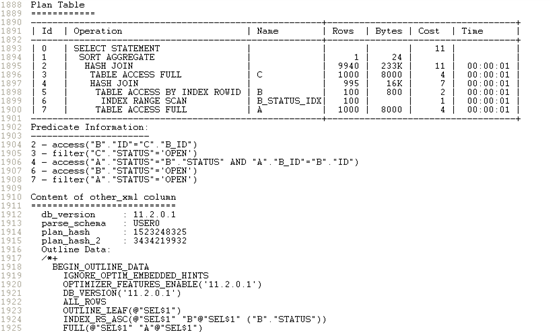
Figure 11
After the permutations, the CBO then assembles the explain plan. This too is in this trace file. It displays the dbms_xplan formatted explain plan, the outline, and other useful information. Notice the top cost is 11…same as the first permutation using hash joins…
At the end, is the useful information about the hints.
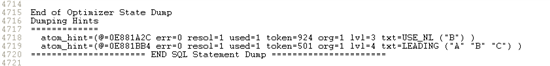
Figure 12
This information shows me it found both hints (resol=1), no errors (err=0), and used both (used=1). There are many reasons the CBO won’t use a hint including conflicts, wrong type (parallel hint but not on a parallel system…etc).
I created this Youtube video on this very discussion…https://youtu.be/U3qwUq7yLOc
Watch for my tool to run and display this useful information. Ask me for the script to run this trace.
Start the discussion at forums.toadworld.com