Here's a SQL Optimizer success story! SQL Optimizer for Oracle automates the SQL optimization process and maximizes the performance of our SQL statements. SQL Optimizer analyzes, rewrites, and evaluates SQL statements located within database objects, files, or collections of SQL statements from Oracle’s System Global Area (SGA). Once SQL Optimizer identifies problematic SQL statements, it optimizes the SQL and provides replacement code that includes the optimized statement.
SQL Optimizer also provides a complete solution for index optimization and analysis of plan changes. It provides index recommendations for multiple SQL statements, simulates index impact analysis, and generates SQL execution plan alternatives.
When we open this tool, we can see the Welcome window that shows us a list of tasks. If we want to deactivate this window, we uncheck the "Show Welcome on next startup" option at the bottom of window.
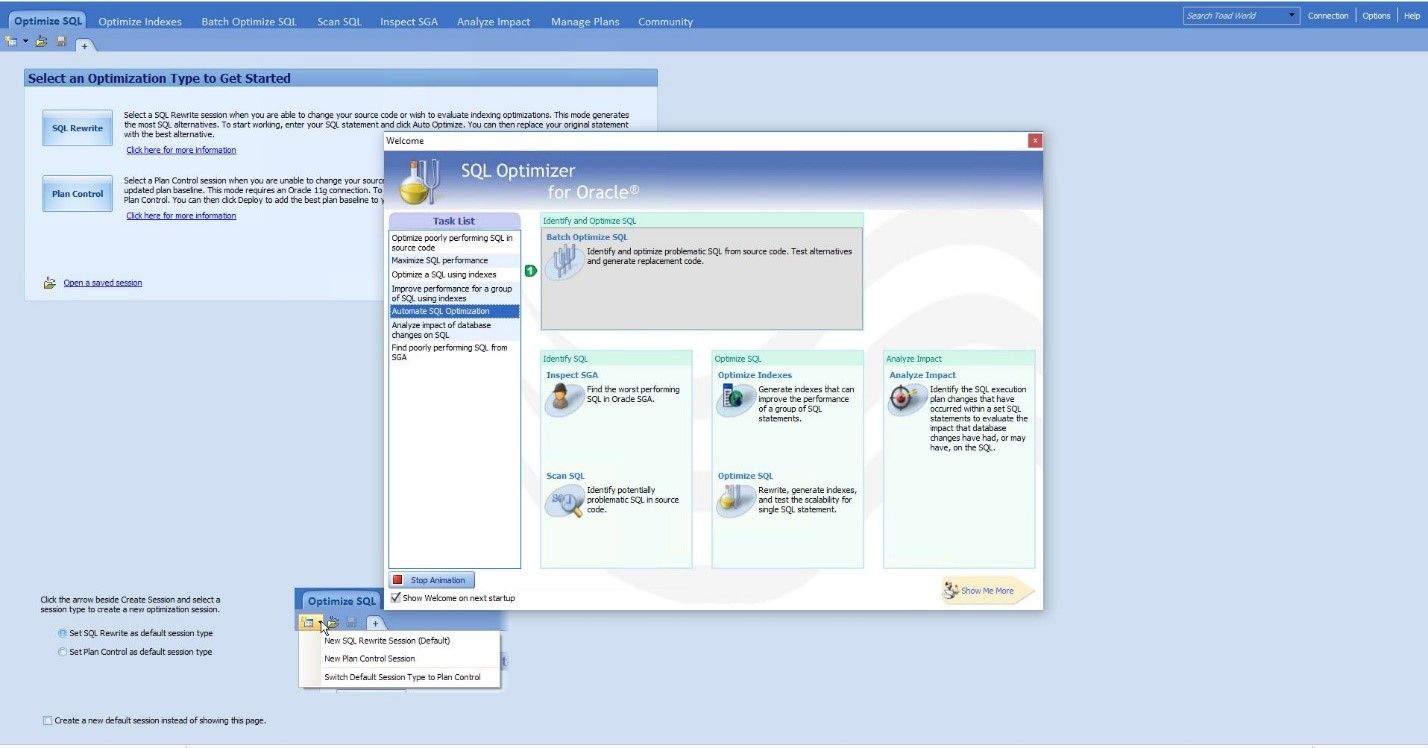
Figure 1: Welcome Window
Features
Optimize SQL offers SQL Rewrite mode and Plan Control mode. SQL Rewrite mode allows us to generate SQL statements and index alternatives for problematic SQL statements. Plan Control mode lets us take advantage of the SQL Plan Management feature introduced in Oracle 11g to optimize execution plans and deploy plan baselines for SQL statements without changing the original source code. This feature is particularly useful for third-party applications where we don’t have access to the source code.
Batch Optimize automatically identifies and optimizes problematic SQL statements using batch processing. It also generates optimized SQL statements that we can use to replace problematic SQL statements in our database environment.
Advise Indexes generates an index set for a group of SQL statements and tests the index set to determine performance improvement.
Scan SQL identifies problematic SQL statements in our source code and database objects without execution. It then analyzes the problematic statements and categorizes them according to performance levels.
Inspect SGA captures runtime statistics for running or executed SQL statements from the SGA to identify the statements using the most system resources.
Analyze Impact allows us to determine the performance impact of proposed changes to our database before physically making the changes.
Manage Plans organizes baselines and stored outlines used to improve SQL statement performance.
Success case using Optimize SQL
I want to present a successful case of a DBA’s using this tool, in which a process that originally took over six hours, including the total time of thousands of executions of a query, was reduced to taking 23 minutes after optimization.
A trace was made to detect which SQL was causing the most delay. The query identified as problematic was a query distributed between two databases, CCARD and PROD, whose tables were prepay_cellulars (CCARD) and cellulars (PROD) running on the database CCARD.
The execution plan showed that when accessing cellulars@prod, what it actually did was to access the public synonym called CELLULARS, which in turn accessed a v_pp_cellular view on the PROD database, and this view was formed with a Select cellulars from the same database. Clearly, we could replace the access to the synonym with a query to the cellulars table, without going through a view, which adds execution time to the query.
The DBA eliminated the synonym, which was obsolete to the business, and, looking at the execution plan, now it did have access to cellulars@prod.
SELECT PCE_HANDLE, CLU_ACTIVATION_DATE
FROM PREPAY_CELLULARS, CELLULARS
WHERE PCE_CLU_CELLULAR_NUMBER = :B1
AND CLU_CELLULAR_NUMBER = PCE_CLU_CELLULAR_NUMBER
AND PCE_ADD_DATE >= CLU_ACTIVATION_DATE
The expert DBA tried this new execution plan, which obtained good results. Then the DBA decided to try the SQL Optimizer tool to obtain a more reliable result, since the tests carried out were isolated values and sometimes false times are obtained, especially when indexes are used, because the index is left in the cache, so one tends to think that time is optimal.
Let's see how the DBA used the SQL Optimizer tool to analyze the original SQL query.
Open the tool:
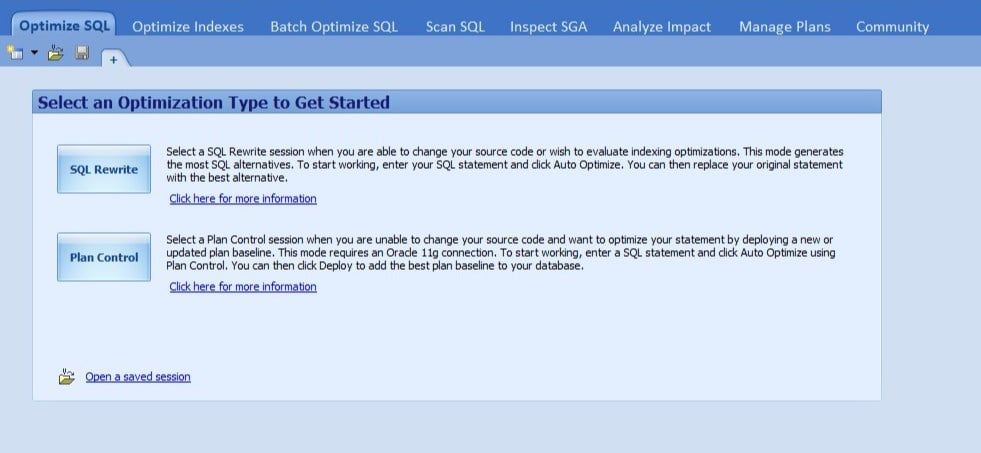
Figure 2: Optimize SQL tab
Select SQL Rewrite.
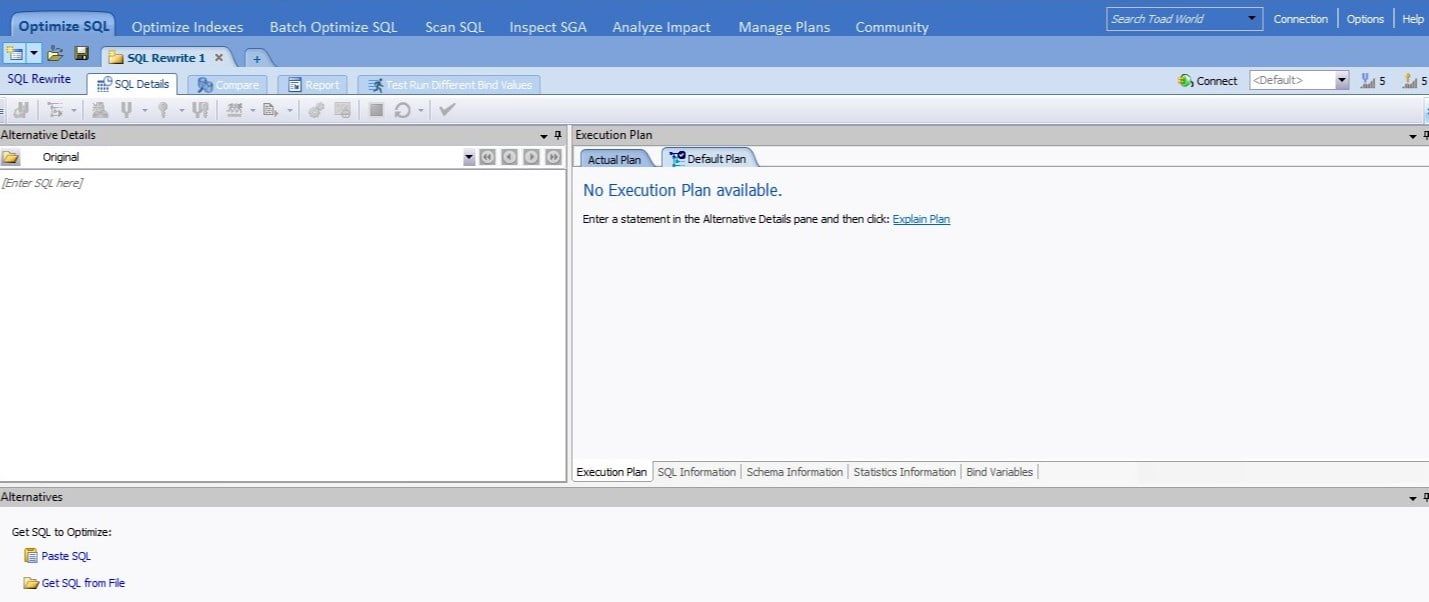
Figure 3: SQL Rewrite Window – SQL Details tab
Enter the SQL query in the “Alternative Details” section.
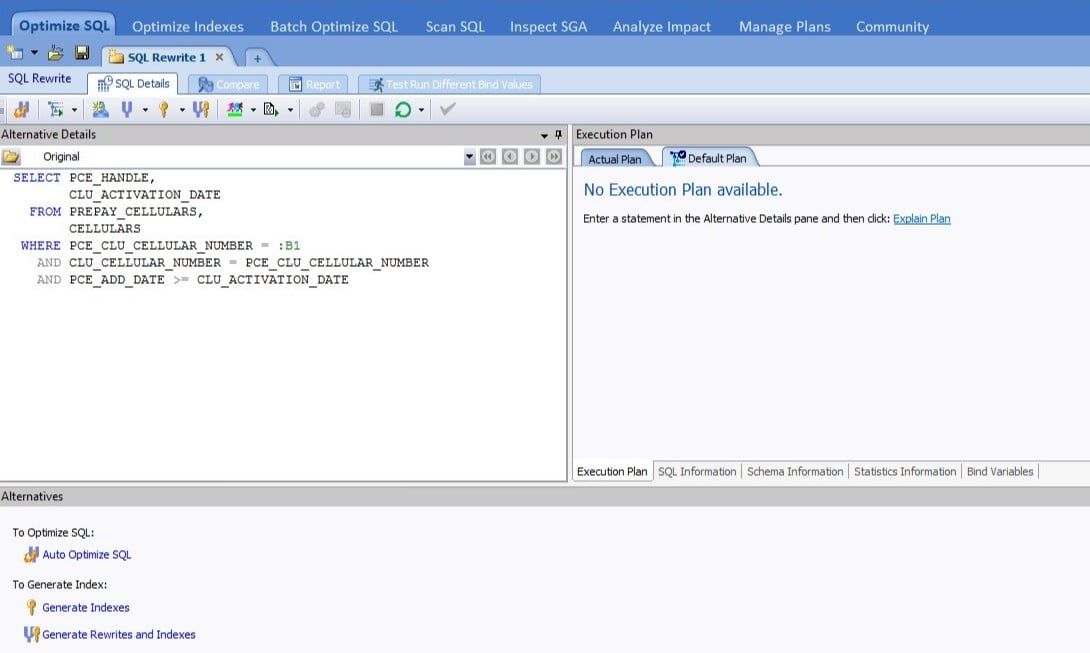
Figure 4: Alternative Details” section
Click on “Auto Optimize SQL”.
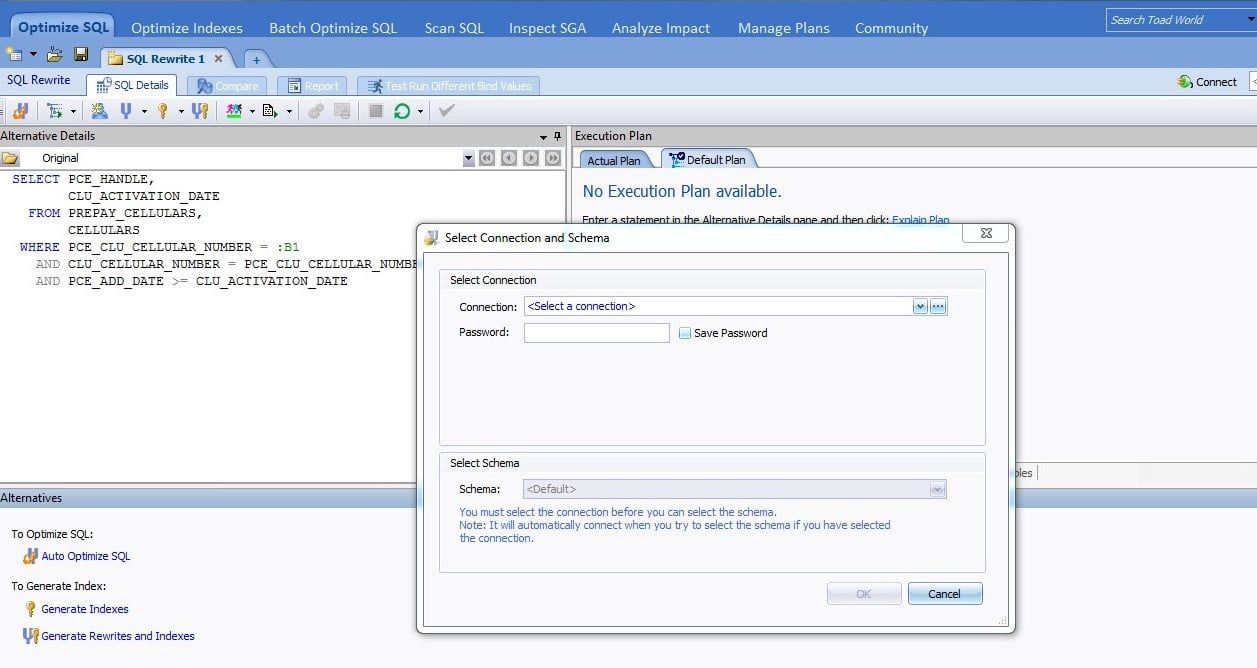
Figure 5: Select Connection and Schema
Enter the connection and schema data of the database and click on the OK button.
The "Test Run Settings" window appears, which allows us to configure the criteria with which the tool should choose the best alternative for our SQL.

Figure 6: Test Run Settings Window
In this case the DBA selected:
- Where this SQL is used: This SQL is used in my online query program (transactional system) and that all records must be retrieved.
- How this SQL is used: This SQL is executed as a dynamic SQL sent from an application program.
- The execution frequency for this SQL: High – Hundreds of times or more in a minute.
- Symptoms: This SQL runs longer than expected and I want to improve its run time.
- Check: This SQL significantly affects the performance of other SQL statements in my system.
- Check: This SQL runs very slow during the first execution of the day and I want to optimize this SQ for the scenario of no data cached in memory.
With this configured, click on the “Start Test Run” button.
The "Setting Bind Variables" window appears.
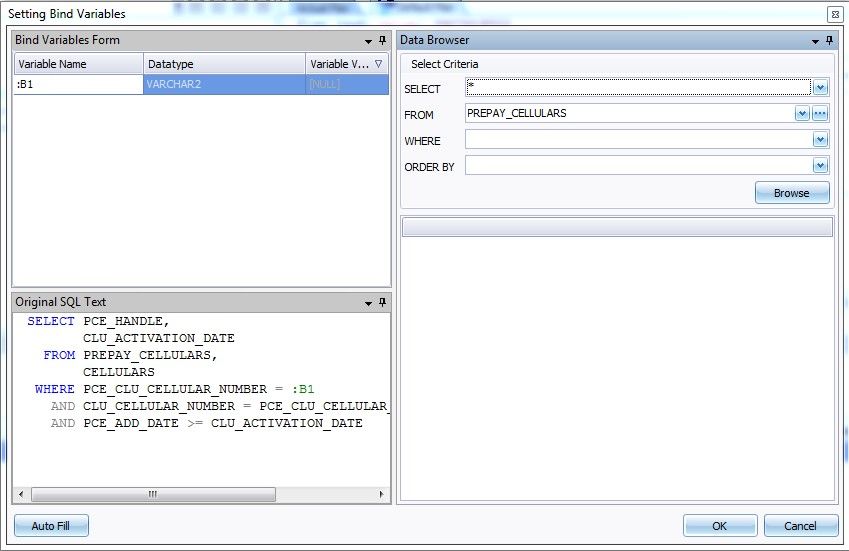
Figure 7: Setting Bind Variables Window
Since the query has a bind variable, a value must be set for the tests.
We can enter a value manually, or click on the “Auto Fill” button, which will look at the dynamic views for some recently used value if the query is still in memory. If it is not still in memory, we would enter the value manually.
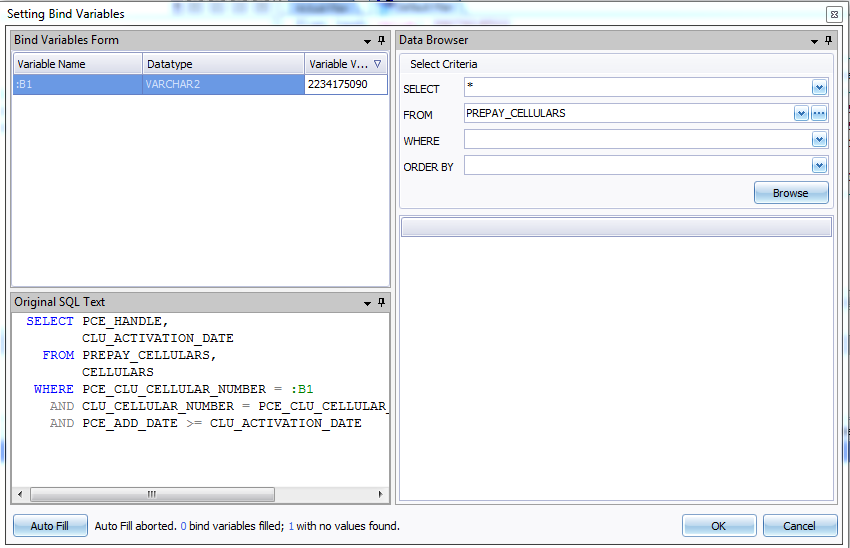
Figure 8: Add Bind Variable
And we click on the OK button.
The SQL Optimizer begins to generate all the possible alternatives to access the original SQL query according to the structure of the objects and the hints available in the database. Then, to find the best alternative, it compares the original SQL query with the first alternative presented by the tool. If the alternative is better than the original SQL query, a trophy is assigned by the tool and it continues to compare the winning alternative with the following alternative. If the alternative takes more than 5 seconds (criterion configured by default) to execute than the SQL query winner, Optimizer discards it as not a good alternative and continues comparing with the next alternative to the criteria previously selected by the DBA.
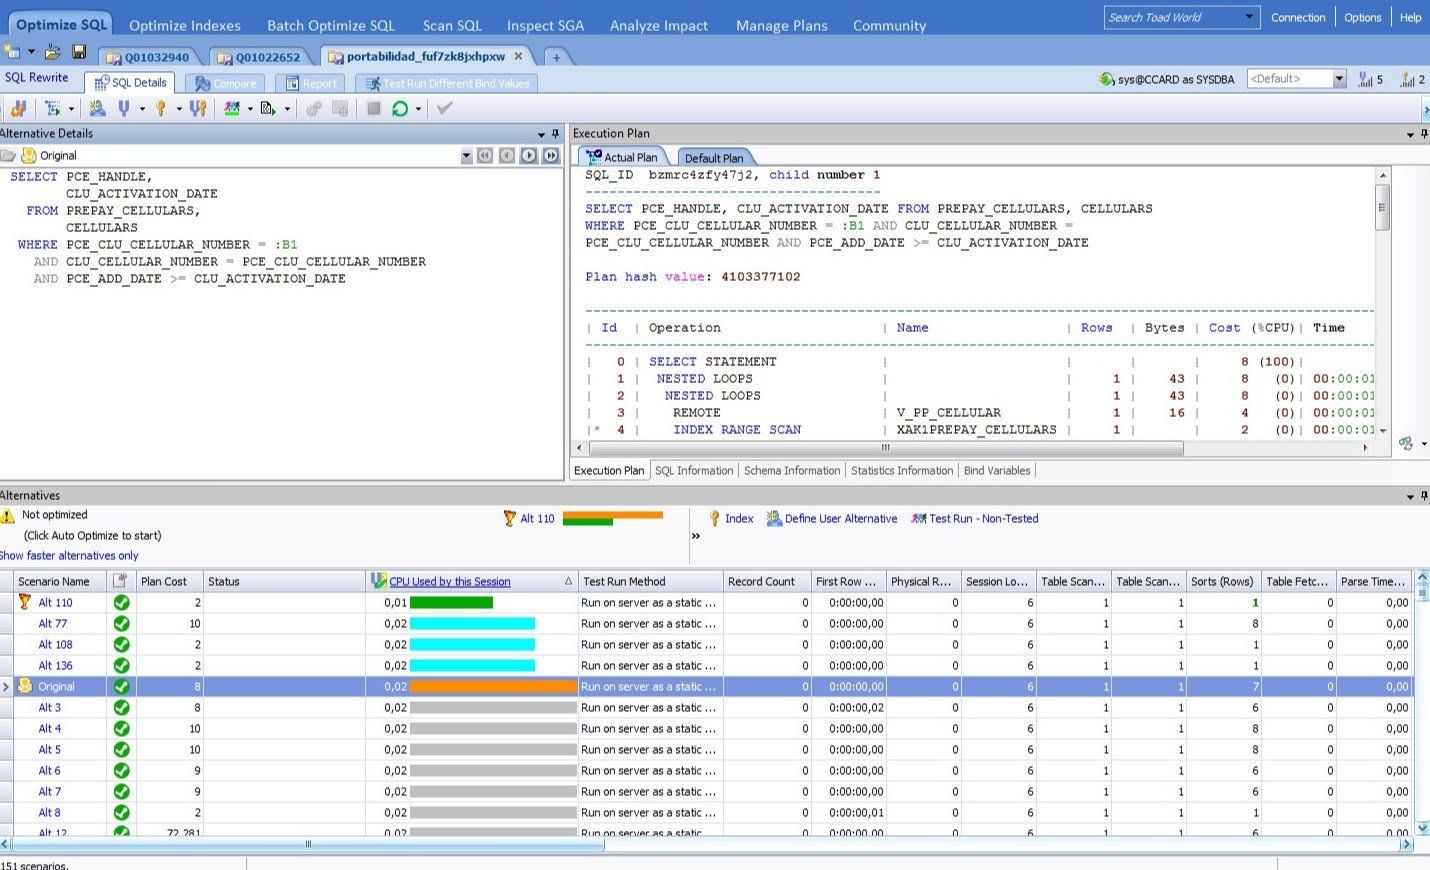
Figure 9: Looking for better alternatives for the SQL query
As we can see, the tool has generated 151 possible scenarios
After running each alternative, the tool decides that Alt110 is the best alternative, based on CPU times and elapsed time, criteria previously configured by the DBA
It’s very important to note that the tool has generated 151 alternatives of the original SQL query because the DBA has configured the Intelligence Level with a value of 5. This value in the tool is defined by default with a value of 2. That means that the tool generates all possible basic alternatives according to the original SQL query, but when the DBA configures the intelligence level as 5, the tool generates all the possible alternatives using all available hints of the database according to the structure of the objects of the original SQL query.
This is where we can see the great power of this tool. The DBA can manually create perhaps no more than 15 or 20 alternatives for this SQL query, and as we see, the tool can create a lot of alternatives not contemplated by the DBA.
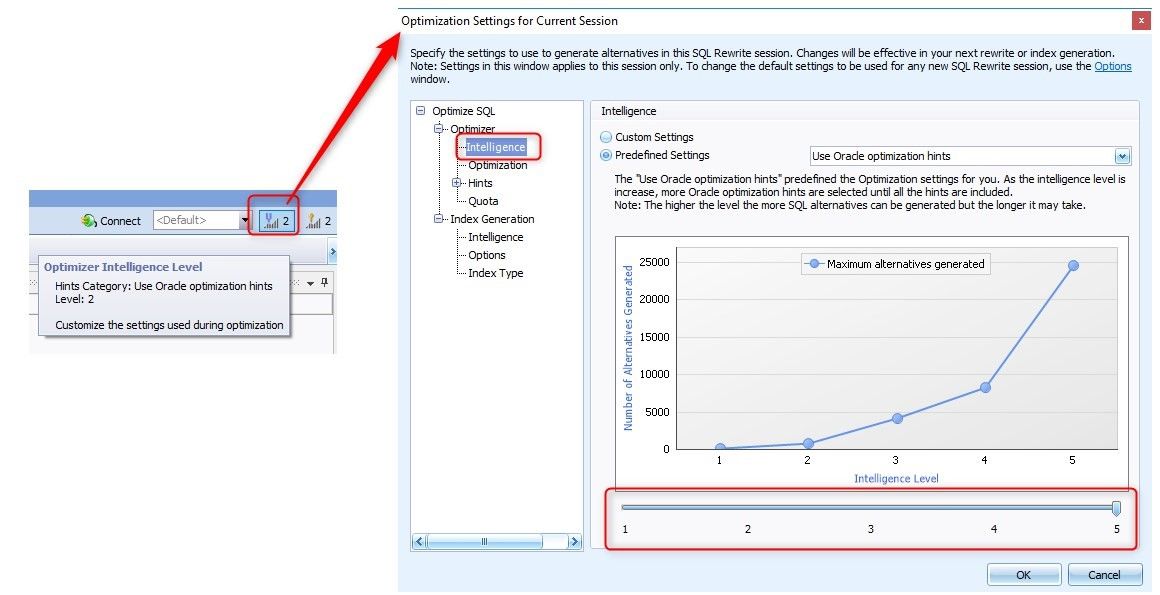
Figure 10: Settings for Current Session Window
In addition, the DBA has the option to use the "Test Run Different Bind Values" functionality, in which we can configure the loading of a file for several values of the bind variable/s. In this way we can make a real stress test in the database.
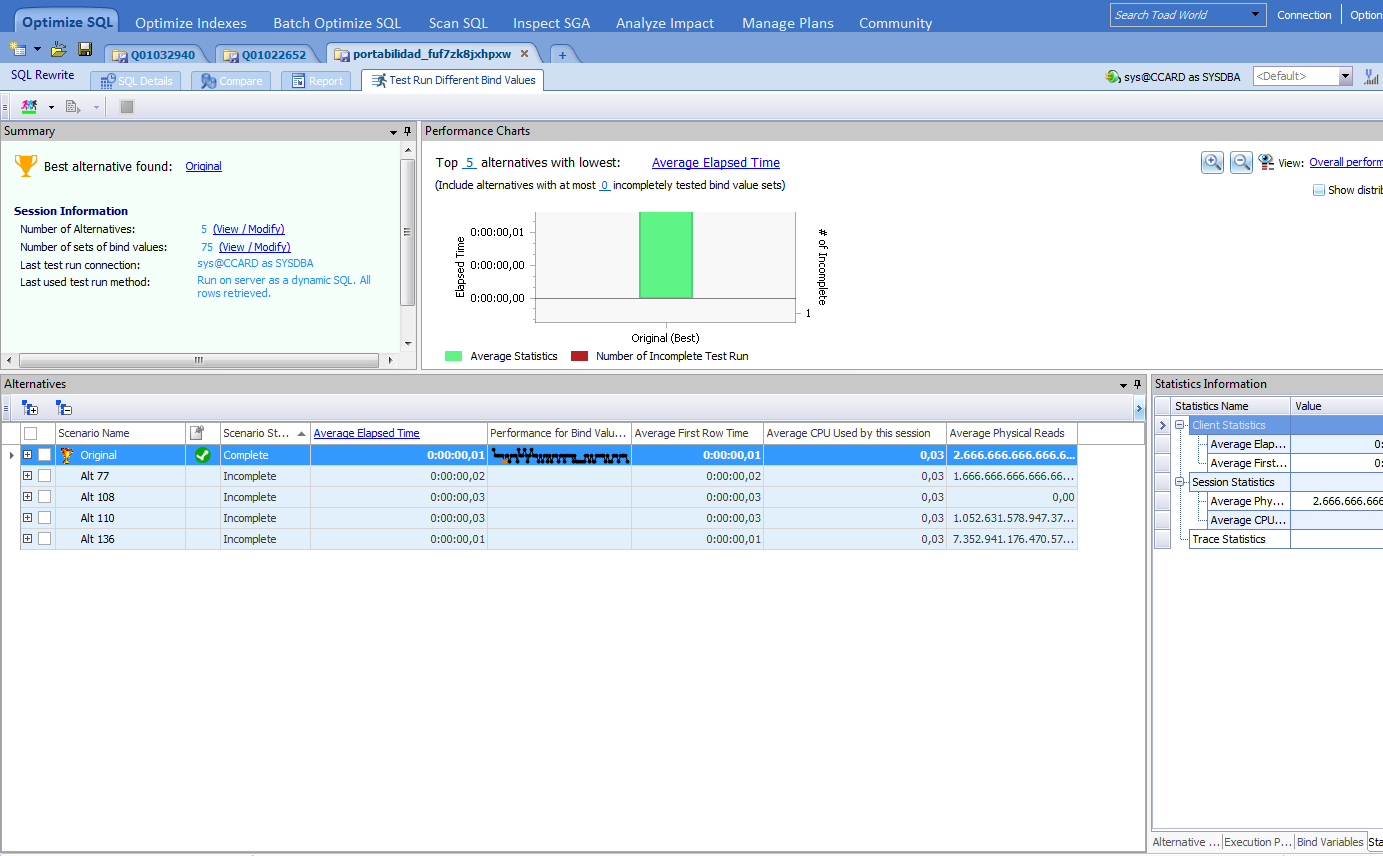
Figure 11: Test Run Different Bind Values tab
As we see after running the stress test, now the best alternative is the Original alternative, in average time and resources. If we display the alternative in the + sign we can see each individual statistic:
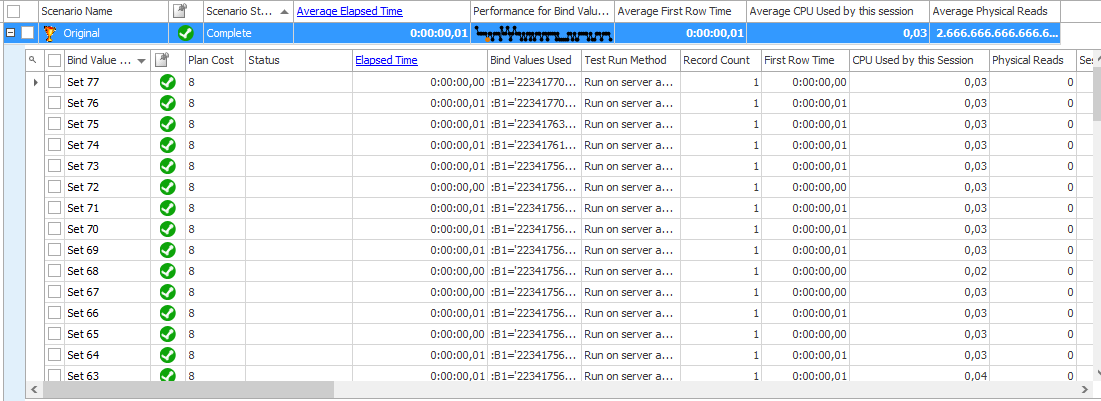
Figure 12: Individual statistics for the Original alternative
And, for alternative 110, we can see that in some data sets it could not be completed:
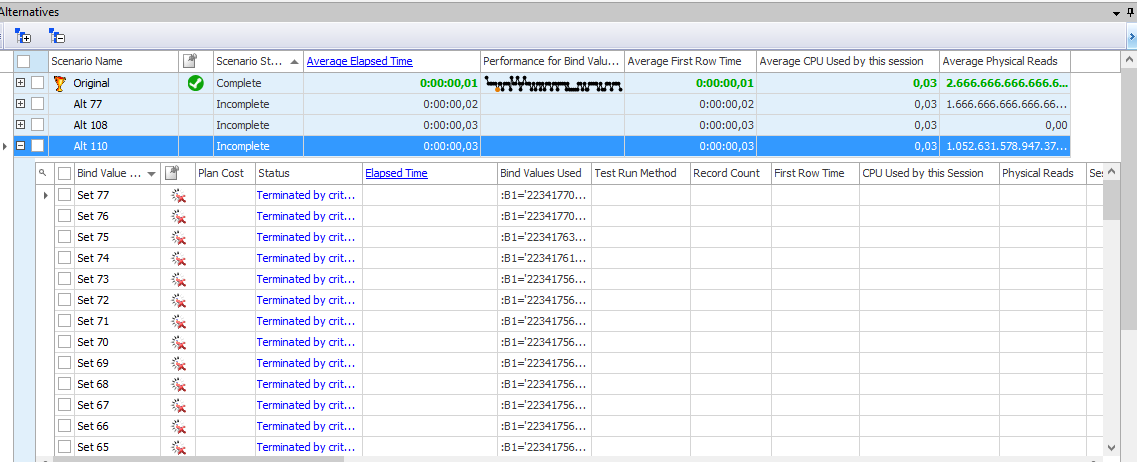
Figure 13: Individual statistic for alternative 110 (Alt110).
Now we can understand the importance of performing a stress test with a distributed data sample, to see what the actual behavior is and confidently determine the best execution plan for the query.
The tool also allows us to compare two alternatives in the "Compare" tab, and also allows us to generate a report in the "Report" tab.
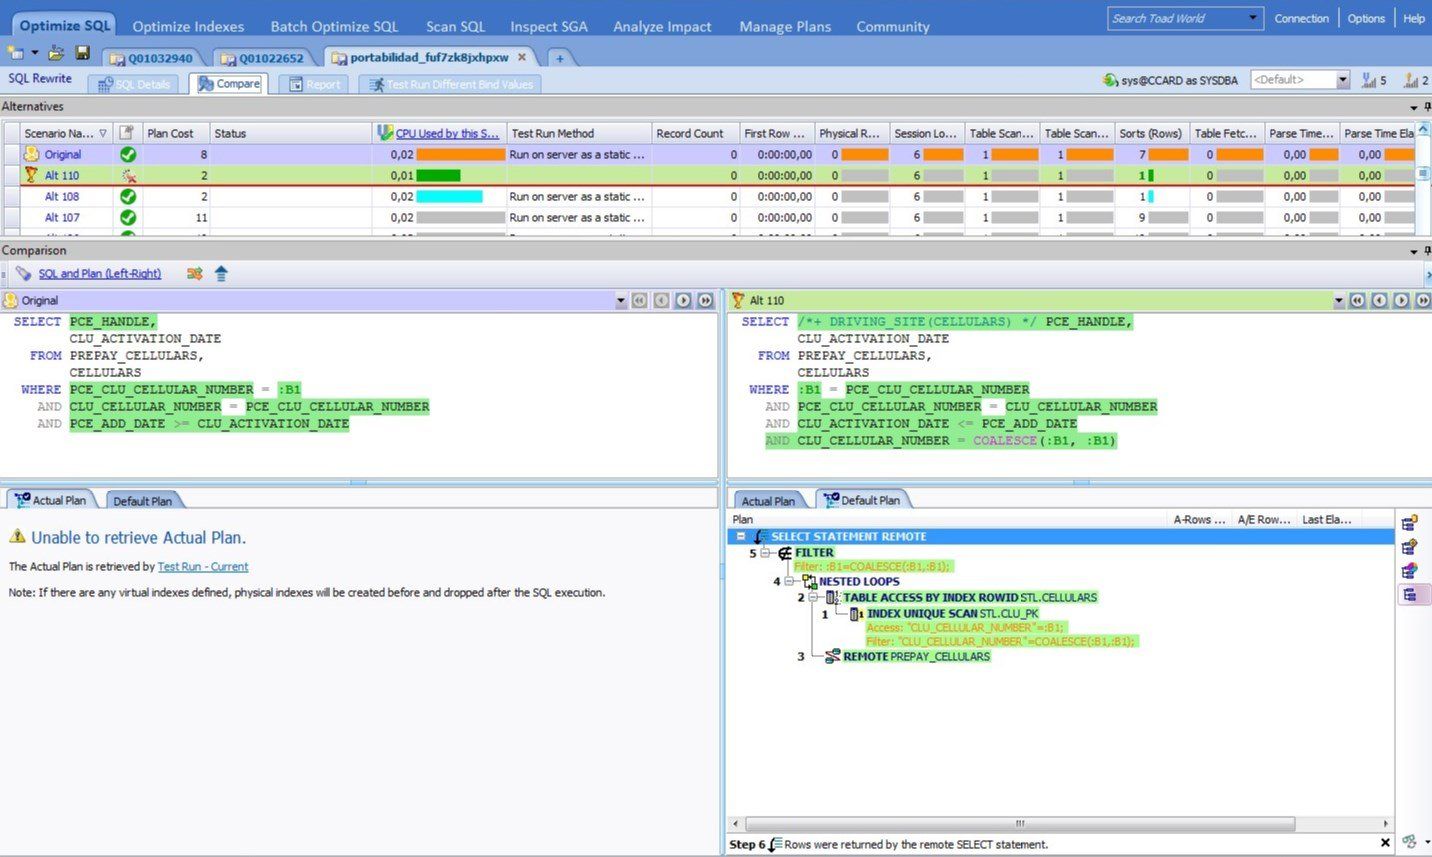
Figure 14: Compare Window
Conclusion
As we can see, the SQL Optimizer is tool that supports DBAs who are experts in tuning, providing alternative solutions and enabling stress tests of queries with real data. The DBA always has the final choice. If we wanted to perform the same tests manually, we could do them, but it would require much more time and effort, and we might miss a possible good alternative.
Also, a beginner DBA can use this tool to optimize their SQL queries, since the tool proposes alternatives to the original query according to the configuration criteria.
In sum, we can say that this optimization tool bolsters the knowledge and experience of the expert DBA, and gives guidance to the beginner DBA. If you would like to try SQL Optimizer for Oracle yourself, you can download a free trial here.
Start the discussion at forums.toadworld.com