
Based on my experience, I believe that Quest® Toad® for Oracle is the best SQL Trace analysis tool for SQL performance tuning. This blog, and related articles around using Toad for Oracle Expert Edition and Toad for Oracle DBA Edition will highlight the usefulness of Toad for Oracle for SQL performance tuning.

What is the 10046 SQL Trace File?
Within the scope of SQL performance tuning, SQL Trace has been around for a very long time. Toad for Oracle has great support for this trace file.
The trace file collects SQL statements as they are submitted for execution to the Oracle RDBMS. The SQL Trace includes all related information such as various timings (execute, fetch), row counts, total run times and more. The trace file also includes the wait events, or the work that the SQL statement has asked Oracle to do. When there is a performance issue, the DBA often looks at tools like AWR (automated workload repository; Toad for Oracle DBA edition also has a nice interface to this data) and can see the wait events that are keeping the Oracle database busy. SQL Trace allows for the SQL statements that are contributing to the wait event time to be captured.
The trace is created in a subdirectory where the Oracle software is installed. Typically. a developer does not have access to this trace file or may not even know the name of the trace file. Not a problem! Toad for Oracle retrieves and displays the trace file contents after the SQL is done executing.
The trace facility can be turned on and off. There is syntax to do this from within a program, from a command prompt, or from within Toad for Oracle DBA Edition. Why would you want this information for SQL performance tuning? To find the slowest SQL in a particular application. Trace can be turned on for the user session, for another session, or for the entire database (maybe Oracle Support might want this information). For the application user, turning SQL Trace on for an existing application experiencing performance issues allows for the SQL, all of its statistics and the executed Explain Plan to be captured.
Toad for Oracle TKProf Interface
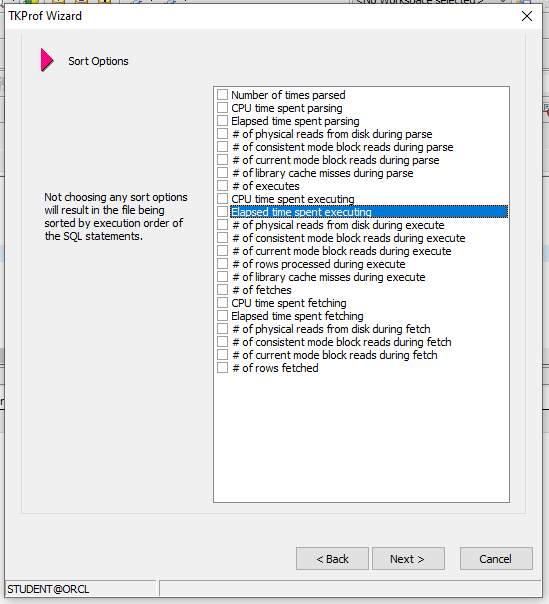
TKProf is the interpreter for this trace file. Toad for Oracle has an excellent interface to this command line tool called TKProf Wizard. This wizard can be started for existing trace files from the menu item Database à Diagnose à TKProf Wizard. In the illustration above, the sort options allow for the SQL within the trace file to be put into this order. For example, if you are looking for long executing SQL, you would sort by Elapsed Time Executing (highlighted above) and the trace file would put the SQL and its related data in this order.
Trace File Output
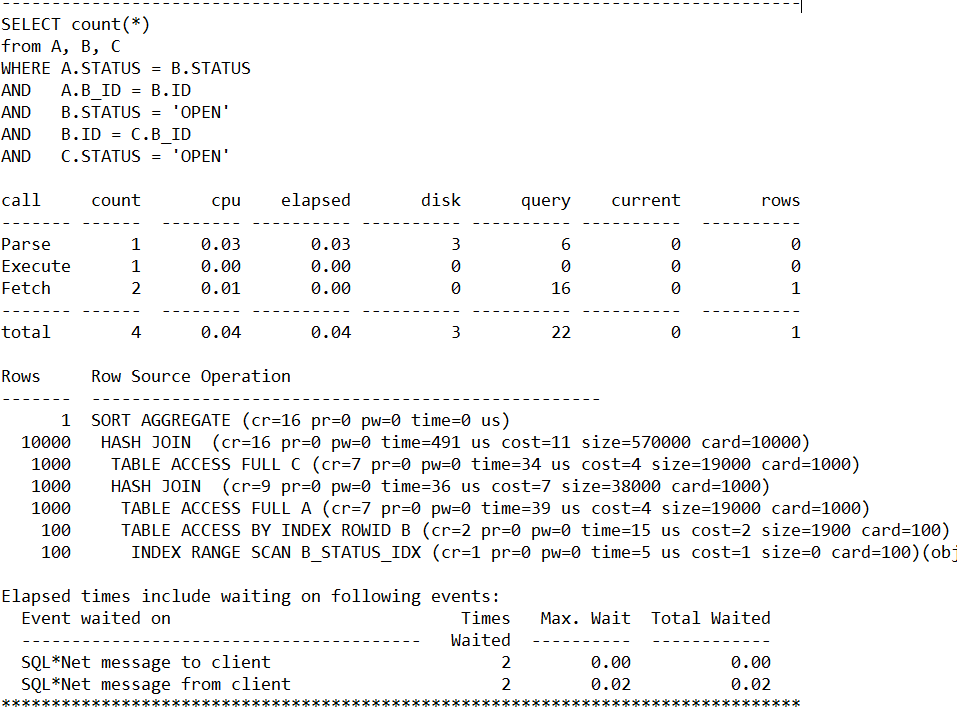
The above trace file shows the SQL statement, a grid of various statistics, the ACTUAL explain plan this SQL statement executed with (remember, pushing the Explain Plan button produces an Explain Plan but not necessarily the Explain Plan the SQL executed with), and the work this SQL statement asked the Oracle database to do, in the form of wait events.
The problem I’ve had with viewing a group of SQL statements in a trace file is that the longer-running SQL might not be what’s causing performance issues. The SQL Trace show the SQL and the wait events but does not organize them by wait events.
This is where the Toad Trace File Analyzer comes in! This is a magnificent piece of software that shows all the same info as the character-mode TKProf output, but in a graphical form so you can easily sort on the various statistics and see the SQL contributing to long-running wait events!
Toad for Oracle DBA Edition can run the SQL Trace and its associated TKProf interpreter with lots of options. I cover useful Oracle trace files in my SQL Performance Tuning course, onsite, remote, or video on demand.
Getting a trace file from the Editor window
Toad for Oracle has the ability to run a SQL Trace right from the Editor window. Again, this saves the hassle of using the command prompt with lengthy and error prone syntax for both starting/stopping the trace and for running the TKProf tool.
Trace file from Editor Window
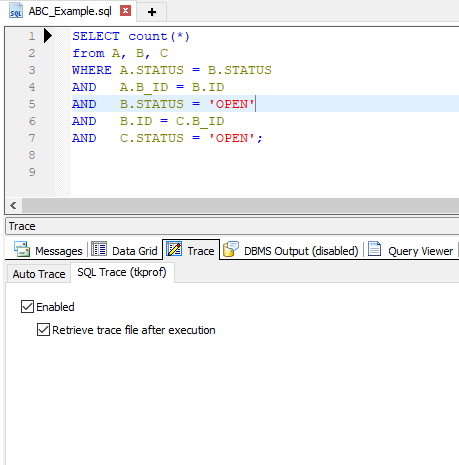
As shown above, this SQL Trace is for the single SQL statement in the Editor window. You have to go to the Trace tab and check both of these boxes before executing the SQL. Toad for Oracle will turn on SQL Trace, pull the raw trace file to your workstation, then run the TKProf interface.
Every Toad for Oracle (including the Base edition) has this trace file feature from the Editor window.
Getting a trace file from the Session Browser
There are times when it would be nice to capture a series of SQL from an application. This can be difficult to do from the command line but easy within Toad for Oracle. This technique is a good option for capturing SQL performance issues and for running and reviewing the SQL before putting code into production. If you can capture the SQL in a trace file, you can find the problem SQL and get useful statistics and valuable Explain Plans all at the same time.
Toad for Oracle DBA Edition Session Browser
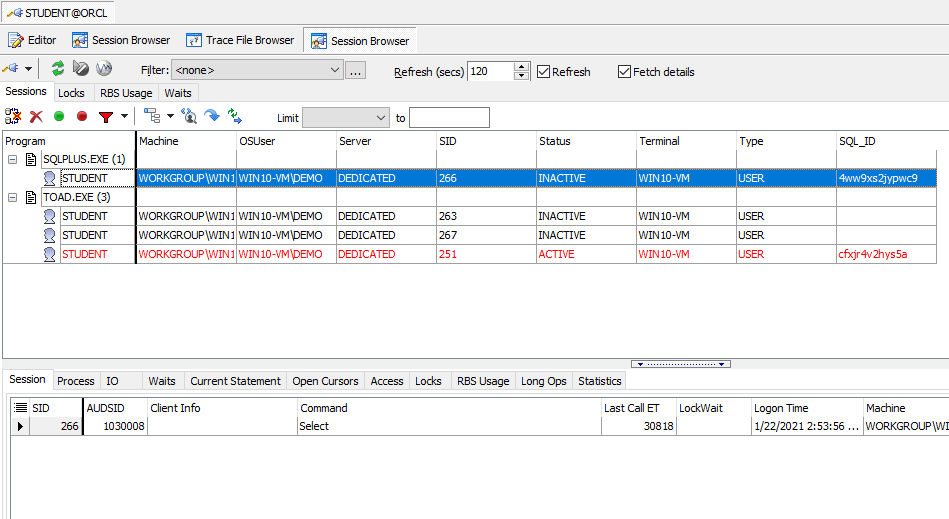
The Session Browser shows all the active sessions. Any DBA account has privileges to run this panel. The Session Browser shows the current executing SQL, a bit of SQL history for that cursor and more. The Session Browser is a good tool for someone to watch the SQL being executed when evaluating new application software. This tool is also valuable when trying to catch and solve performance issues.
The Session Browser can view lock contention, kill the session (with proper permissions of course) and turn on/off SQL Trace. This will capture all the SQL from this user session until the trace is turned off.
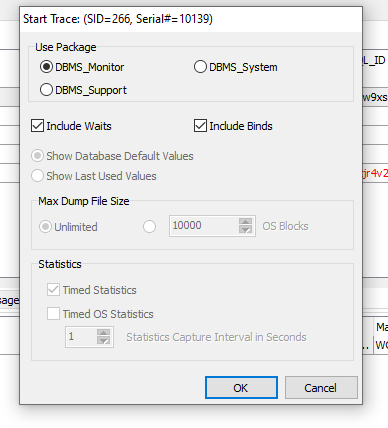
Turning on a Session Level Trace
Note the green and red buttons just under the tabs on the upper left corner. Also note the wait events tab, the locks tab and other useful session level performance information. The green button turns on trace, and will ask a couple of questions. I always select DBMS_MONITOR – this is the background tool that actually runs the SQL Trace. Also make sure that the boxes for Include Waits and Include Binds are checked.
Run your test or have your user perform their application tasks. The SQL Trace is collecting all of the SQL being executed.
Turning off a Session Level SQL Trace
When your test is complete, simply click the red button and Toad for Oracle will ask you if you want to retrieve your SQL Trace file. Click Yes. You can see above that my Toad for Oracle is the DBA edition because the Trace File Analyzer starts and the SQL Trace file is loaded. In this example, I have a command line SQL*Plus session going. I turned on SQL Trace using the green button, I ran the ABC example SQL we have been using in these lessons, then I turned off the trace using the red button.
Using this interface, you can sort the SQL easily, you can see the wait events and view the SQL that is associated with those wait events. Notice at the bottom, you can see the path and trace file name that was created by your request.
Using the Trace File Analyzer
Toad for Oracle DBA edition comes with Trace File Analyzer. When I review SQL Trace files, I usually have a wait event from either Stats Pack AWR, or the above-mentioned Session Browser as there is an overall performance issue. I can turn on SQL Trace to capture the session causing the issue. I then need to be able to see the SQL that contributed to the wait event.
The TKProf interface is good but it is old-school character-mode. You have to run it with different sort options to trickle problem SQL to the top. It does not organize SQL by wait events.
I was going to write such a tool myself. I was sharing this with a friend on the Toad development team at the time, and lo and behold, the next release of Toad for Oracle had the Trace File Analyzer! I don’t know if I influenced this tool (I have contributed useful tips to Toad for Oracle that have appeared in the tool) but this was an amazing coincidence.
Using Trace File Analyzer
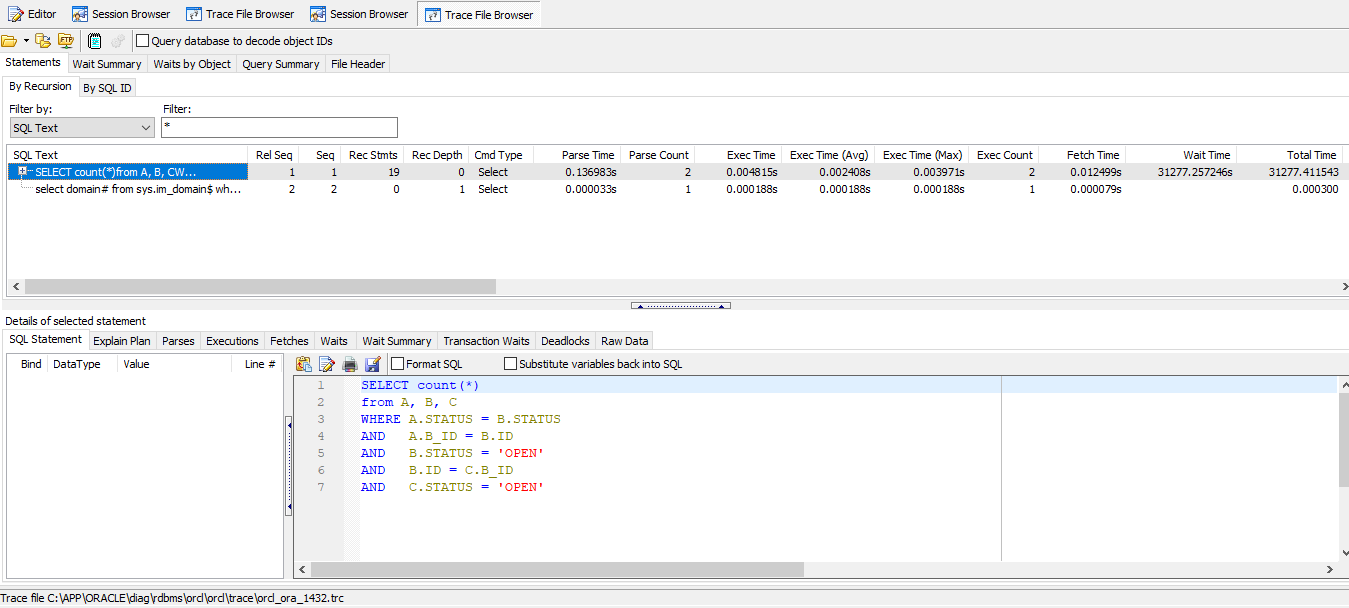
You can run the Session Browser to capture application SQL or you can use the ‘Open File’ button in the Trace File Analyzer to open an existing SQL Trace File as I did here. To access either the TKProf Wizard or the Trace File Browser, use the menu item DatabaseàDiagnose.
I clicked on the ‘Total Time’ on the end and immediately bubbled the long-running SQL to the top. Sure, you can do this with the old school tool, but now I can explore the tabs in the middle to figure the issue with this particular SQL statement.
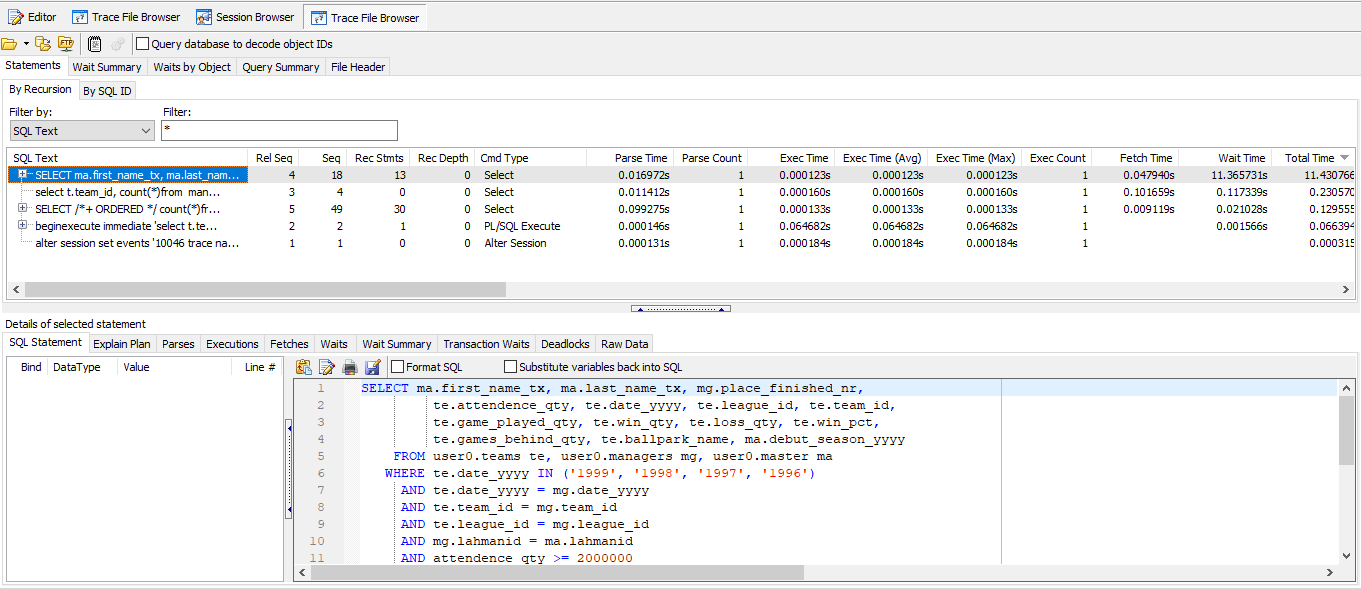
Finding Problem SQL using Trace File Analyzer
This is the panel I need to properly and quickly find the problem SQL. I know the wait event that Oracle is working on and using a lot of time on, so I go to the wait event tab and it shows me the SQL that contributed to this top wait event. Notice in the lower area, the Total Wait Time is displayed (you can sort on any of these columns by clicking on the header) and has the SQL.
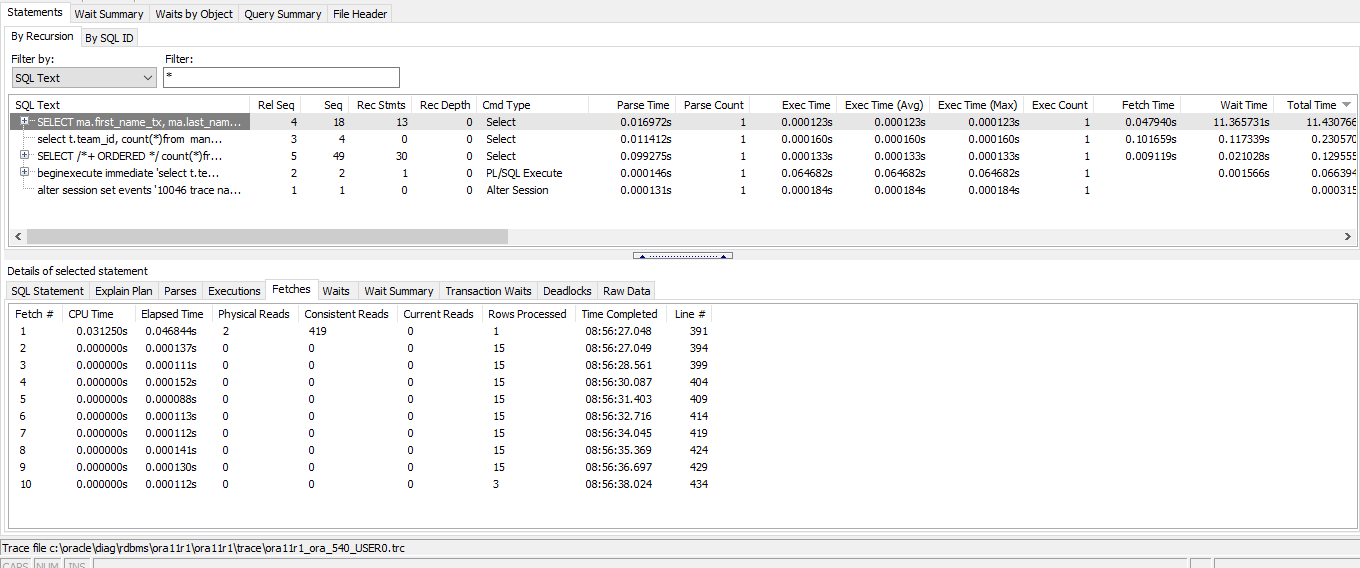
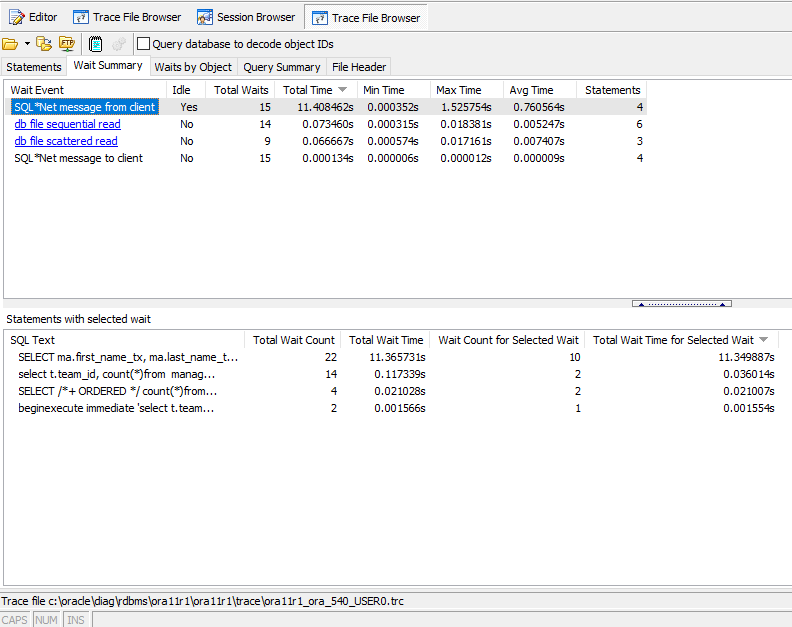
Drilling down on the Problem SQL using Trace File Analyzer
The SQL*Net Message from Client wait event is the request of data being sent back to your application, in other words, fetches. You click on the SQL in illustration 8 and Trace File Analyzer takes you to a panel with the SQL that contributed to the wait event. Now, I can either hop along these tabs in the lower section or, because I know this wait event is related to data fetches, I go to the Fetches tab and I can see my SQL is only requesting 15 rows at a time. Round trips to the database for small amounts of data are time consuming.
Get Toad for Oracle Base Subscription todaySubscription / eStore: buy up to 10 licenses at a time, get auto update, support, announcements/invites to education. Talk to our professionals: demos, custom solutions, volume discounts. Not ready to buy? Get Toad for Oracle a 4th way … try it free for 30 days. |

This SQL was executed in SQL*Plus, so I go to SQL*Plus and bump up the Array Size setting and this problem goes away. In PL/SQL, you use a collection and bulk collect at least 100 rows at a time. In PL/SQL, this wait event typically shows up if you are doing a lot of ‘row at a time’ processing.
Closing
Toad for Oracle DBA edition has the best tool when it comes to SQL performance tuning – the Trace File Analyzer. Without this tool, you are just guessing as to what the real SQL performance issue is in your SQL Trace file.
Related information:
Blog: SQL query optimization: Level up your SQL performance tuning
Webinar: Boost Database Performance with SQL Optimizer in Toad® for Oracle Xpert Edition
Webinar: Banish Bad Code with Toad® for Oracle Pro and Xpert Editions
Blog: SQL performance tuning using Toad® for Oracle Base Explain Plan
Blog: Lucky Breaks While Performance Tuning Oracle
Blog: 9 blogs to help tune your most challenging SQL Statements
Blog: What is automated SQL tuning? Time saving DBA tips.
Blog: The performance teeter-totter—Toad Turnpike: Real stories from the road
Quest Blog: Why SQL Performance Tuning is the Most Important Database Management Skill to Have
Quest Blog: 10 Database Tuning Best Practices
Check out Quest Toad for Oracle data sheet: Which Toad for Oracle Edition is right for you.
Check out Chapter 10 “Toad as a SQL Tuning Tool” in Toad for Oracle Unleashed.
Check out the Oracle Documentation on Additional Wait Event Information.
Check out the Oracle Documentation on SQL Trace Files.
Check out Toad World blog video posts on SQL Performance Tuning using Toad DBA.
Have questions or comments?
Head over to the Toad for Oracle forum on Toad World®! Chat with Toad developers and lots of experienced users.
Help your colleagues
If you think your colleagues would benefit from this blog, share it now on social media with the buttons located at the top of this blog post. Thanks!
Dan Hotka has several course offerings in and around SQL Performance Tuning using the Toad for Oracle suite.
Start the discussion at forums.toadworld.com