This article is focused on Monitoring and Troubleshooting of Data Guard configuration using the GUI method i.e. Enterprise manager 12c(cloud control), Here we will go through with Data Guard Administration, Viewing the Data Guard performance, Verifying the Data Guard configuration and Data Guard log files. These all are covered using completely EM method.
Enterprise Manager
EM cloud control allows a graphical user interface (GUI) for monitoring the whole Data Guard. EM12c provides a wide range of features to manage Servers, Oracle database and even more non-Oracle databases. With the EM it is very much possible to create new standby for the primary database, Checking Standby database progress summary, configuring the Data Guard options like Real-Time Query, Flashback, and Enabling/Disabling Broker so on and including monitoring the Data Guard Configuration. At the higher level EM supports to perform switchover, failover, converting physical standby to snapshot standby and vice versa and there is no surprise that EM also supports with Logical standby database and Checking bottleneck of performance issues related to Data Guard with all graphical interface and easily understandable. Please note that EM is an extra license.
This article is not covering how to add standby database or any switchover/failover tasks or configuring the Data Guard, its dedicated to Monitoring and Troubleshooting Data Guard. FYI I've used Data Guard with Far sync using broker – 12.1.0.1 and EM12cR4.
Data Guard Administration
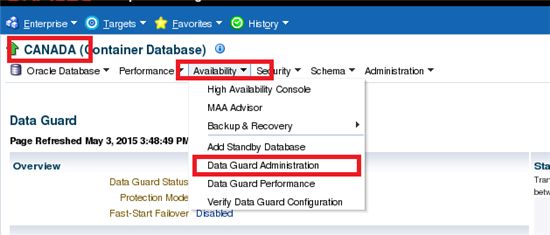
Data Guard Administration is the main access to Check the Data Guard status or to manage the configuration, To access this console First we have to login to the Database Page(Ex: Primary – Canada) From the High Availability Tab we can click on Data Guard administration like below. We can say this is master console for Data Guard administration using EM.
Please note that in this article CANADA is a Primary database and INDIA is a Standby Database
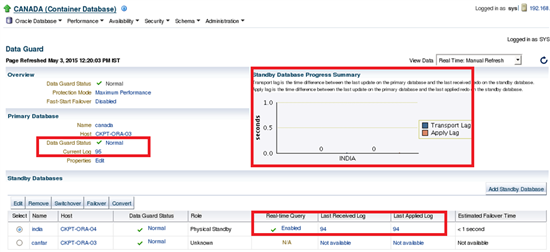
This page provides us enough information to know about your Data Guard. They are…
- Checking the Data Guard Status, under what protection mode is Data Guard functioning such as Maximum Performance or Protection or availability Modes. We can change protection mode from the console too.
- We can check what is the current log sequence at primary database and what is the received and applied sequence on Standby database(s)
- Whether the Standby database is Real-Time query enabled or not
- One more beautiful graph with overall status like there is any Transport lag or apply lag with the accurate seconds of lag.
- Easy to Edit the configuration of Standby databases can be easily modifiable such as enabling/disabling Real-Time query, to Enable/Disable Recovery (MRP) and Enable/Disable Data Guard Broker.
- As mentioned above this page also have high level administration tasks such as Switchover, Failover, and Converting Standby to snapshot, Adding Standby databases.
Troubleshooting Data Guard
The above section describes how to monitor, analysis the current status of Data Guard, It is important to deal with EM in case of any issues with the Data Guard configuration. If we found any issues at the Main Page of Data Guard administration of "Standby Database Progress Summary", Then we need to check whether it's an issue with the transport or the issue with the apply process. It can be easily identified with the colors provided with the graph.
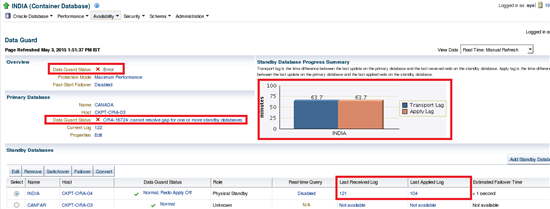
If you look at above picture,
- it is clear that Data Guard status is in error at Standby database
- The Primary Database Data Guard status is remained with error "ORA-16724: cannot resolve gap for one or more standby databases"
- From the Standby Database Progress summary we can see the peaks of both Transport and Apply Lag over standby database with 63+ minutes.
- From the Standby Databases we can find more information of what is the Last Received log(121) and what is the last applied log(104
So we have enough information that last applied log is 104 and later there are no archives applied, so we can assume that we do not have sequence(s) from 105.
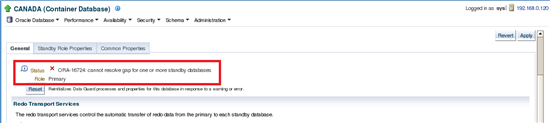
From the Primary database the error number ORA-16724 is also referring to the GAP resolution issue of Standby database. There may be many circumstances why gap took place that can be because of the archive which was deleted before shipped to standby, bandwidth issue, I/O issues or background process mechanism.
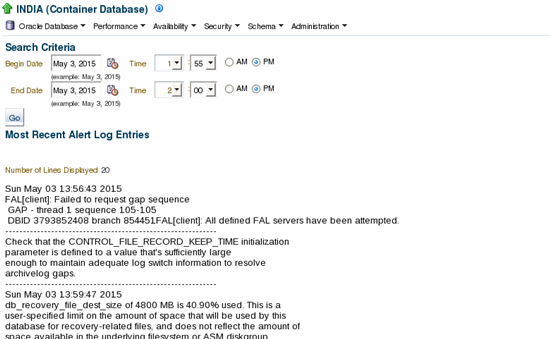
In order to check what are the log sequences available and applied on standby we can review the log status as well. It can be obtained by clicking on "Last Applied Log" of Standby database from the Data Guard administration console.
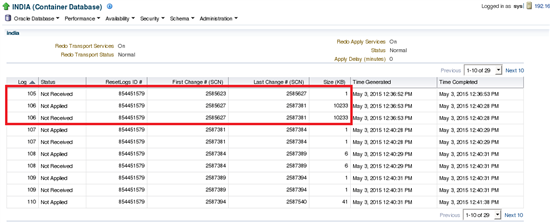
So from the Standby database logs it's clear that there is no sequence is received from the primary. So to identify the root cause EM helps more than what is required, later to fix the issue we need to handle how to resolve gap whether from Archive log backups or from alternate standby database (if available) or recovery of standby database from Primary so on.
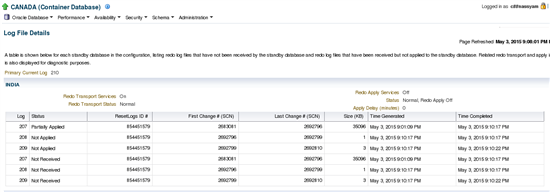
Apart from the above procedure, we can also use with another easiest way for log files information by navigation “Data Guard Administration –> Log File Details”, It is more simplified and we can see which sequence was partially applied, which are not applied and much more.
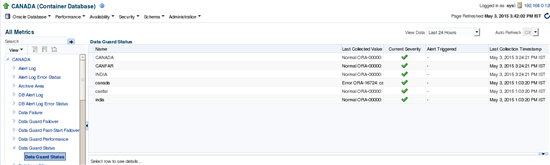
Data Guard Status From Metrics
There are many ways to check the Data Guard status from EM12c; we can directly go to Metrics page or "Data Guard –> Data Guard Performance –> Click on Status 'Normal ' “. It provides more information with current severity based on the collection timestamp.
Data Guard Performance
In order to measure the performance of the Data Guard, how much redo was generated , how fast is apply rate on standby database you may have to use various views, but with EM it is so simple to deal, with simple navigation "Availability –> Data Guard Performance"
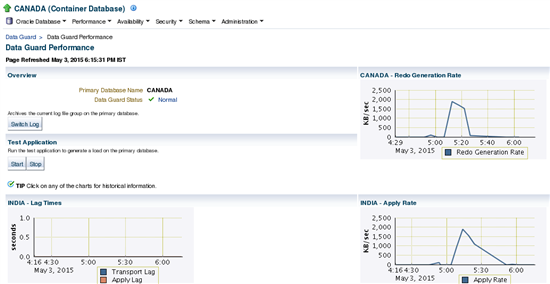
Data Guard Performance console provides detailed performance related statistics of the configuration, current status of Data Guard, ability to test the log switch on primary database and see how is the transfer rate, and the more beautiful option is to test the application. By testing the application, it generates load on the primary database for the more interactive troubleshooting. It has own ability to refresh for every minute and of course we can change the interval. Redo Generation rate, Apply rate is measured between the time and the KB/second where the LAG of standby is measured in terms of seconds.
In fact the chart provides information from past 2 hours, if we want to review the historical information, then we can fetch them by clicking on each report. (Like below)
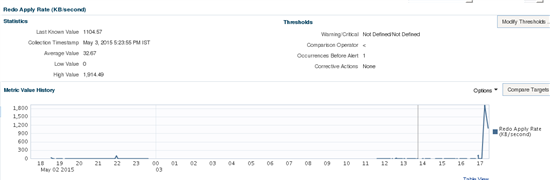
Redo Apply Rate
Apply rate statistics are applicable only for the standby database, it refers amount of redo data applied since the last refresh (based on interval)
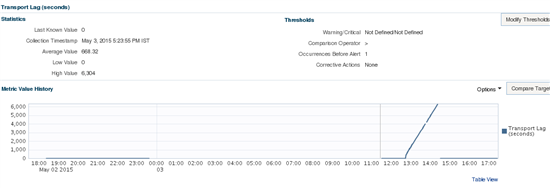
Transport LAG
LAG refers to the average number of seconds the standby is behind with primary and eventually we can say which can cause data loss.
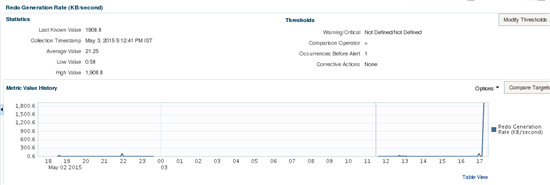
Redo Generation Rate
This static refers to how much redo was generated.
Verify Data Guard Configuration
Usually Data Guard configuration verification is kind of health check of Data Guard, it does many things like performing complete health check, verifying the FSFO status, determination of protection mode, availability of standby redo log files, Data Guard status whether valid or not, After the log switch whether the sequence is shipping to standby or not and Data Guard properties. To initiate Data Guard verification Navigation is "Availability –> Verify Data Guard Configuration"
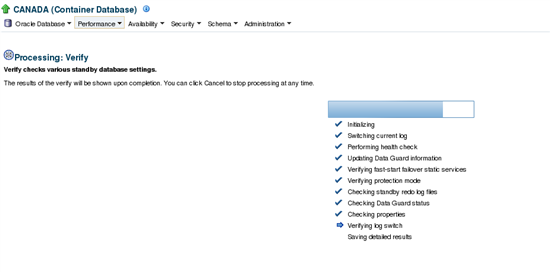
When the Verification is completed, Console provides detailed results and the recommendations as well for example: Add Standby redo log files on Target, Use preferred named credentials so on…
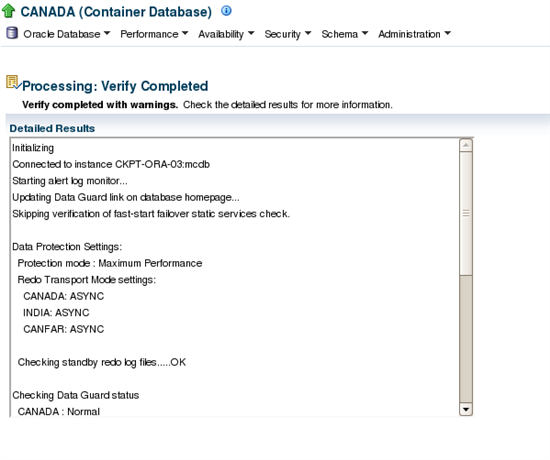
Complete log of "Verifying the Data Guard Configuration"
Initializing
Connected to instance CKPT-ORA-03:mcdb
Starting alert log monitor…
Updating Data Guard link on database homepage…
Skipping verification of fast-start failover static services check.
Data Protection Settings:
Protection mode : Maximum Performance
Redo Transport Mode settings:
CANADA: ASYNC
INDIA: ASYNC
CANFAR: ASYNC
Checking standby redo log files…..OK
Checking Data Guard status
CANADA : Normal
INDIA : Normal
CANFAR : Normal
Checking inconsistent properties
Checking agent status
Checking applied log on INDIA…OK
Checking applied log on CANFAR……..WARNING:
Timed out after 60 seconds waiting for log to be applied.
Processing completed.
Data Guard Diagnostics
When working with manual procedure the very first preference is viewing alert log, we can view the alert logs of either primary or standby alert logs directly from the EM.
Navigation: “Data Guard Administration –> Edit Primary/Standby Database Properties –> Diagnostics”
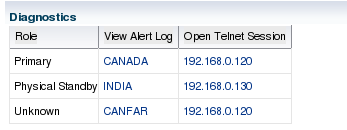
It allows us search criteria, so that we can pick from and to date for the alert log information.
Conclusion
We have seen how to monitor and troubleshoot Data Guard using Enterprise manager and various options available to administer the Data Guard related tasks such as day to day Administration, configuring Data Guard, managing Data Guard, Performing role transitions, Viewing real time statistics of redo apply rate, redo generate rate. EM allows us to verify the Data Guard configuration so that it makes life easy before performing role transitions, Checking Data Guard status and recommendations with a single click.
Start the discussion at forums.toadworld.com