
Trying to track the root cause of a slow running window or process?
A question I often hear from all kinds of Toad® for Oracle users, from DBAs to developers, is: “How do you find out what queries Toad runs to populate its windows and menus?”
You may be wondering why someone would need to know that.
Well, sometimes a window or process in Toad (or other applications) seems like it’s running slow or could even be locked up. Being able to identify what queries are running to populate windows and menus can help you determine if that, truly, is the source of the problem. Sometimes the query is trying to access a table you don’t have permissions for and you’ll need to know what table that is in order to get the right permissions.
Besides being able to find out what queries your applications are running, being able to see error messages from the Oracle database can be a key identifier in your quest to track why a window or process is slow running and other issues in Toad or your Oracle applications. Being able to see this information in real time is even better.
If you are ever in scenarios like these, keep reading to discover a Toad feature that is very handy to get to the root of the problem, quickly and accurately—and in real time. Then, try out this Toad tutorial. Don’t have Toad for Oracle? Download a free trial now.
Toad SQL Tracker feature can troubleshoot issues and identify error messages
Toad installs a tool that not a lot of people know about called SQL Tracker. It monitors in real time the SQL statements being sent from your computer over the Oracle client and to the Oracle database. This includes Toad as well as other applications on your computer using the Oracle client. It will also let you know if there is an error message from the Oracle database due to that query. This eliminates the need to turn on full Oracle tracing for some Windows applications.
By understanding the queries being sent and the response from the Oracle database, this can help you understand why Toad, or whatever tool fired off the query, is having problems.
You can take a query displayed from SQL Tracker and copy it back over to Toad and run it as a test, or pop it into the SQL Optimizer* for tuning.
This may help you identify tables you don’t have permissions for. Perhaps the column in the query does not exist? Maybe you’re running a function that doesn’t exist in your version of that application.
Here are some key features of the SQL Tracker:
- Displays SQL statements that come from processes in real-time, eliminating the necessity to turn on tracing and investigate poorly formatted trace files
- Displays logon attempts, both successful and unsuccessful
- Displays values of bind variables for SQL statements
- Displays statements that fail to execute with the Oracle error code and message
- Enables copying and pasting of statements to your SQL analyzing tool
- Monitors applications like Import/Export, SQLoader, Server Manager (svrmgrl.exe), as well as applications written with Oracle Forms or Pro*C
How to use the Toad SQL Tracker feature
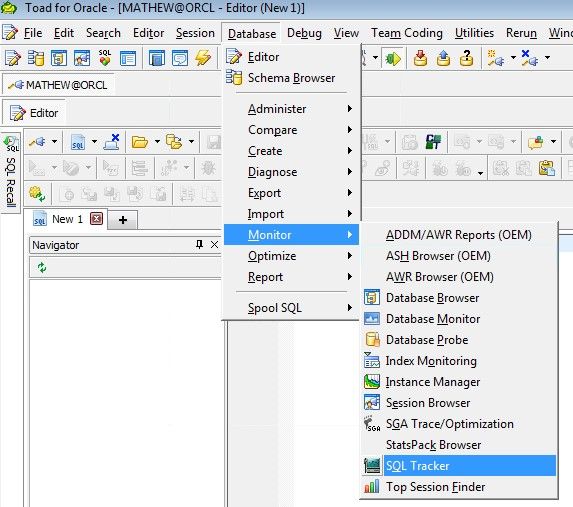
- Launch SQL Tracker from inside of Toad for Oracle. Go to the menu Database | Monitor | SQL Tracker.
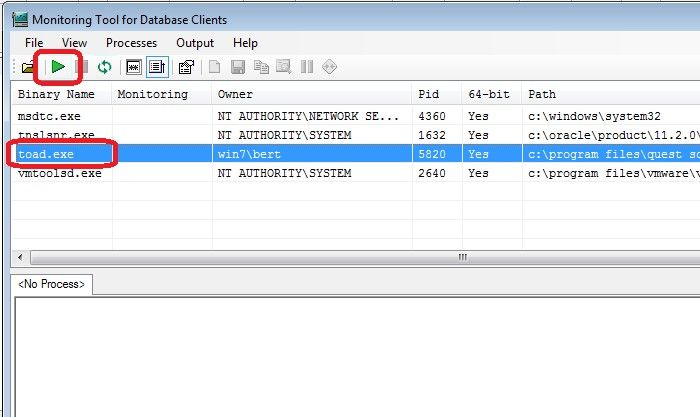
- Locate toad.exe or other application you want to track. Left click on the name of the executable then click on the green play icon at the top. If successful, you’ll see it say “Yes” in the column labeled “Monitoring.” If you don’t see your application, you can click on the green refresh icon on the toolbar.
- Now go back to Toad and repeat the steps that lead up to the issue.
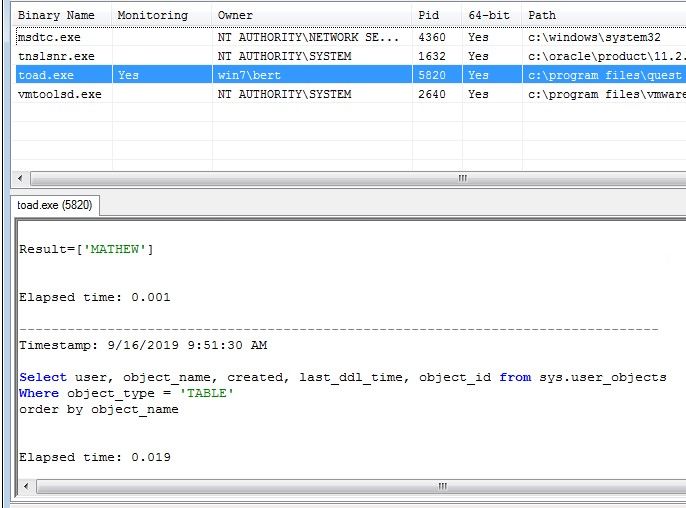
- Switch back to SQL Tracker and you’ll see that it has captured the queries running from the application along with helpful information like error messages and bind values for variables and elapsed time.
- The information collected by SQL Tracker should help you understand what the target application is doing. Review the SQL, test it in Toad, or talk to a DBA for further analysis.
This SQL Tracker video from Quest® support engineer Marvin Maula goes over more details of setting up and tracking Toad with SQL Tracker as well as an example scenario of how you may troubleshoot issues like items not appearing in the Toad Schema Browser and issues connecting to a database.
If you need to track a session running on another computer, you’ll want to use something more advanced like the Session Monitor utility in Toad for Oracle or running on Oracle trace. This would require more powerful privileges on Oracle views a DBA may need to grant you.
Lastly, note that SQL Tracker is a free utility that is made available with a licensed copy of Toad and additional Quest Software products. Quest Software reserves the right to remove, change, or alter this utility at any time.
Free trialIf you don’t have a license of Toad for Oracle, grab a free trial of the latest version. SQL Tracker is included along with all of the Toad for Oracle standard tools and utilities in the Base edition and higher. |
Have questions?
Click Start Discussion and this blog topic will be transferred to the Toad World Forum.
*Denotes feature is available in Toad for Oracle Xpert edition or higher.
Start the discussion at forums.toadworld.com