Memory usage, database parameters and options, user session information, and rollback activity. These are just a few of the things that you are responsible for.

As a DBA there is a lot of activity that you are responsible for.
In this series of blogs I will show you how Toad® for Oracle can help you monitor database activity and report on these activities as well as many more.
Let’s get started.
Monitor – Database Browser
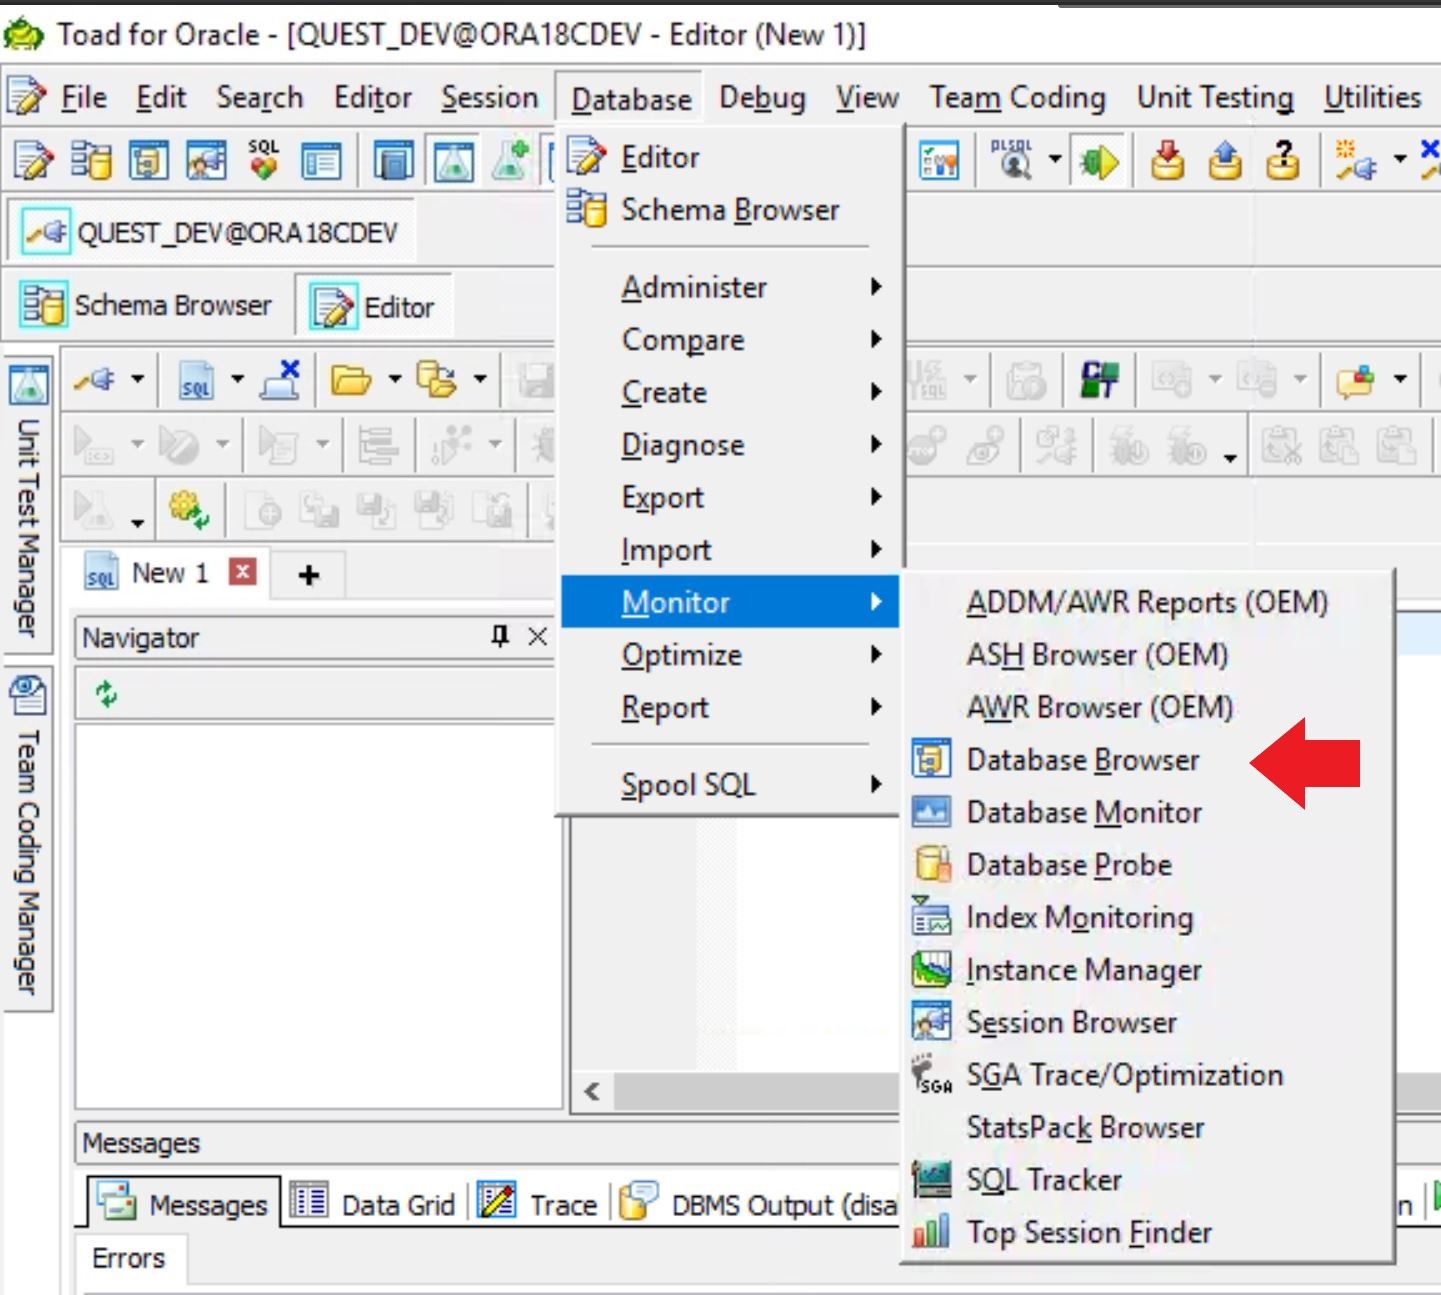
Under the DATABASE dropdown you will see several items. We are going to focus on MONITOR – Database Browser. There are a lot of other options under the DATABASE dropdown and I will cover these in future blogs so stay tuned.
Once you choose the Database Browser menu item you will see the following screen:
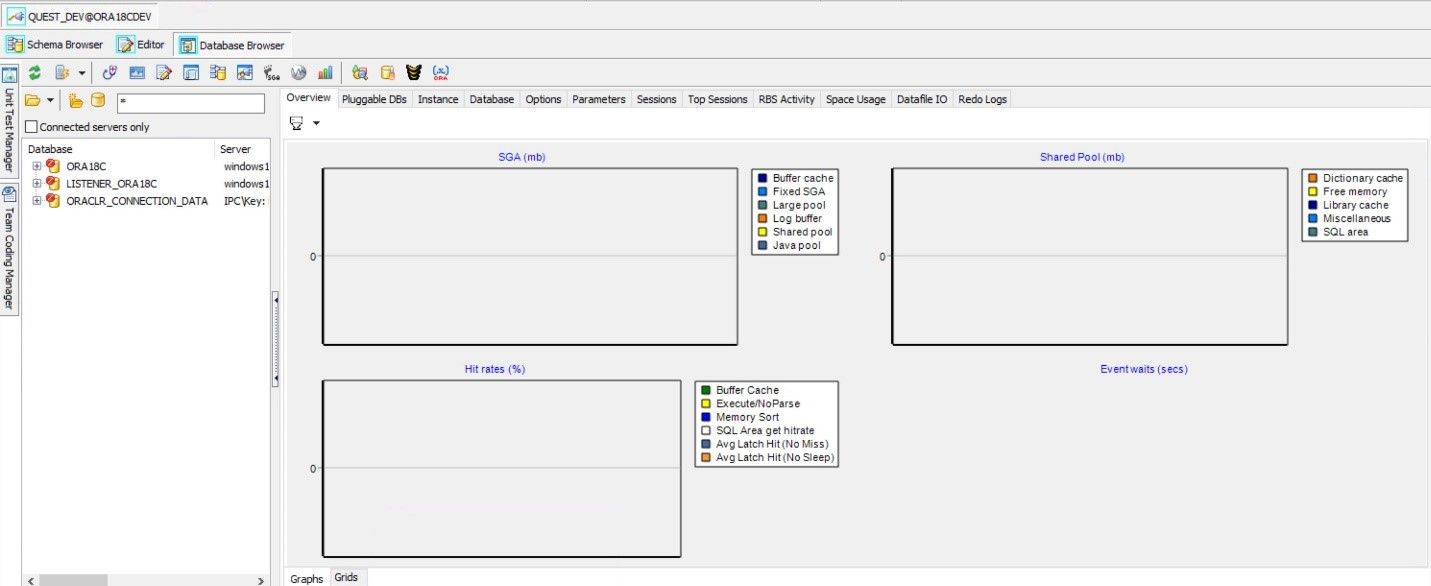
On the left side you will see your database connections. I will be using the ORA18C database. Simply double-click on the database you want to work with and you will see the following screen:
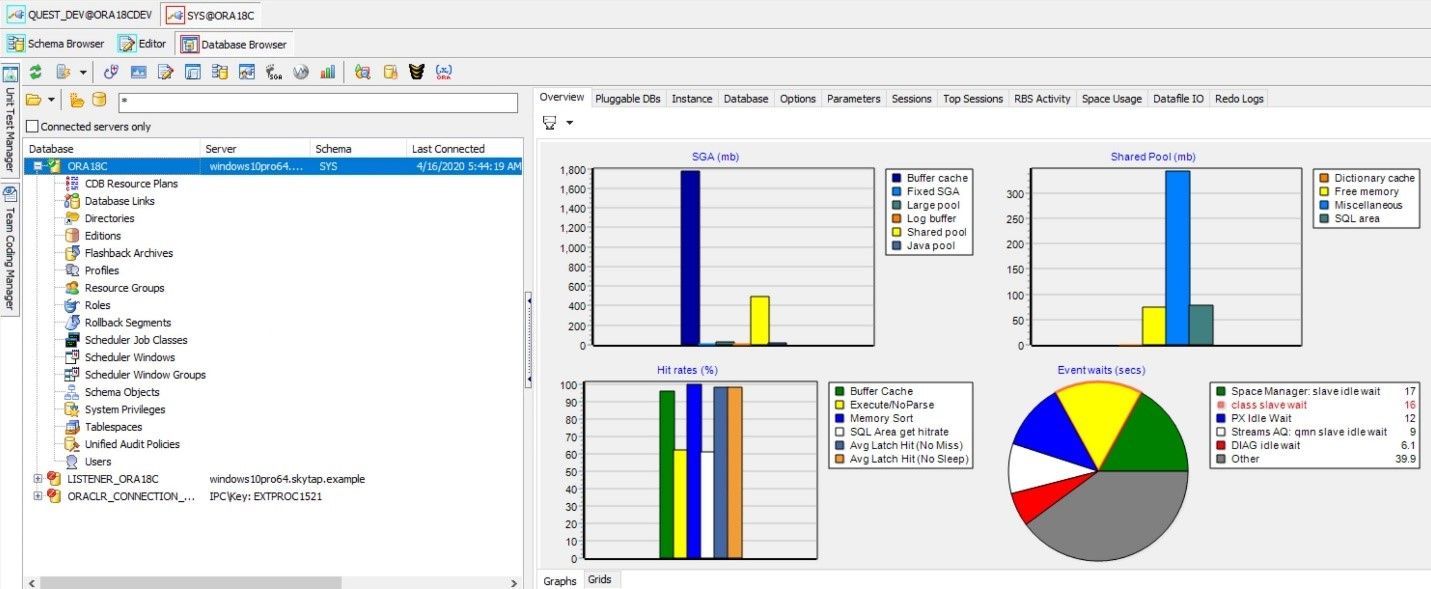
On the left-side of the screen you can see a list of items you can use Toad to monitor. On the right-side you see a row of tabs at the top of the screen. These are what I am going to focus on in today’s blog.
Also notice that at the bottom of the graphs screen there is a ‘grids’ tab. This will change the display to a grid view as shown below.
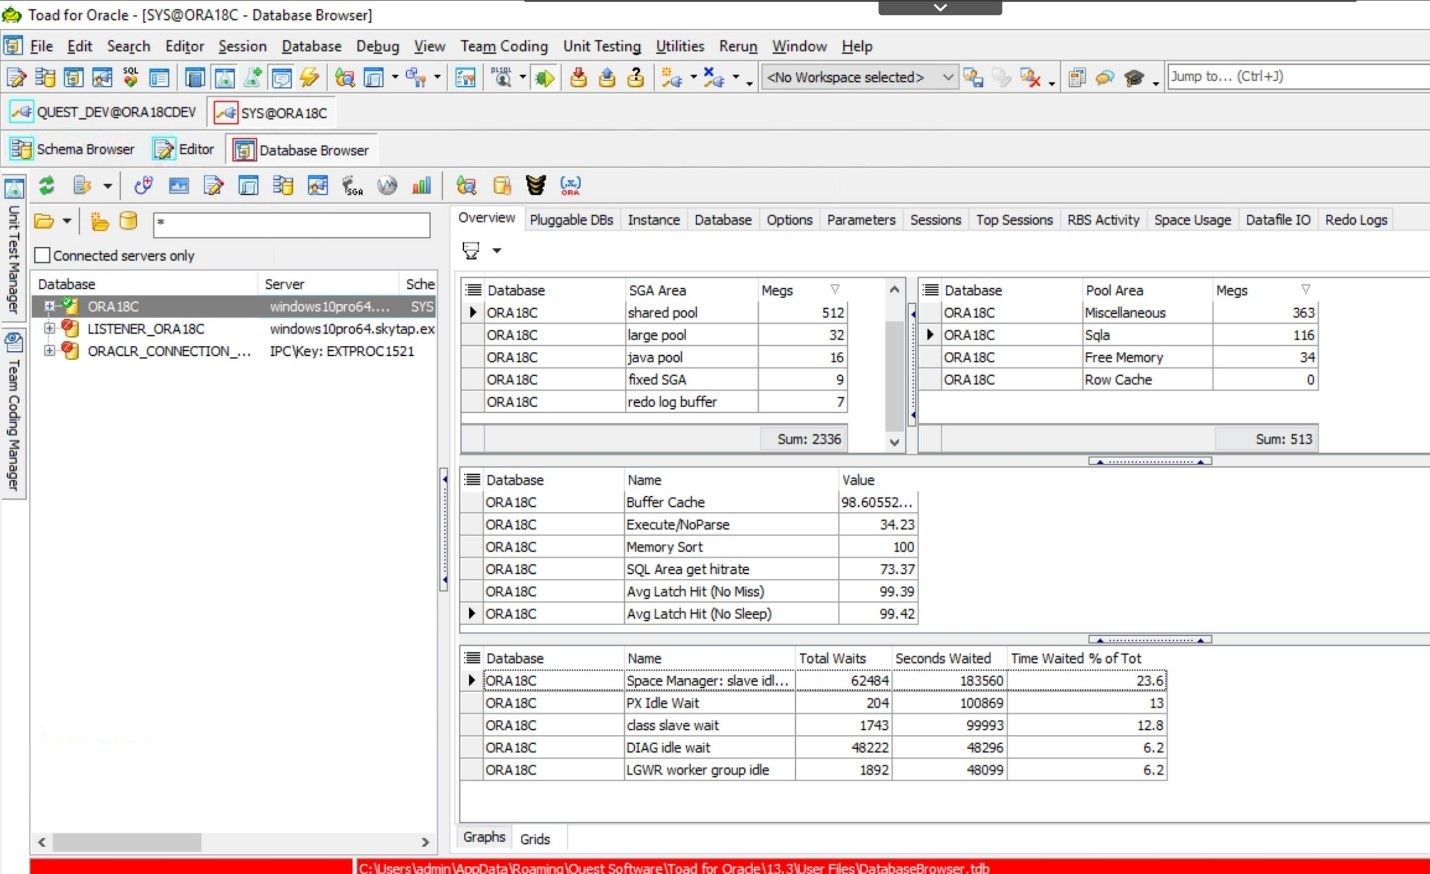
It is your personal preference as to the screen view you want to use. I personally like the graph view.
Regardless of the screen, the tabs are still at the top of the screen. The default tab is Overview. That is what you see in the 2 screen-shots above. This gives you a quick overview of the sga, shared pool, hit rates and event waits.
Clicking on the ‘Pluggable DBs’ tab will display any pluggable databases you may have as shown below.
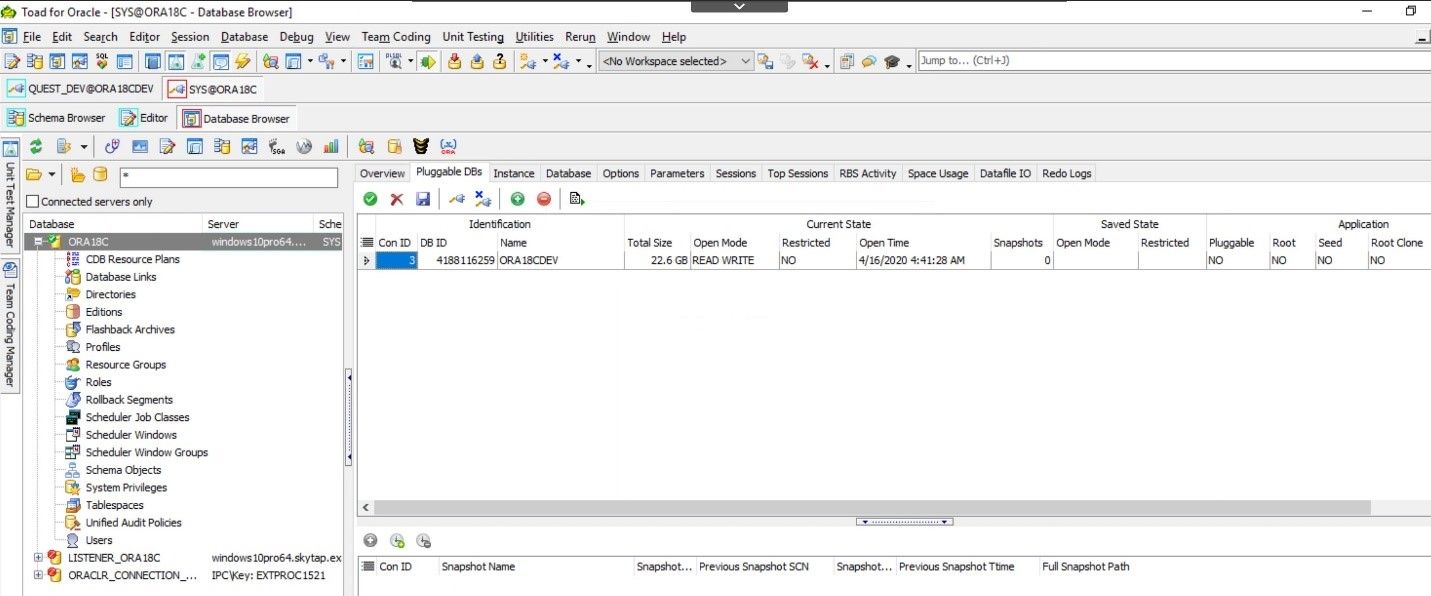
Depending upon your database permissions and setup you may be able to Open, Close, Save, Create a pluggable database or create a tnsnames entry for your database by using the icons at the top of this screen. If you have an xml file you can even plugin a database. This is a pretty powerful screen for managing your pluggable databases.
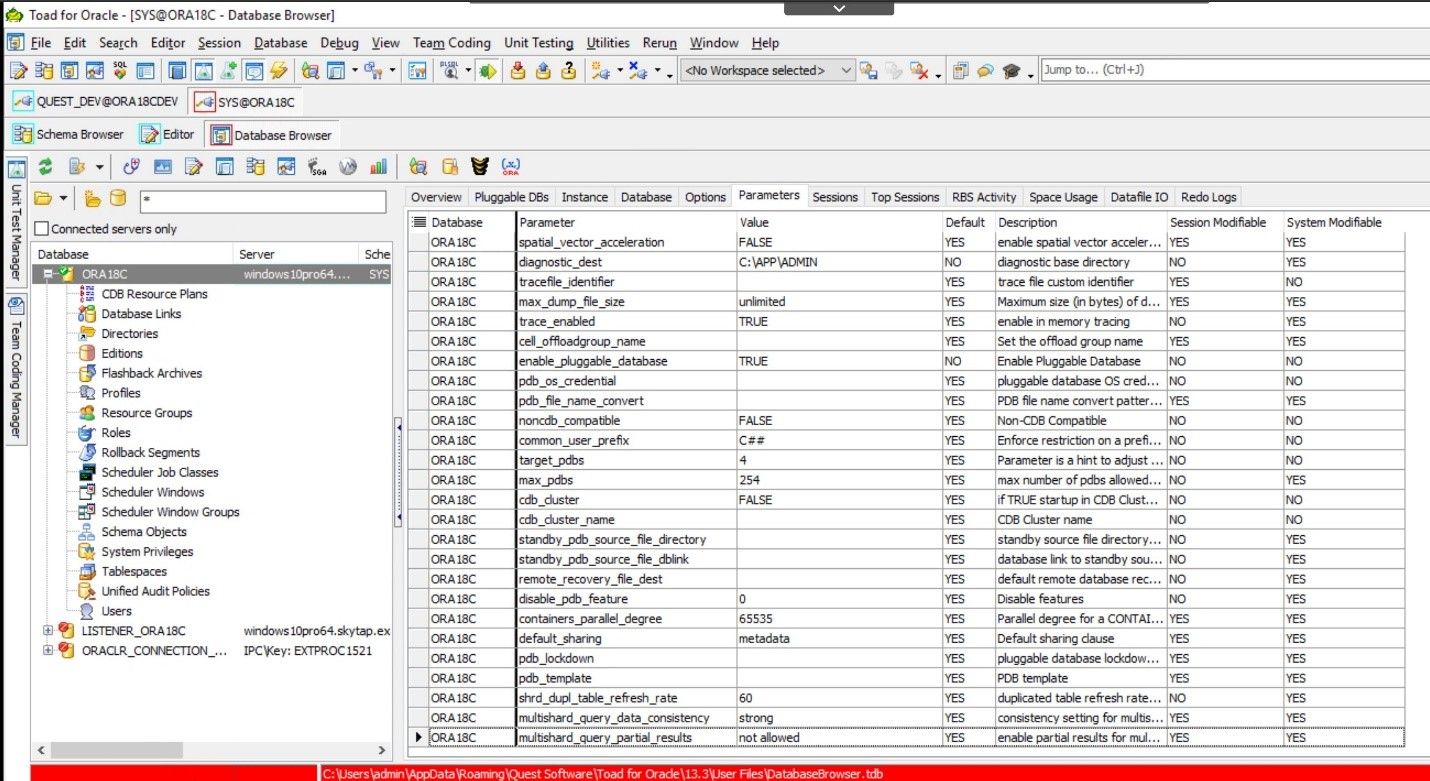
I am going to skip over the next 4 tabs: Instance, Database, Options, and Parameters for now. I will go into more details on these in a future blog. There is useful information on all of these tabs, don’t get me wrong, but for now I will let you explore them on your own. They basically show the configuration of your database parameters as you can see below.
Session information
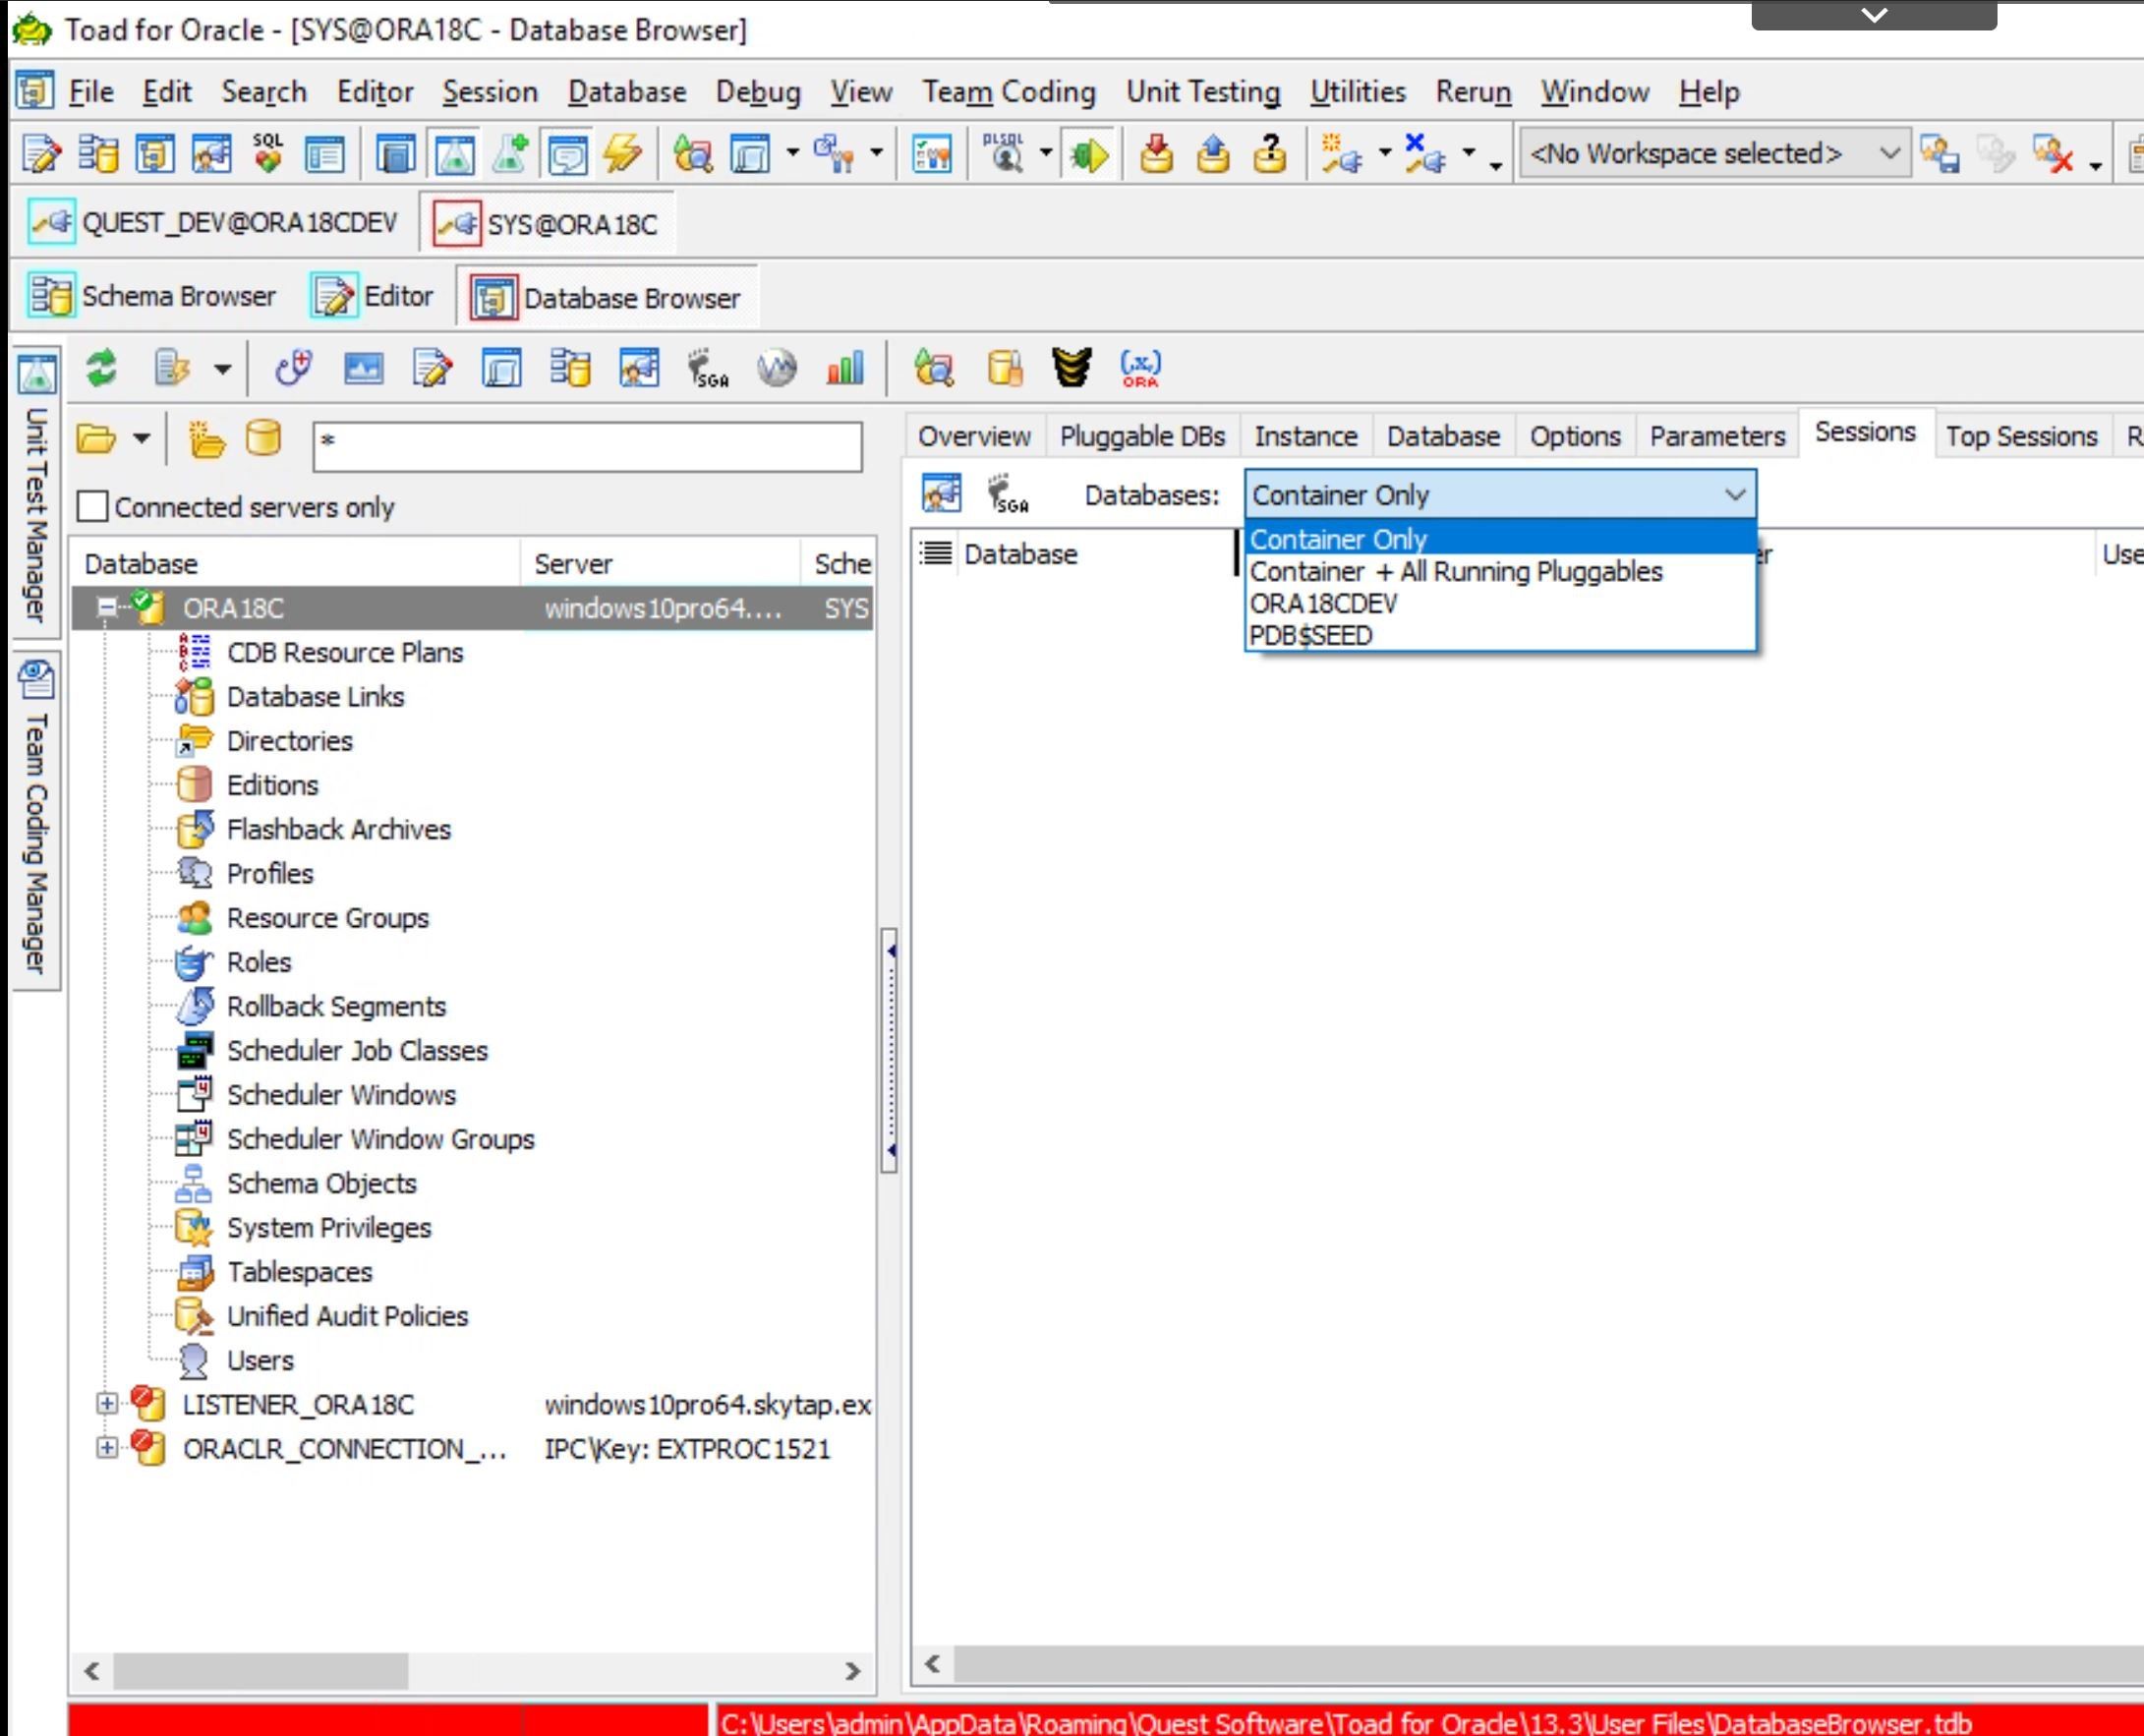
Now let’s look at some Session information. The next 2 tabs are where you can view and manage your user connections and see what they are doing.
On the Sessions tab you can choose from the different databases you have in this connection. I have 4 options on my image but if you have more pluggable databases they would show up on this list. I am going to choose the ORA18CDEV database.
Once you have chosen your database you will see this screen:
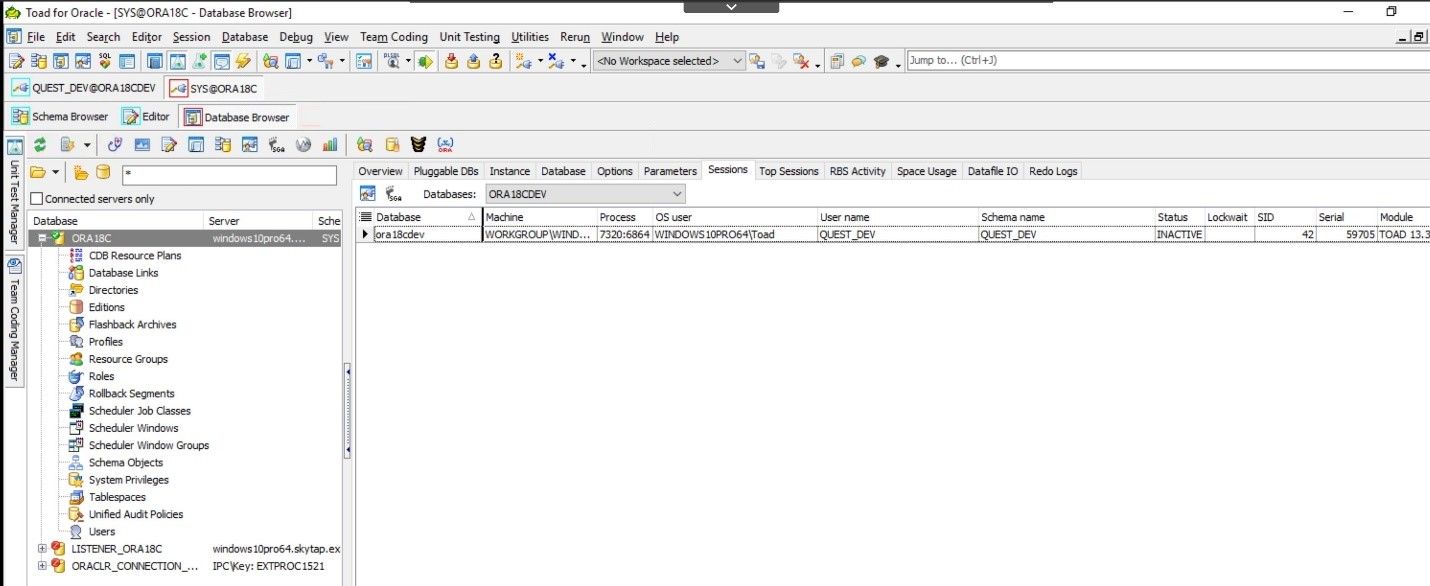
You will see any connected sessions for this database. In my simple example I only have one session but you will have more.
Double-clicking on a session will highlight that session but that is it. You may be used to double-clicking and drilling down further so what the heck is going on?
Well, on this screen you highlight the session you want and then you have to click on the Session Browser icon in the upper left:
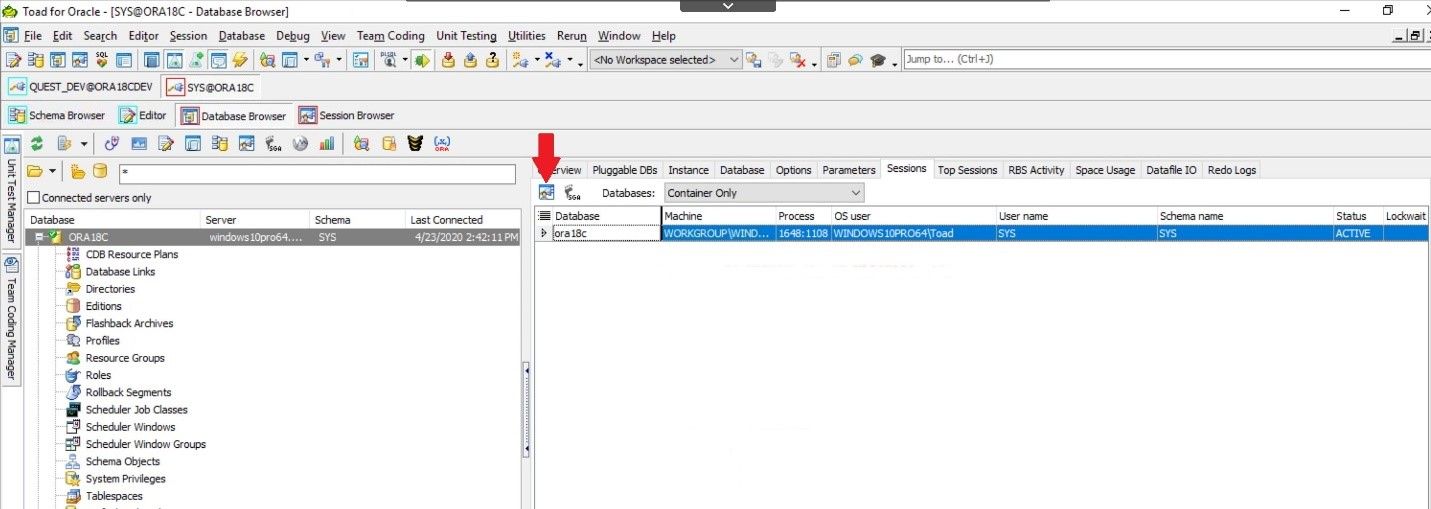
This will open the Session Browser window and now you can see all of the details for this session.
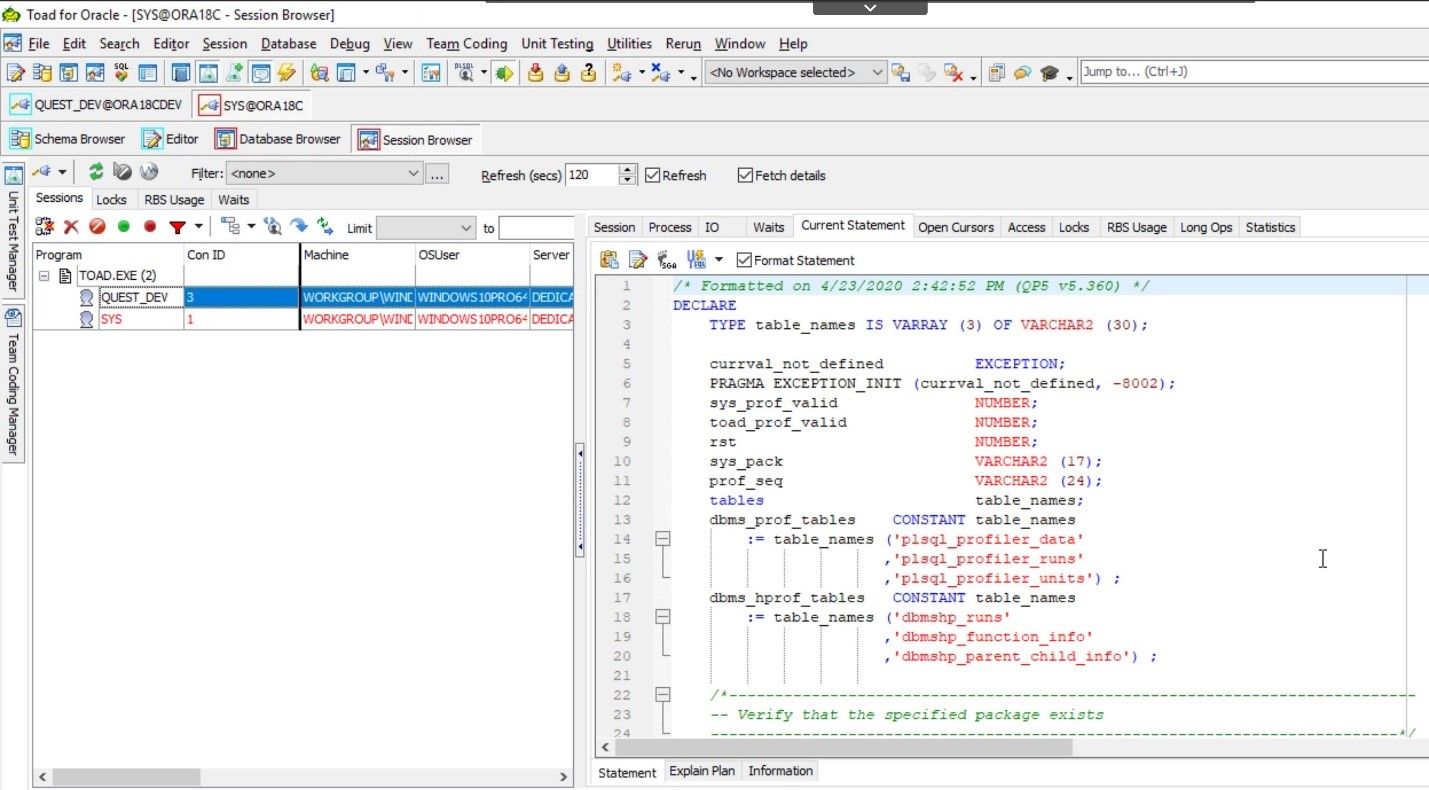
As you can see there is a lot of information on the Session Browser screen—and guess what? I will cover this in another blog series. For now I am going to take you back to the Database Browser features.
Database Browser features
The Top Sessions tab allows you to view the sessions that are using the most resources. There are several options you can set on this screen to help you filter the details.
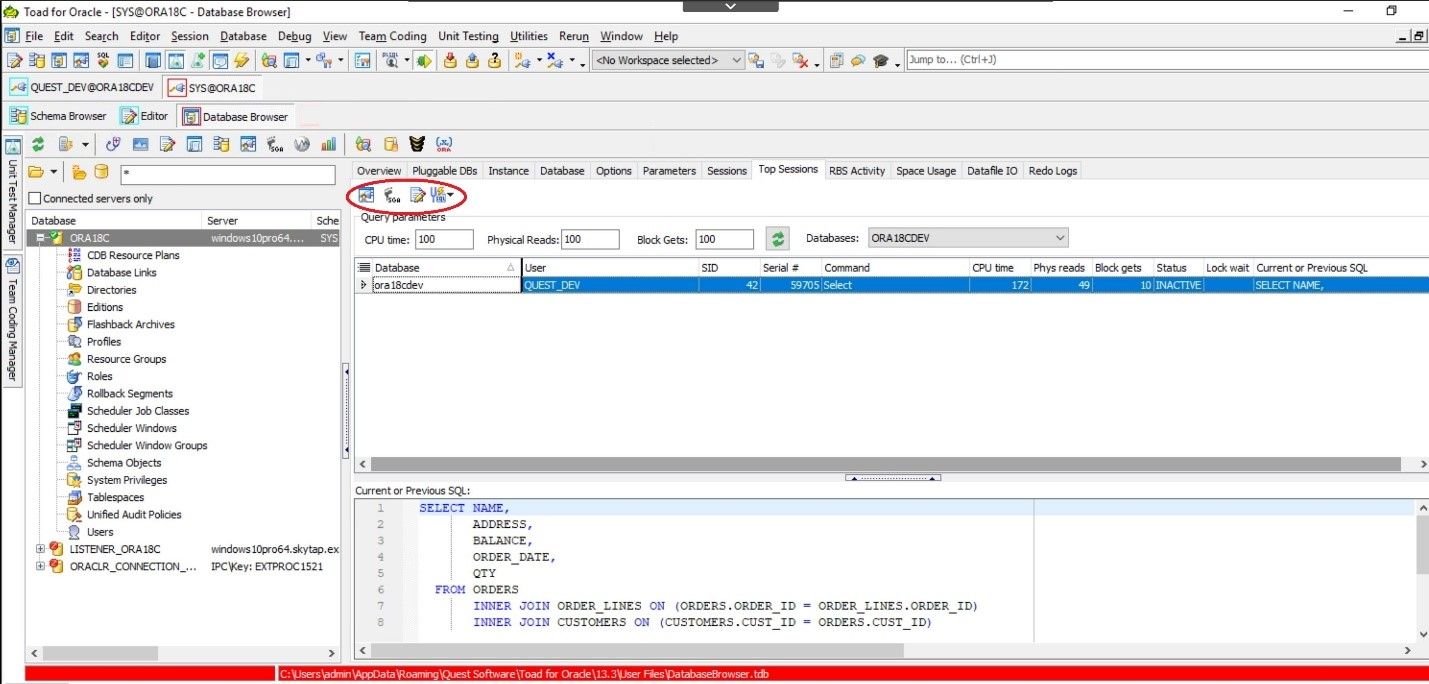
You can set query parameters by choosing CPU time, Physical reads, and/or Block Gets.
Once you see the sessions there are several options to drill down further. I have circled them in red. This first icon will take you to Session Browser, which I mentioned above. You can use the second icon to launch an SGA Trace. The third icon will send the SQL statement to the editor and the fourth icon will send the query to the SQL Optimizer.
RBS Activity tab
Now I am going to move onto the RBS Activity tab. This will display an overview of rollback segment activity.
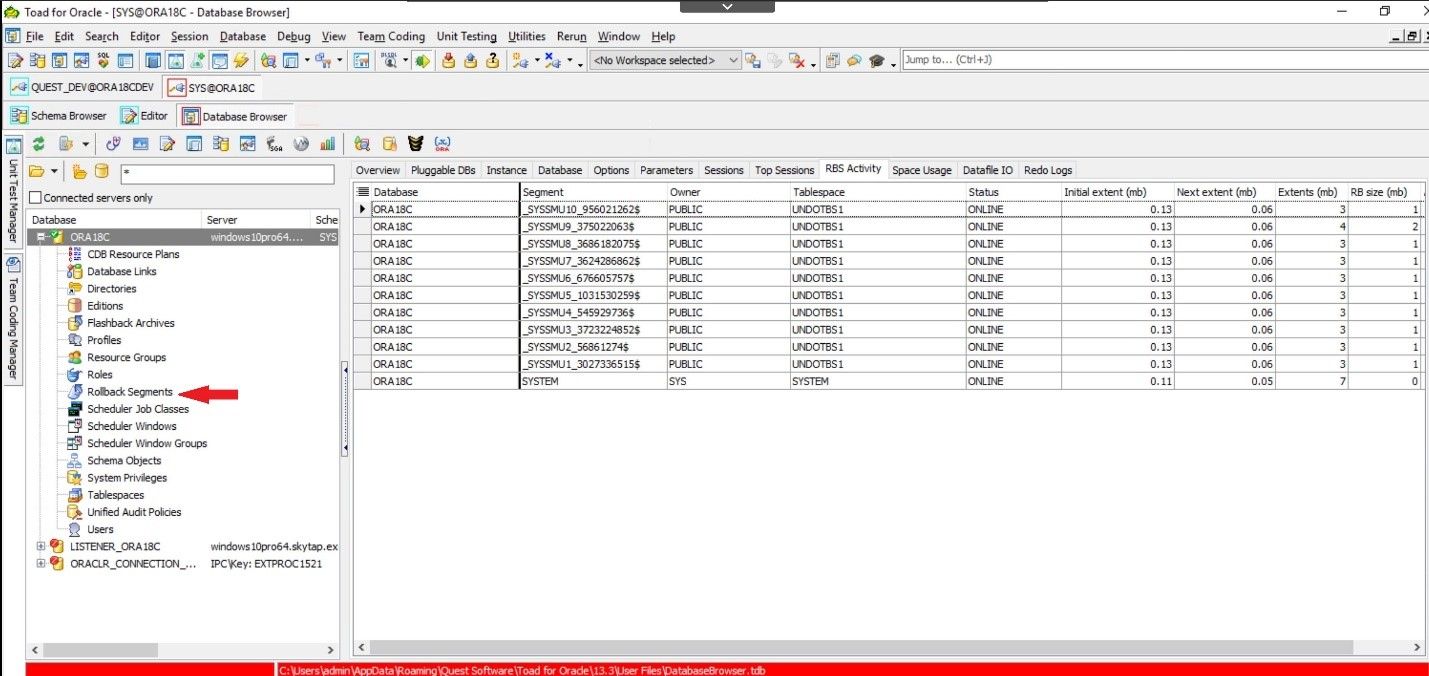
Now this is just an overview, but it does give you some details about the segments. To drill down further you need to click on the Rollback Segments list item on the left side of the screen. This drill down will give you more control over your RBS. You can report on them create new ones, etc., etc. Stay tuned for more details on this feature in the future.
Space Usage Tab
The Space Usage tab displays an overview of tablespace usage details for all of the tablespaces used in this instance at a quick glance.

Tablespace
Double-clicking on a tablespace will take you to the Alter Tablespace window where you can manage the tablespace.
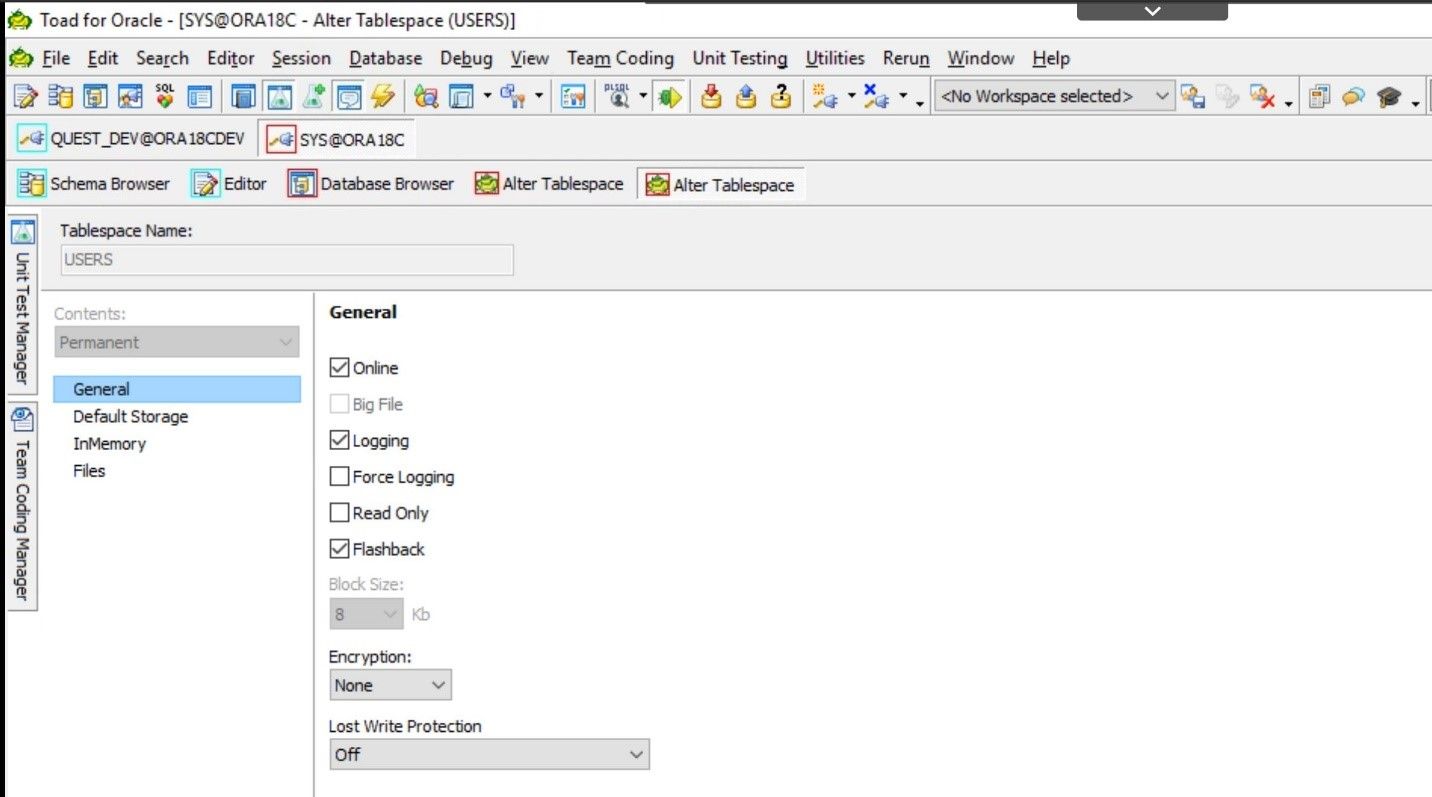
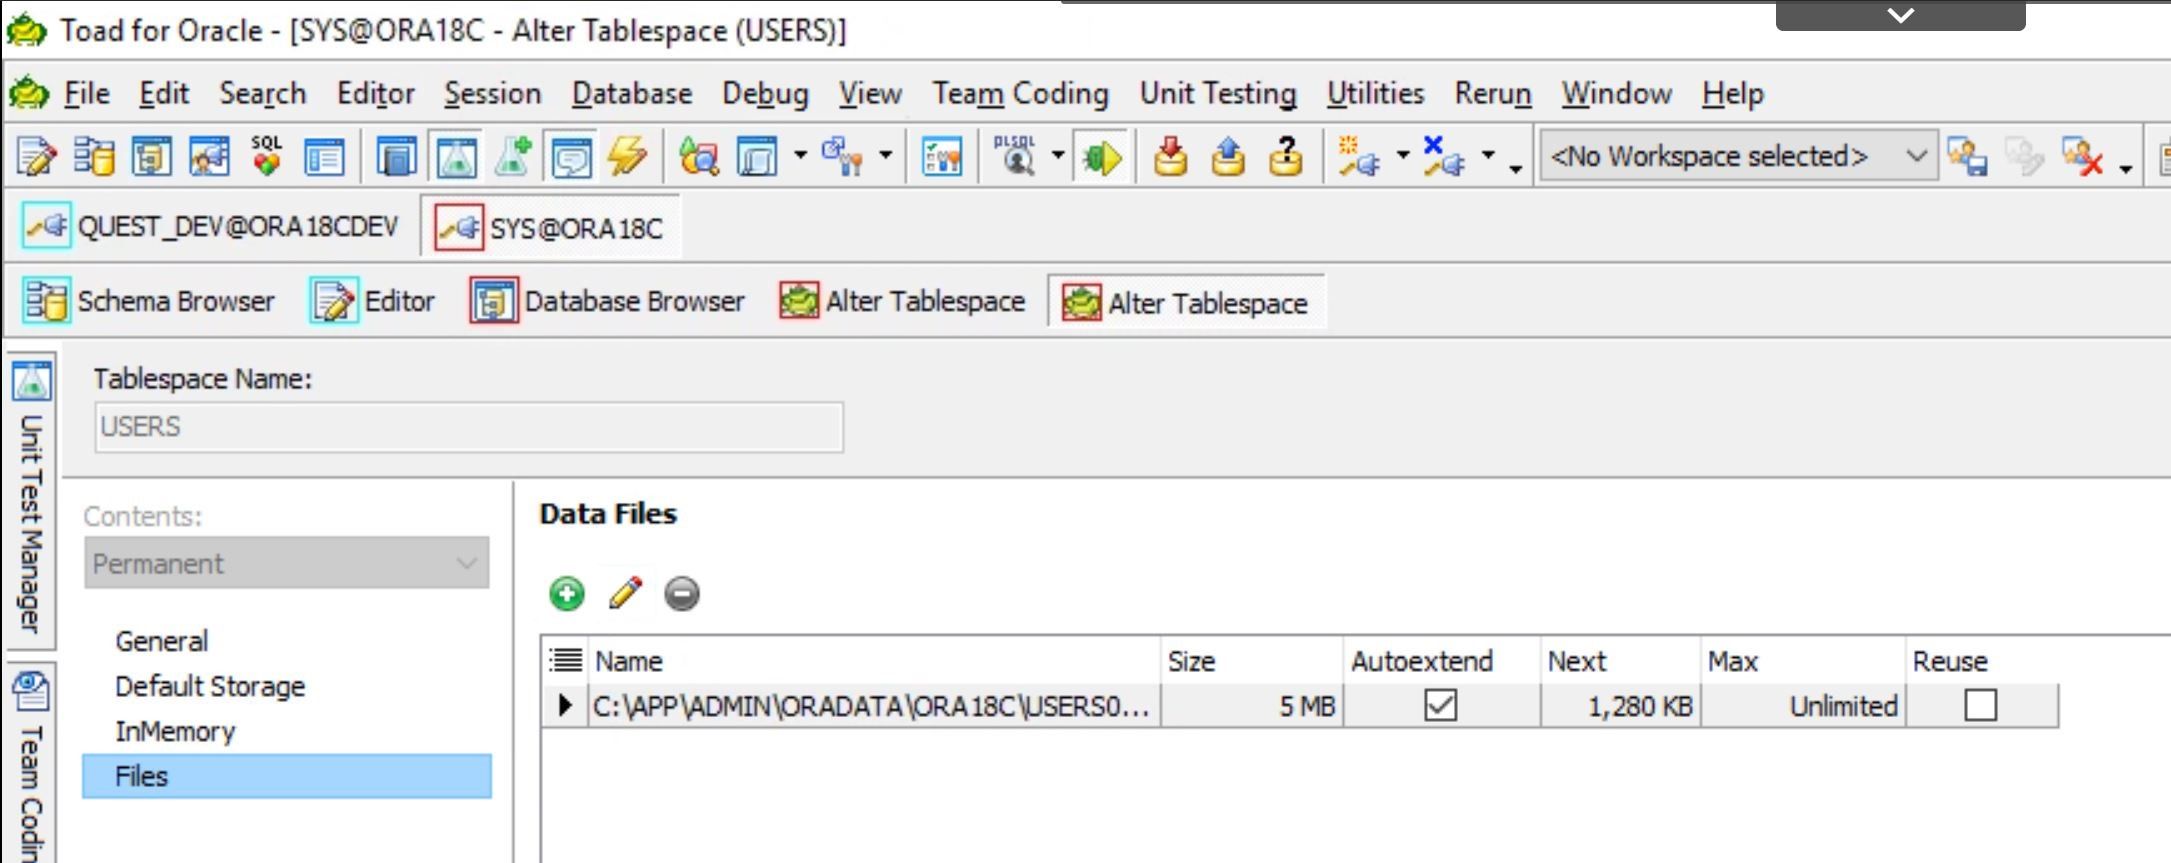
On the left-side of the Alter Tablespace screen you can see the options available to you for this tablespace. General is an overview but as you work down the list you will see other information and under the ‘Files’ menu you can even alter the tablespace. Quite a handy feature.
Datafile I/O
The next tab on the Database Browser is Datafile I/O. This screen gives you an overview of the I/O for each tablespace.
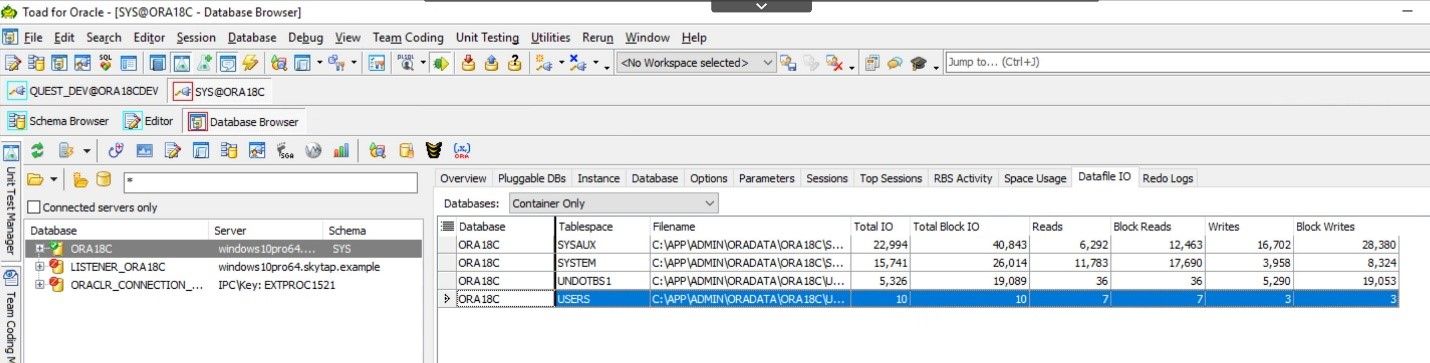
If you double-click on a tablespace you will be taken to the ‘Alter Tablespace’ just like you were from the ‘Space Usage’ tab. The idea is that you are able to view tablespace information in multiple fashion to help you drill down and view the data where it is important to you.
Redo Logs
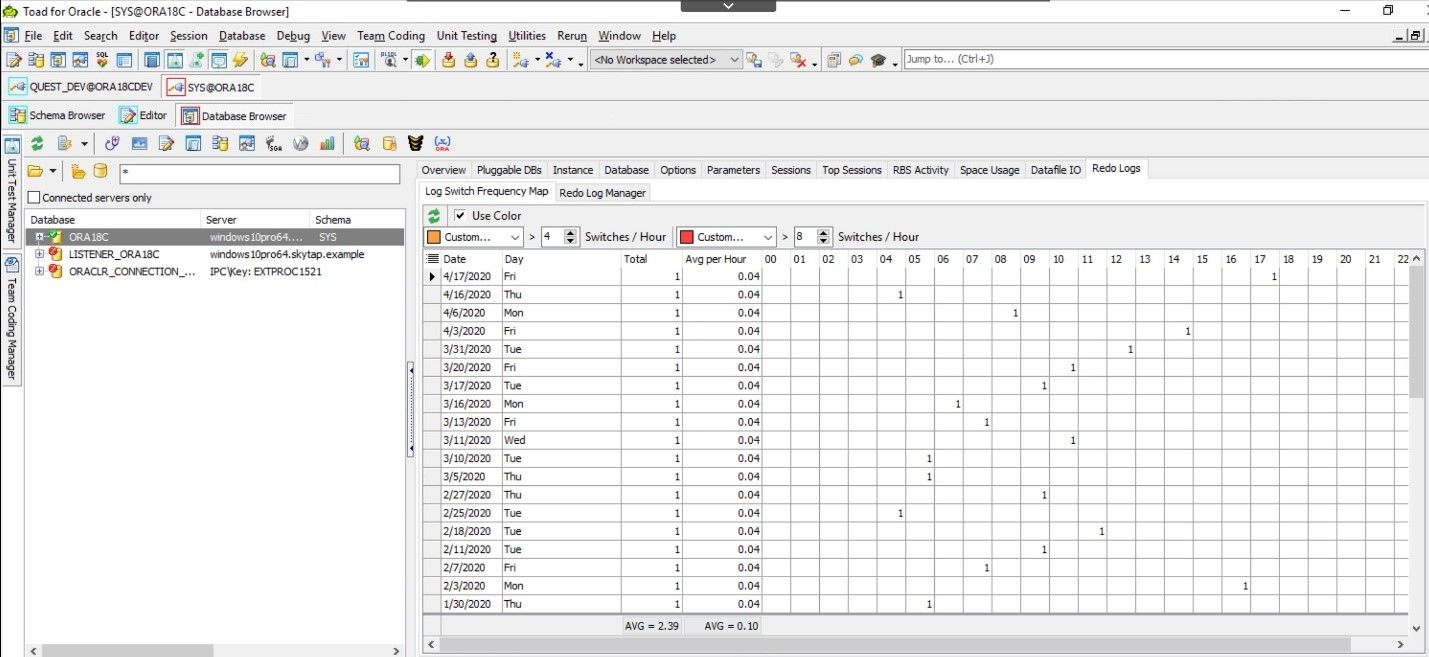
The final tab is Redo Logs. Personally, I think this is one of the best features. It breaks down the redo log usage hour-by-hour. How cool is that? You can use this to see spikes in activity that may be subtle but hard to catch when people are complaining that things “are slow.”
Below you can see that breakdown in the Log Switch Frequency Map screen.
Next to the Log Switch Frequency Map tab is the Redo log Manager tab. This is where you can, well, manage your redo logs.
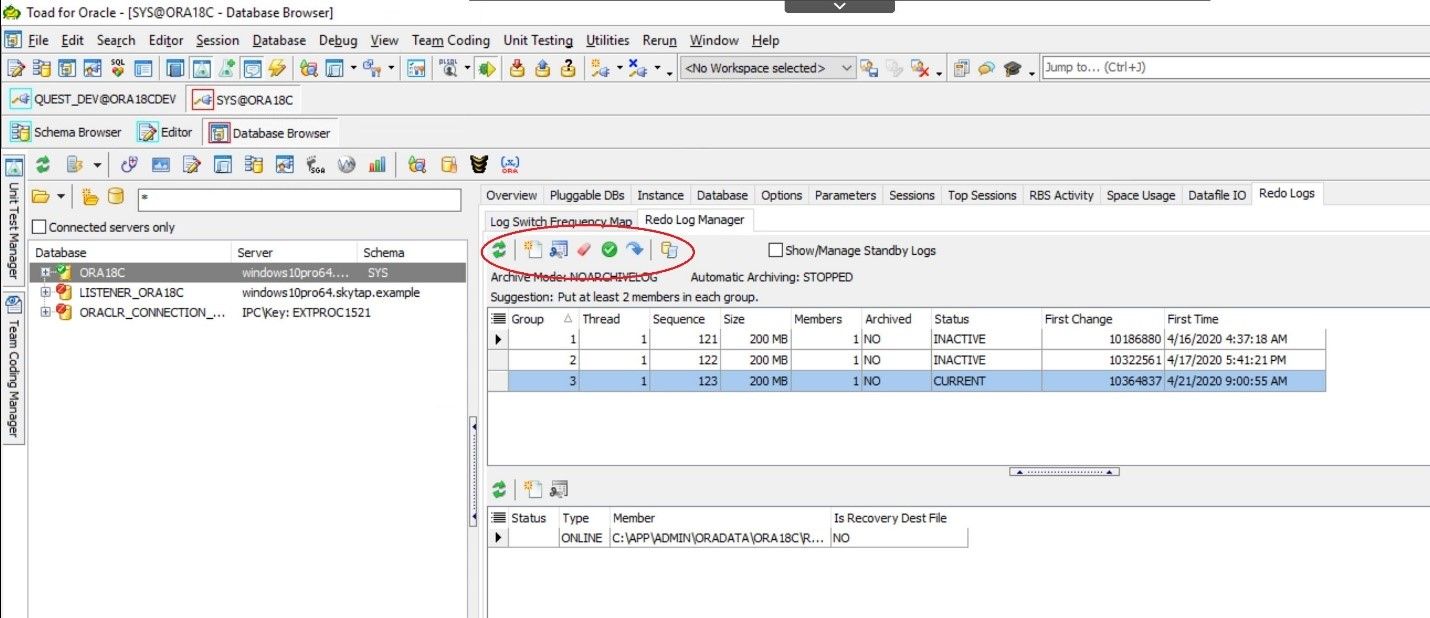
In the screen shot above you see the Redo Log Manager features. I have circled them in red. From this screen you can do things like Adding and Dropping groups, Clear the log group and Alter the system checkpoint. The last 2 icons allow you to force a log switch and Alter System Archive Log. I will let you explore these on your own for now.
In conclusion, you have seen just a small portion of the capabilities of Toad and the Database Browser and learned how to monitor database activity with this feature. I hope you explore the features on your own and use the ones that are valuable to you and that they help you save some time.
I hope you find this blog useful and if you have any questions just leave a comment on the blog page and stay tuned for more blogs in this series.
-Mark Kurtz
Try Toad for Oracle nowTry Toad for Oracle free for 30 days. Already in a trial? Talk to sales or buy now online. Already a loyal fan of Toad for Oracle? Renew now. |
Useful resources
Toad for Oracle general information
Technical brief: Top Five Reasons to Choose Toad Over SQL Developer
Case study: Opening doors and creating opportunities with data insights
Have questions, comments?
Head over to the Toad for Oracle forum on Toad World®! Chat with the me, the other Toad developers, and lots of experienced users.
Help your colleagues
If you think your colleagues would benefit from this blog, share it now on social media with the buttons located at the top of this blog post. Thanks!
Start the discussion at forums.toadworld.com