The latest release of Toad for Oracle is out and one of the new features is the (re)introduction of the JDWP Debugger which provides additional functionality over the existing DBMS debugger such as viewing user-defined data types, descriptive exception reporting, and viewing variable information at different scopes.
If you haven’t upgrade yet you can get the latest version 13.1 from here. Not to worry, both the DBMS and Script Debuggers are both still in the product as well.
Step 1. Setting the Default Debugger
Since Toad for Oracle 13.1 contains three debuggers we’ll need to set the JDWP Debugger as our default to begin using it (this can always be changed later).
Enable the JDWP Debugger
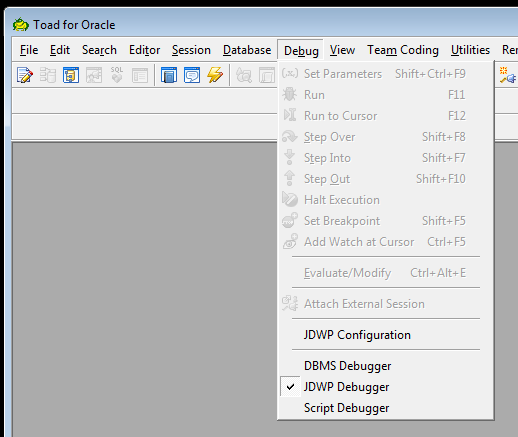
Setting the default debugger can be done from Toad’s main toolbar. Navigate to Debug > JDWP Debugger and click to change the default selection from the DBMS Debugger (or Script Debugger) to JDWP Debugger.
Step 2. JDWP Configuration
Since the JDWP Debugger operates on a separate connection from the database’s connection some configuration may be required. You’ll need to create a database connection before starting this next step.
Once your default debugger has been set to JDWP and you’ve made a connection go ahead and navigate to Debug > JDWP Configuration. This will present a small setup wizard where you’ll be walked through the setup process.
JDK Install
To use the (Java)DWP we need to install the… Java Development Kit (JDK). Toad for Oracle 13.1 requires a minimum version of 9 and has been tested with both 9 and 10 although the just recently released version 11 should work fine as well. So, if you haven’t already go and download then install a compatible version of the JDK. Once finished click the Select JDK locationbutton in the wizard which will display something similar to the image below.
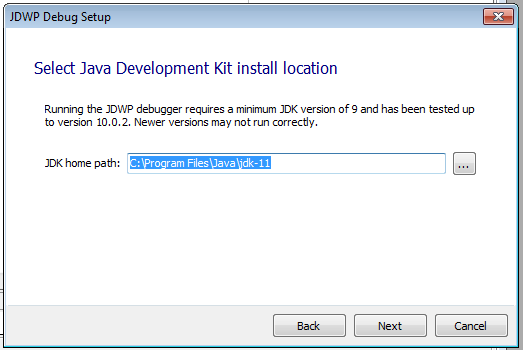
Toad should automatically find your latest JDK install but in the event that it didn’t or you’d prefer to use an alternative JDK go ahead and select the home path manually. Once finished click Next.
Setup and test debug connections
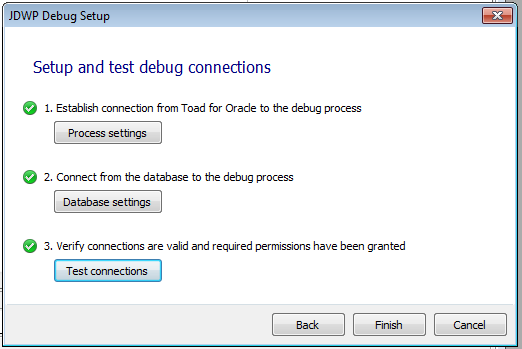
This next page might require some additional configuration but once it’s complete you’re finished! Before changing any of the default settings go ahead and test your connection using the Test connections button. If everything displays with green check marks you can skip the next few steps.
If the first step failed 1. Establish connection from Toad for Oracle to the debug process this means that the local port on your computer we tried to use has been blocked and the JDWP process couldn’t communicate with Toad. Try adjusting the Process settings with a static port you’re certain is available or changing the host.
The second step 2. Connect from the database to the debug process is the most common point that requires additional changes. The default port used for communication from the database to the debugger is 4000 and can be configured to use an alternative port if desired. If your connection is still being blocked it could be by any number of firewalls, software or hardware. If your router’s firewall is the suspect try doing a search for “
Oracle 12c and later
Oracle 12c and later require an additional setup and without it you’ll receive the error ORA-24247: network access denied by access control list (ACL)which can be resolved by allowing access with the following:
BEGINDBMS_NETWORK_ACL_ADMIN.APPEND_HOST_ACE(host => '<host>',lower_port => null,upper_port => null,ace => xs$ace_type(privilege_list => xs$name_list('jdwp'),principal_name => '<schema>',principal_type => xs_acl.ptype_db));END;Finish setup
Once properly configured you should see three green check marks validating that you’re ready to start debugging.
Step 3. Debug
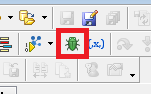
Open the Editor and load a procedure. Note: Make sure your procedures are compiling with debug information which can be toggled from Toad’s main toolbar.
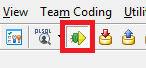
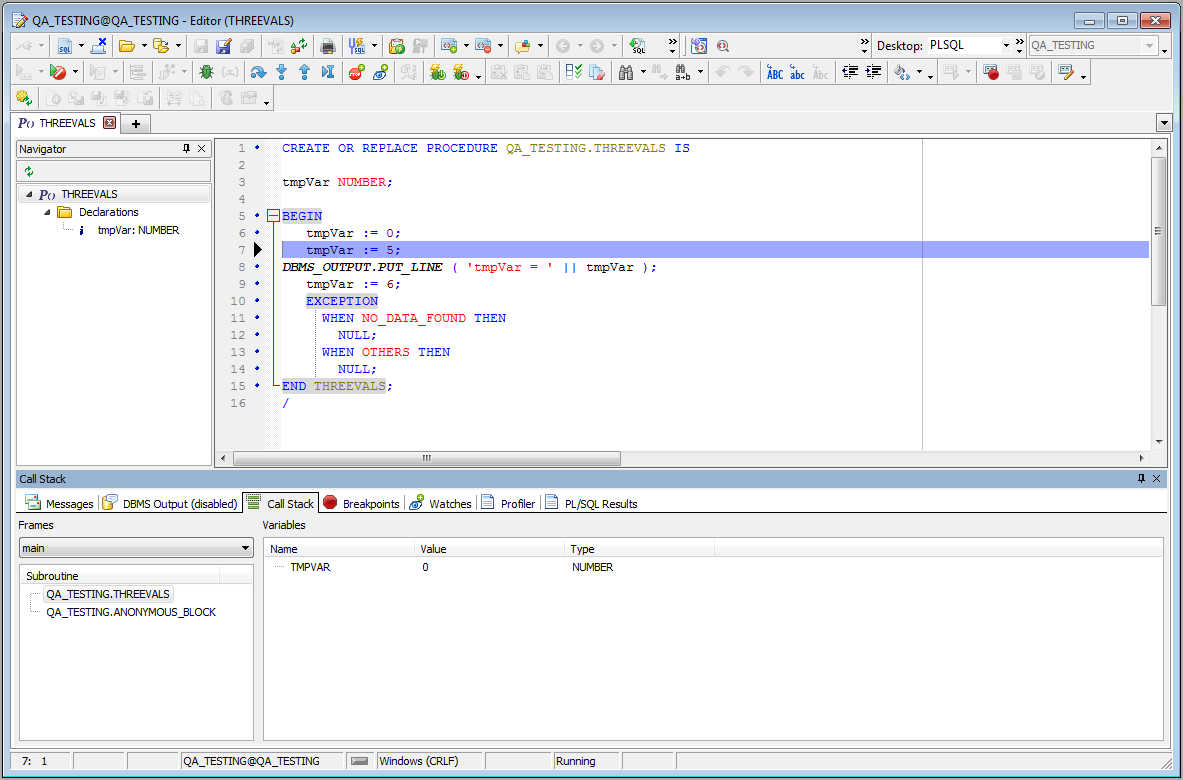
Once your procedure is loaded and compiling with debug has been enabled set a breakpoint or two in the Editor’s left margin and execute your procedure with the debugger.
Your code will stop at your first breakpoint and you can step over, into, or out of your code and monitor variable changes as they happen.
If you made it this far hopefully you were able to setup Toad’s new JDWP Debugger and you’re now able to debug and experiment with some of its different features and functionality.
If you have any suggestions or questions let me know on our forum.
Start the discussion at forums.toadworld.com