Data as it is collected (raw data) is often not in a state suitable for an end user. Data preparation, a term used in data science, refers to the task of preparing data so that it can be reliably used or saved for later use. Raw data may include erroneous data, duplicate data, missing data in the form of null values or blank values, extra spaces, wrong data types, and unsorted data; to list some of the shortcomings possible. Toad Data Point provides several features for data preparation.
The first phase in data preparation is extracting data from one or more data sources. A data source could be a relational or NoSQL database, an XML file, a JSON file, a CSV file, or a file in another format. After extracting data it may be transformed to remove its shortcomings. After the data has been thus transformed it may be used or saved. Some of the options available for prepared data are:
- Data analysis
- Report generation for presentation
- Storage in a database or file for later use
In this tutorial consisting of three articles we shall discuss preparing raw data taken from a MySQL database table for an Excel spreadsheet. This tutorial has the following sections.
Setting the Environment
Preparing the Data Source
Profiling Data
Extracting Data to Transform
Transforming Data
Running Autotransform
Filtering Data
Removing Duplicates
Finding and Replacing Null Values
Finding and Replacing Missing Data
Sorting Data
Formatting Data
Converting Data Types
Extracting Date
Exporting Data Report
Setting the Environment
Download and install the following software:
Preparing the Data Source
The raw data we have used is server log data taken from WebLogic server. This data includes erroneous data that needs to be filtered out, missing data in the form of null values and blank values, duplicate data, extra spaces that need to be trimmed, and wrong data types. In this section we shall prepare the data source by running the following SQL script in Toad Data Point to create a database table called wlslog.
CREATE TABLE wlslog(logid int PRIMARY KEY,timestamp VARCHAR(255),category VARCHAR(255),type VARCHAR(255),servername VARCHAR(255), code VARCHAR(255),msg VARCHAR(255));
INSERT INTO wlslog(logid,timestamp,category,type,servername,code,msg) VALUES(6,'4/8/2014 7:06:21 PM','Notice','WebLogicServer ',' ','BEA-000365',' Server state changed to RUNNING ');
INSERT INTO wlslog(logid,timestamp,category,type,servername,code,msg) VALUES(7,'4/8/2014 7:06:22 PM',null,'WebLogicServer','AdminServer ','BEA-000360 ','Server started in RUNNING mode');
INSERT INTO wlslog(logid,timestamp,category,type,servername,code,msg) VALUES(8,'4/8/2014 7:06:22 PM',null,null,'AdminServer ','BEA-000360','SERVER STARTED in RUNNING mode ');
INSERT INTO wlslog(logid,timestamp,category,type,servername,code,msg) VALUES(9,'4/8/2014 7:06:22 PM',' ','WebLogicServer','AdminServer ','BEA-000360','SERVER STARTED in RUNNING mode');
INSERT INTO wlslog(logid,timestamp,category,type,servername,code,msg) VALUES(1,null,'Notice','WebLogicServer ','AdminServer','BEA-000365',' Server state changed to STANDBY ');
INSERT INTO wlslog(logid,timestamp,category,type,servername,code,msg) VALUES(2,'4/8/2014 7:06:17 PM','Notice','WebLogicServer','Admin Server ',' ','Server state changed to STARTING');
INSERT INTO wlslog(logid,timestamp,category,type,servername,code,msg) VALUES(3,'4/8/2014 7:06:18 PM','Notice',null,' ','BEA-000365',' Server state changed to ADMIN ');
INSERT INTO wlslog(logid,timestamp,category,type,servername,code,msg) VALUES(4,'4/8/2014 7:06:19 PM','Notice',null,'AdminServer ','BEA-000365',' Server state changed to RESUMING ');
INSERT INTO wlslog(logid,timestamp,category,type,servername,code,msg) VALUES(5,'4/8/2014 7:06:20 PM','Notice','WebLogicServer','AdminServer ','BEA-000331',' Started WebLogic AdminServer ');
INSERT INTO wlslog(logid,timestamp,category,type,servername,code,msg) VALUES(0,null,'Notice','WebLogicServer ','AdminServer','BEA-000365',' Server state changed to STANDBY ');
Null values are indicated with null and missing data is indicated with an empty string with one space as‘ ‘; the empty string may be enclosed in single or double quotes. For missing data to be found the value must be an empty string with one space in it or, if the data type allows, the value may be omitted. Adding an empty string value without a space as‘’ does not get found, as a valid value by the Find and Replace option in transformation. But, first we need to create a connection in Toad Data Point to MySQL database.
Creating a Connection to MySQL Database
To create a connection click on Connect in the toolbar as shown in Figure 1.
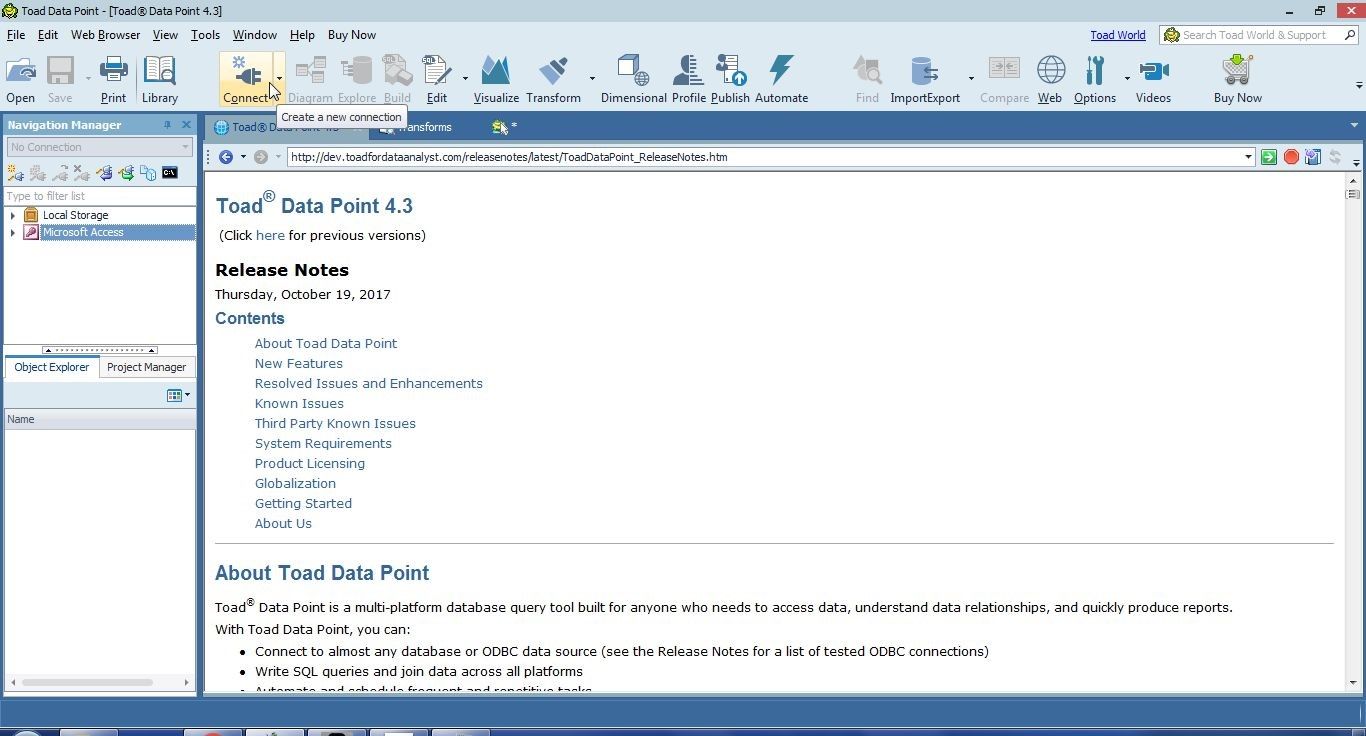
Figure 1. Connect
Select MySQL as the data source as shown in Figure 2.
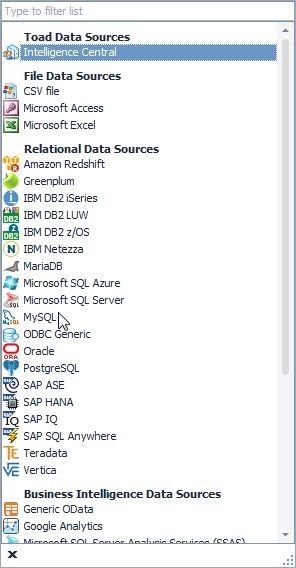
Figure 2. Selecting Data Source as MySQL
In Create New Connection specify Host aslocalhost, User as root, the password for root, Database as mysql, Port as 3306 and click on Connect as shown in Figure 3.
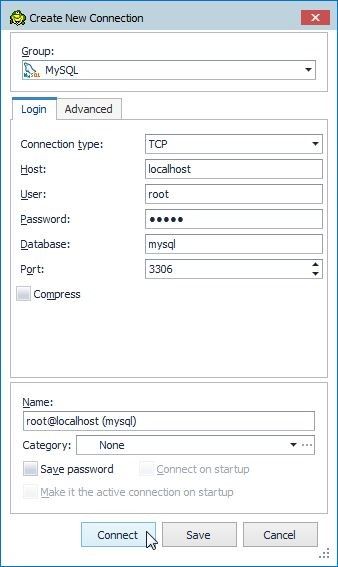
Figure 3. Create New Connection
A new connection gets added to Navigation Manager, as shown in Figure 4.
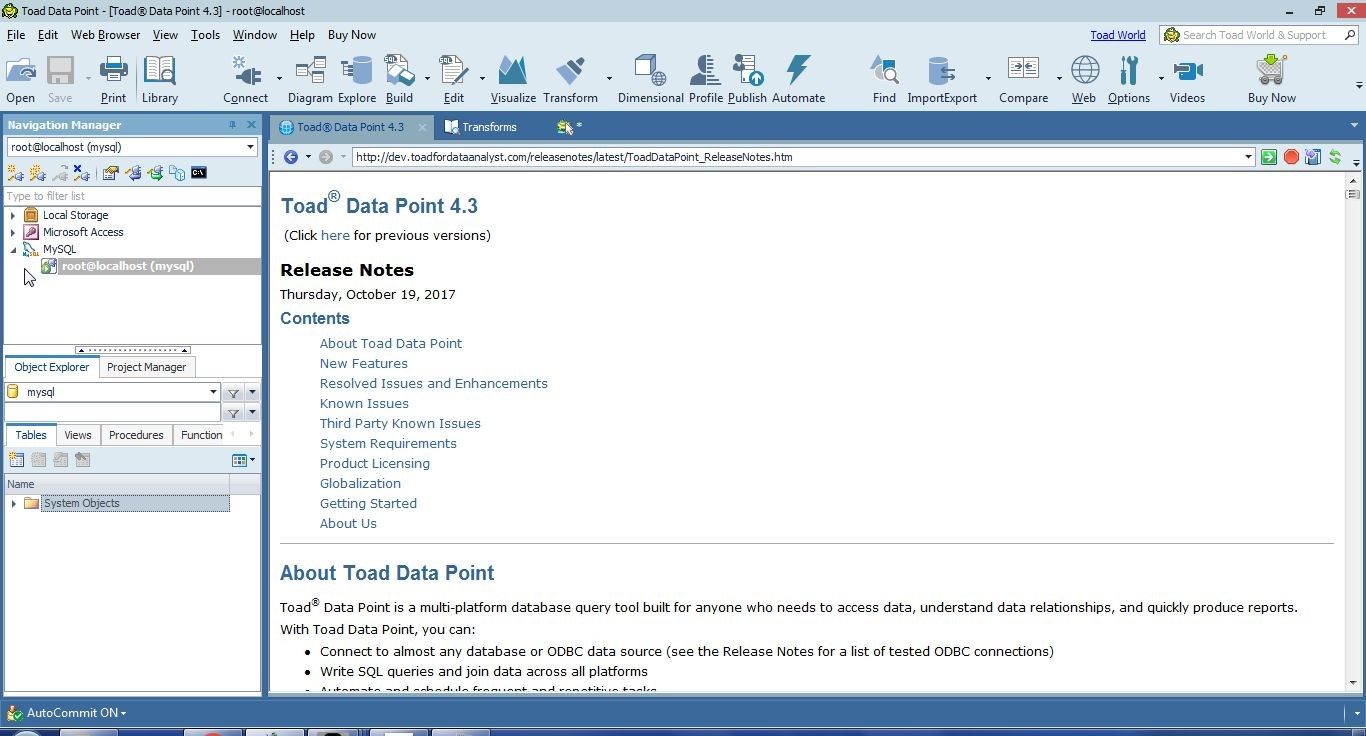
Figure 4. New Connection to MySQL Database
Creating Database Table
To run the SQL script listed earlier, open a SQL Worksheet by selecting Edit SQL from the toolbar as shown in Figure 5.
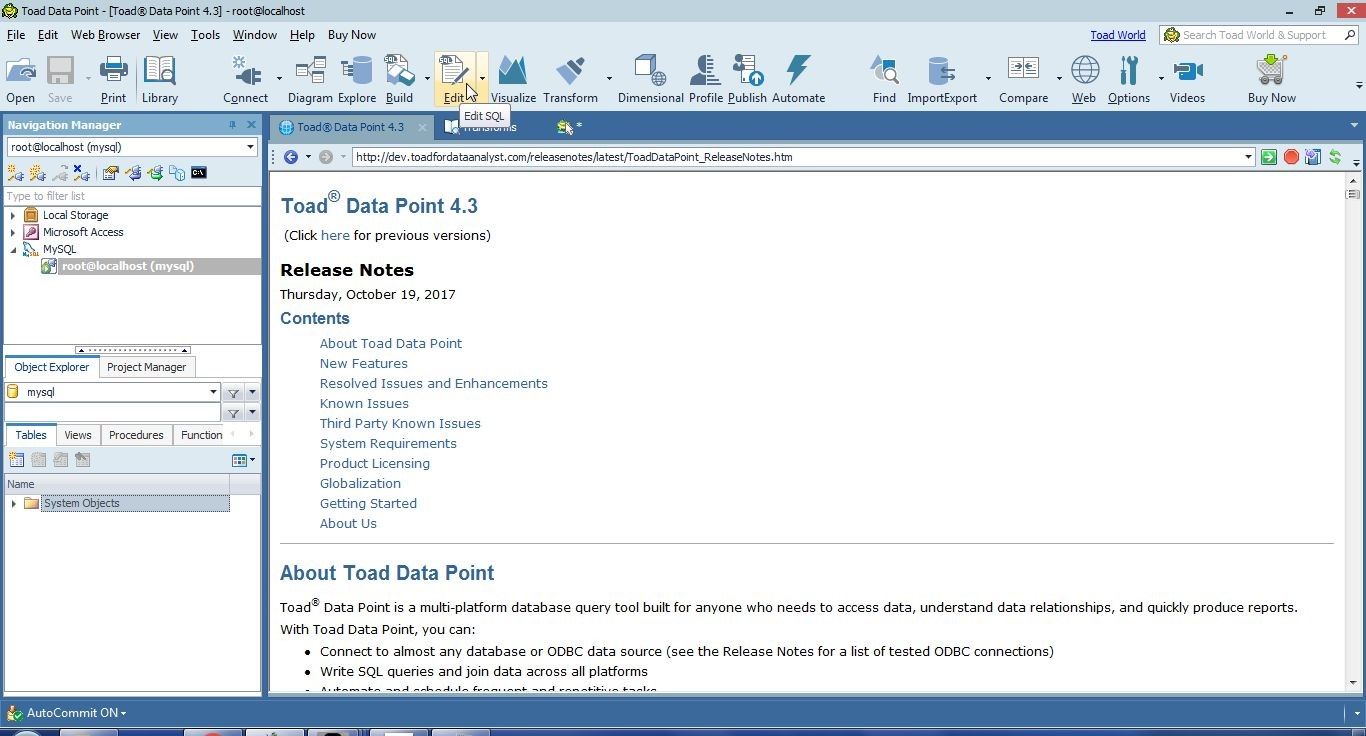
Figure 5. Edit SQL
A new SQL Worksheet gets opened, as shown in Figure 6.
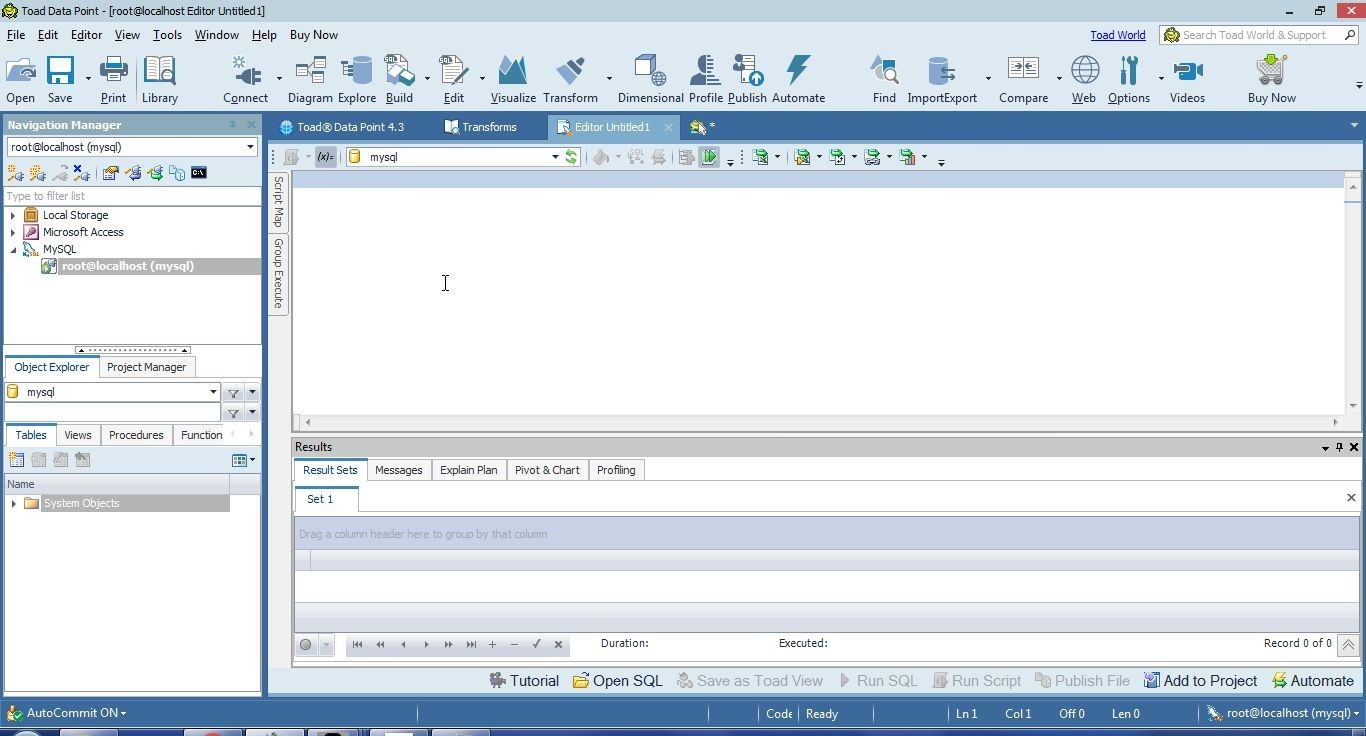
Figure 6. New SQL Worksheet
Copy the SQL script to the worksheet and click on Execute scripts as shown in Figure 7.
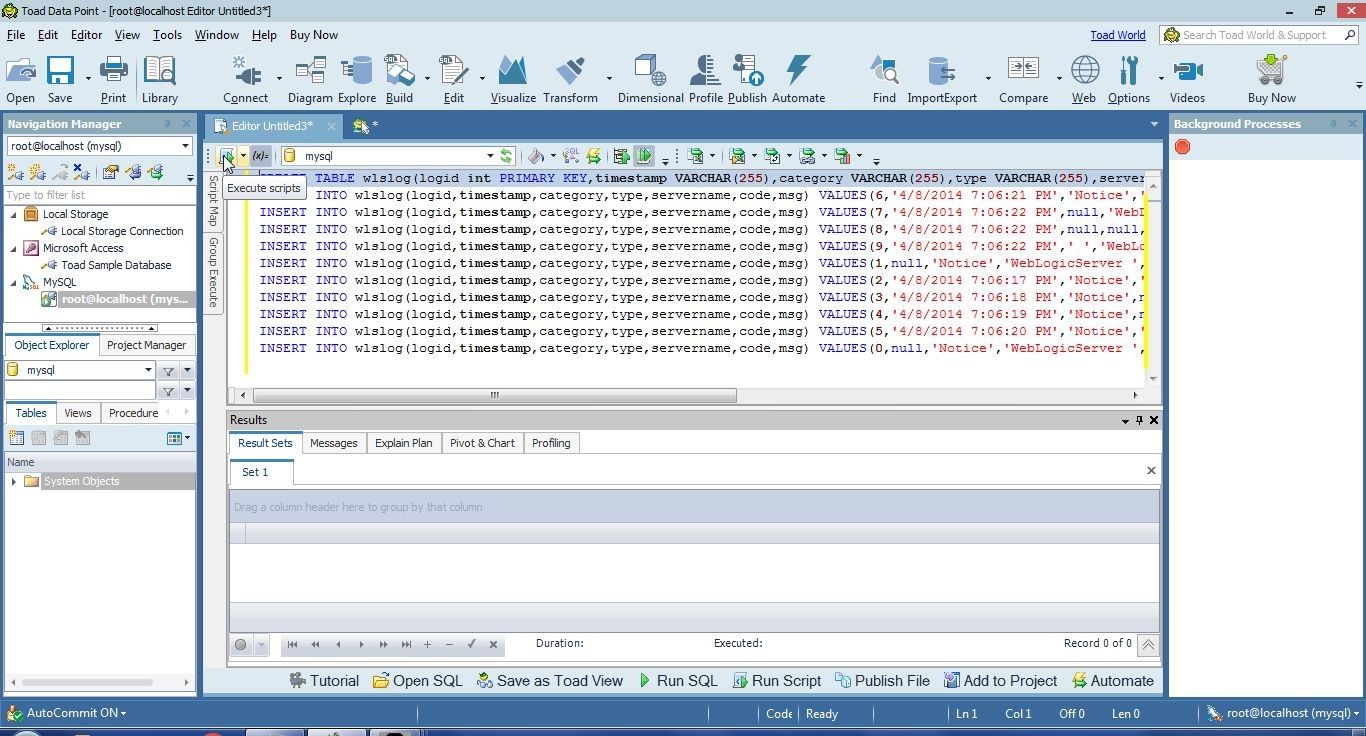
Figure 7. Execute scripts
As indicated in Messages tab in Figure 8, SQL statements run and a database table gets created. The wlslog table gets listed in Object Explorer. View>Refresh All may need to be clicked to refresh the tables and display the new table.
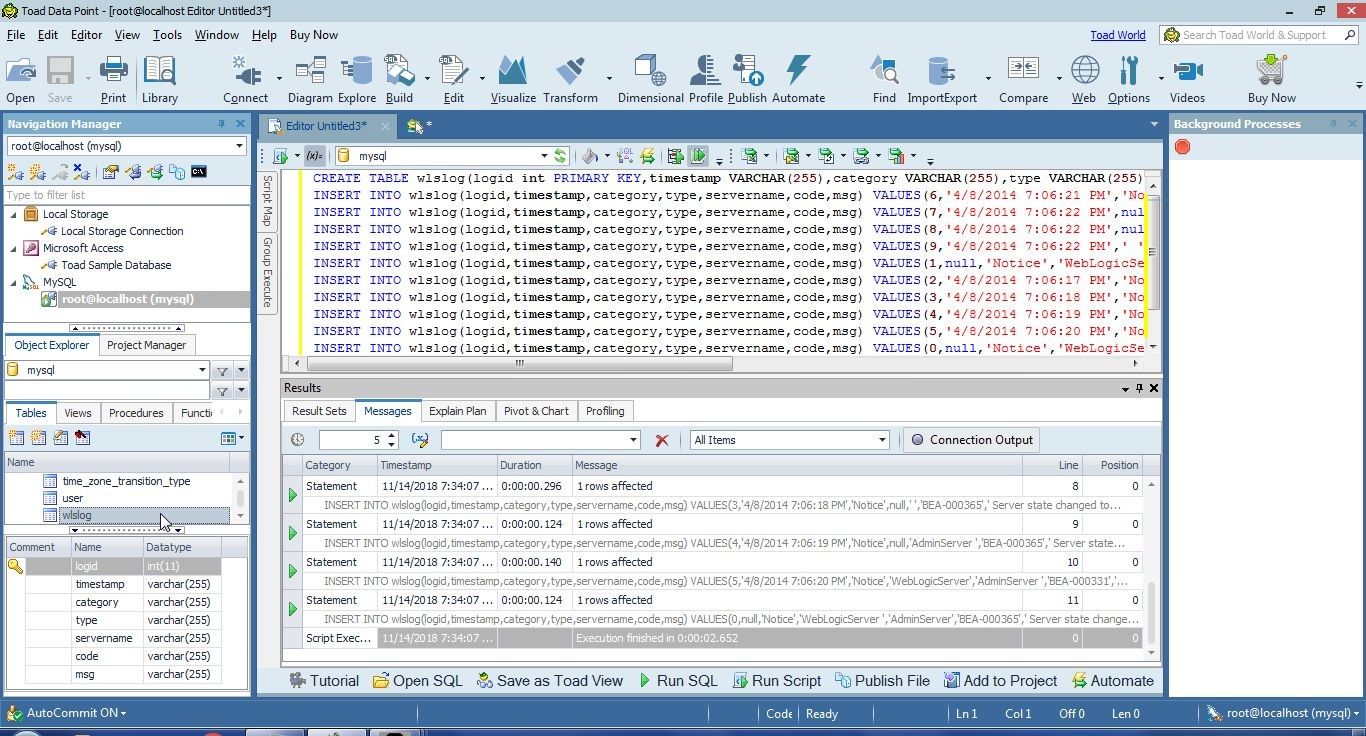
Figure 8. New Table wlslog created
Exploring Database Objects
Click on Explore database objects in the toolbar to explore the database objects as shown in Figure 9.
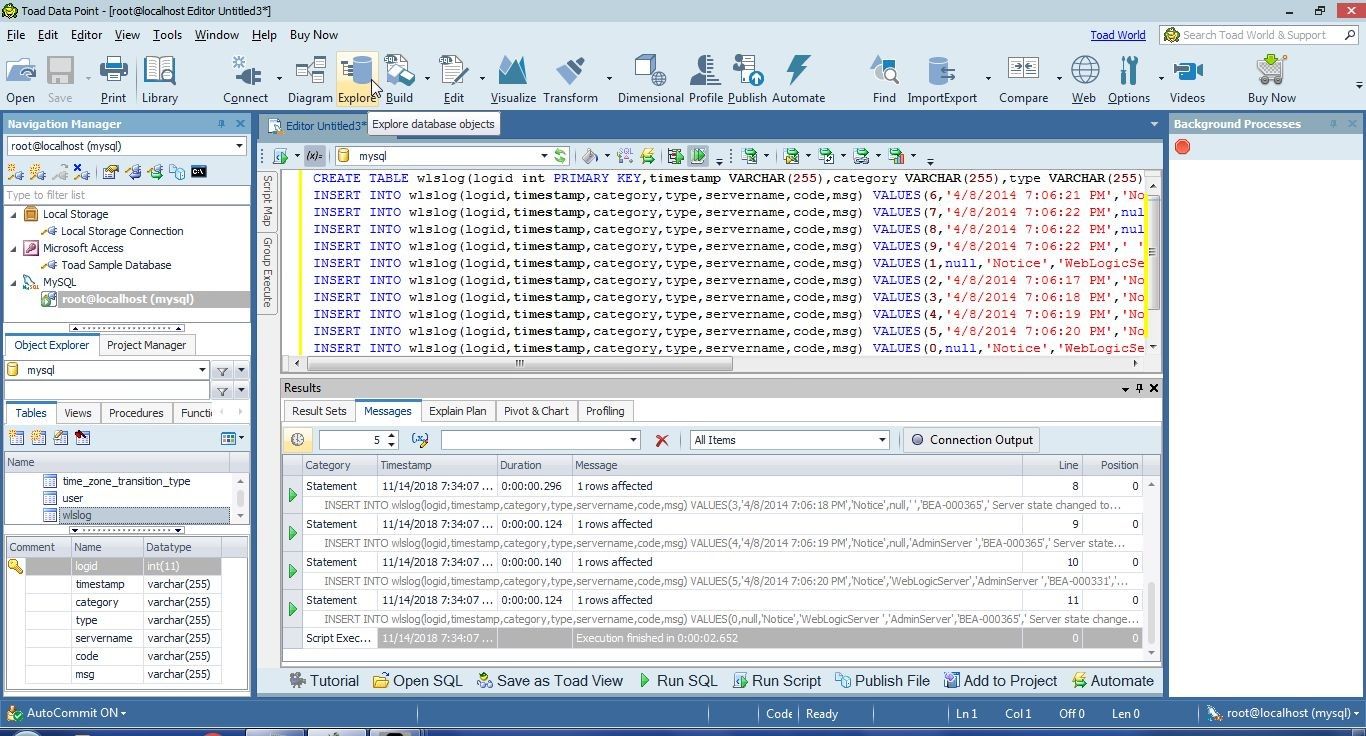
Figure 9. Explore database objects
The Viewer for the wlslog table gets displayed, as shown in Figure 10. The Columns tab displays the columns. Some data types could be improved or made more appropriate. The timestamp should be set to a Date related data type.
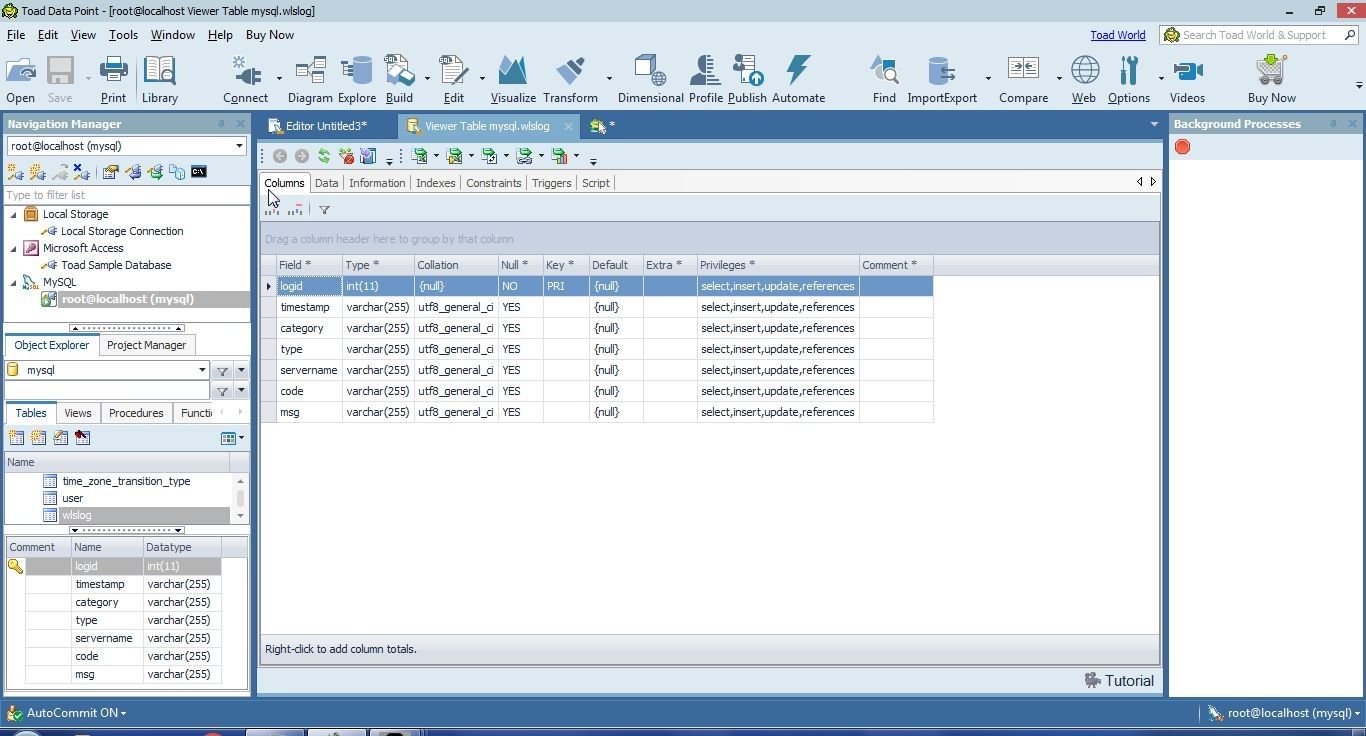
Figure 10. Viewer for wlslog Table
The Data tab displays the data, as shown in Figure 11. The data listed has missing data, as indicated by null and blank values. Some of the log messages are duplicate. Some data has extra spaces at the beginning/end or within a value.
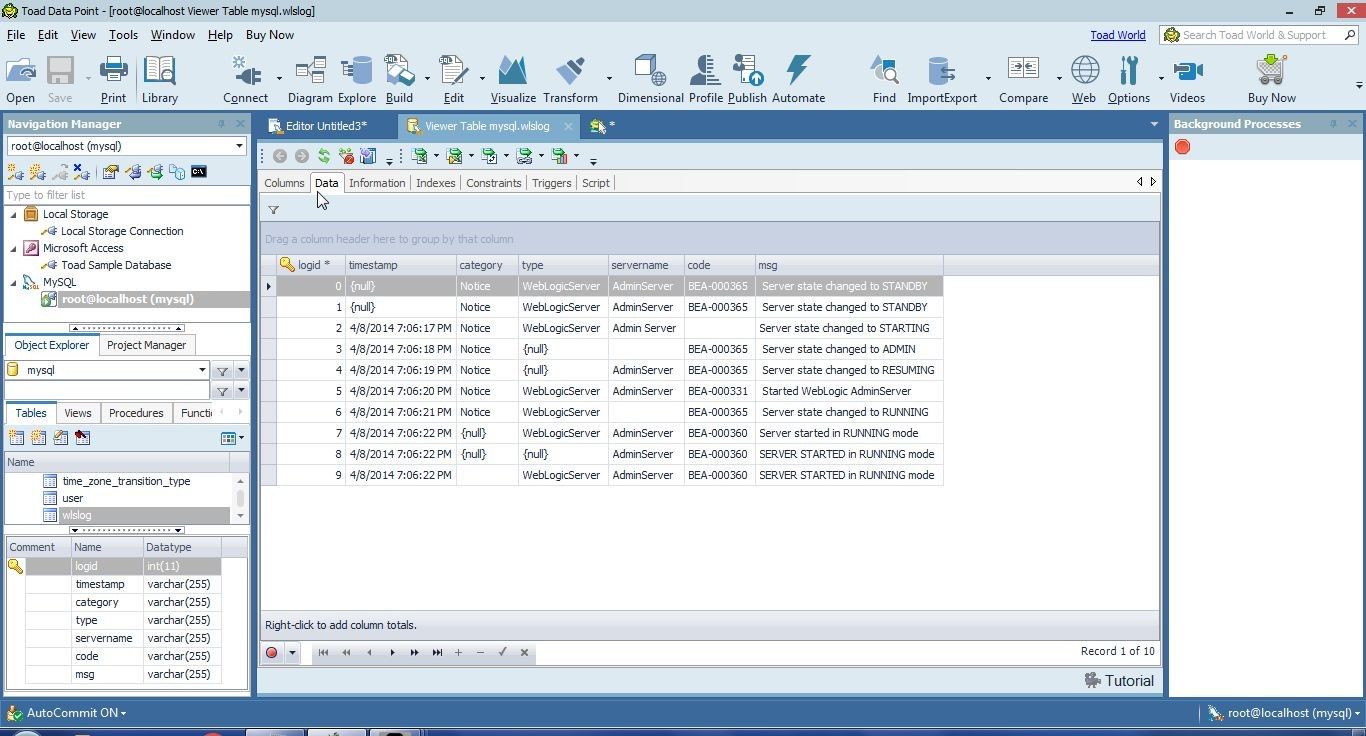
Figure 11. Data to be prepared for an Excel Report
Click on the Delete button to delete the SQL messages as shown in Figure 12.
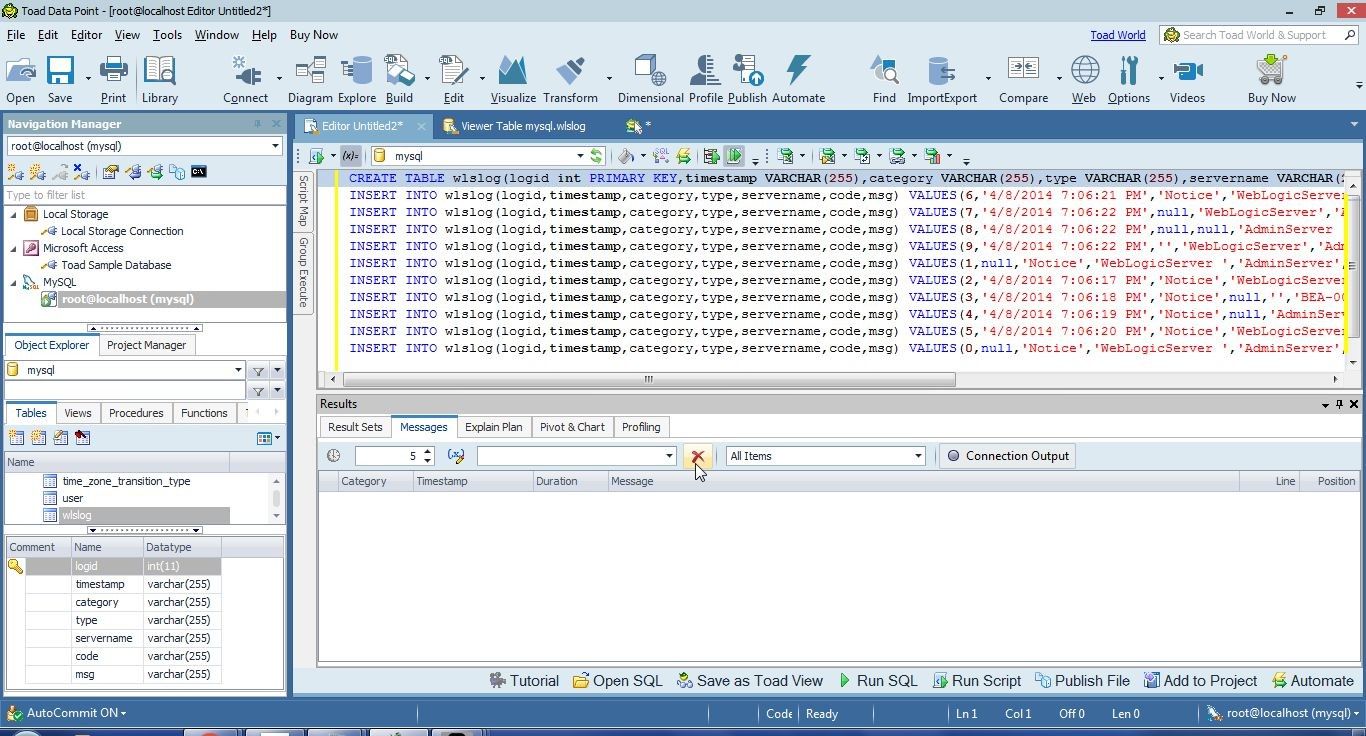
Figure 12. Deleting Messages
Click on Close to close the SQL Editor as shown in Figure 13.

Figure 13. Closing SQL Editor
Save the SQL Worksheet by selecting Yes in Modified File as shown in Figure 14.
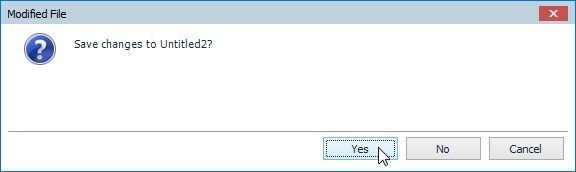
Figure 14. Saving SQL Worksheet
In Save As specify a File name (wlslog.sql) and click on Save.
Profiling Data
Before preparing data it is recommended to profile the data to find what needs to be fixed. Click on Profile Data in the toolbar as shown in Figure 15 to profile the data added to MySQL database.
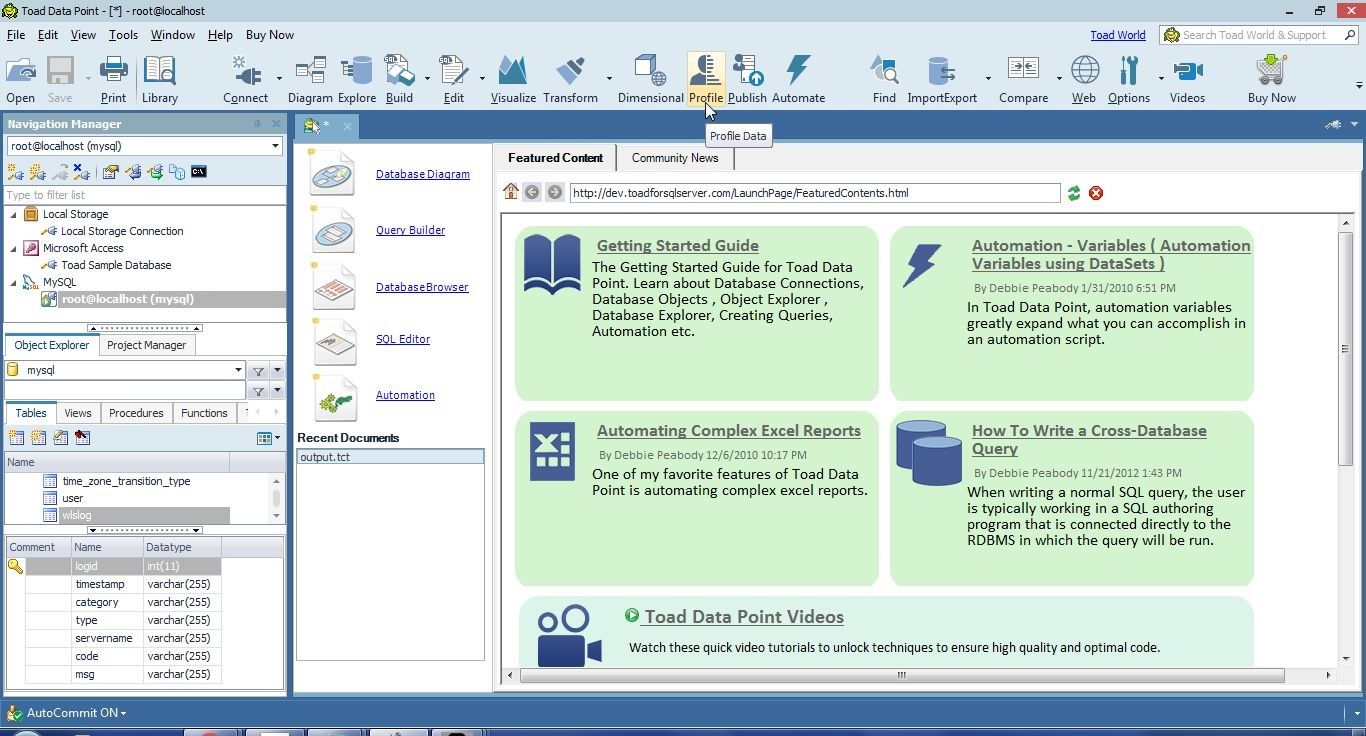
Figure 15. Profile Data
The Profiling wizard gets started, as shown in Figure 16. Select a source to profile from the mysql database.
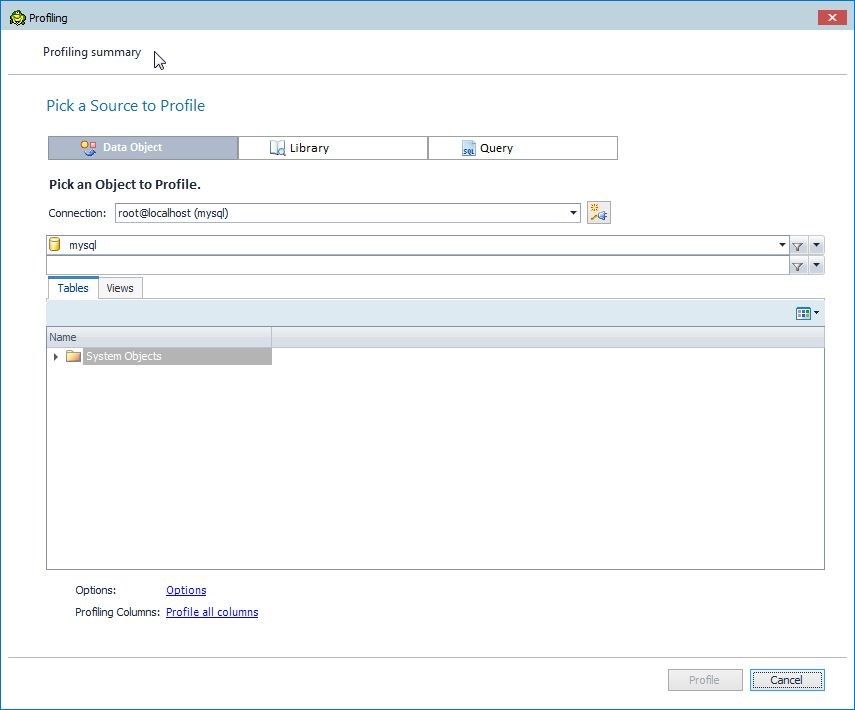
Figure 16. Profiling Wizard
Select the wlslog tab from the mysql database as shown in Figure 17.
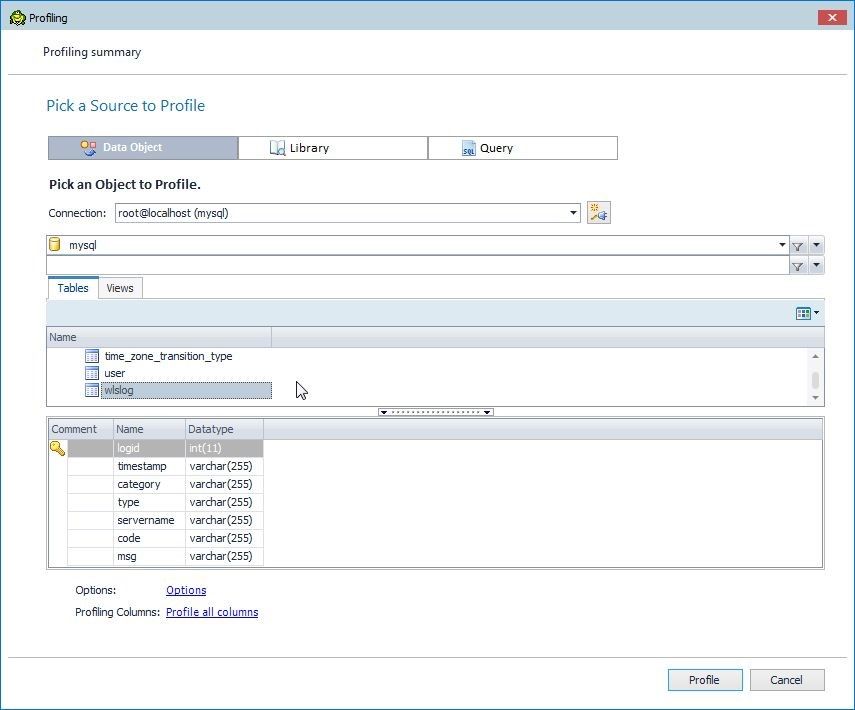
Figure 17. Selecting Table wlslog
Click on Options link as shown in Figure 18 to display/modify the profiling options.
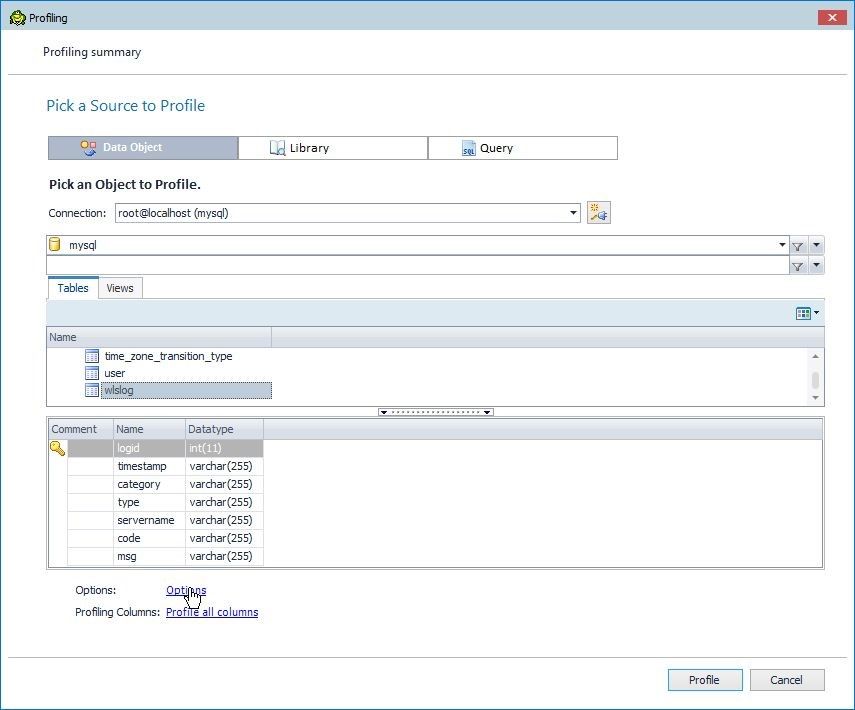
Figure 18. Options
The Options window gets displayed, as shown in Figure 19. By default the Sampling size is set to the first 1000 rows. In Data Analysis the Basic Analysis is performed by default and the option cannot be deselected. Select from the other options, which include Distinct Analysis, Pattern & String Analysis, Domain Analysis, and Enable Drill Down of Actual Values. Click on Apply after reviewing and modifying the profiling options.
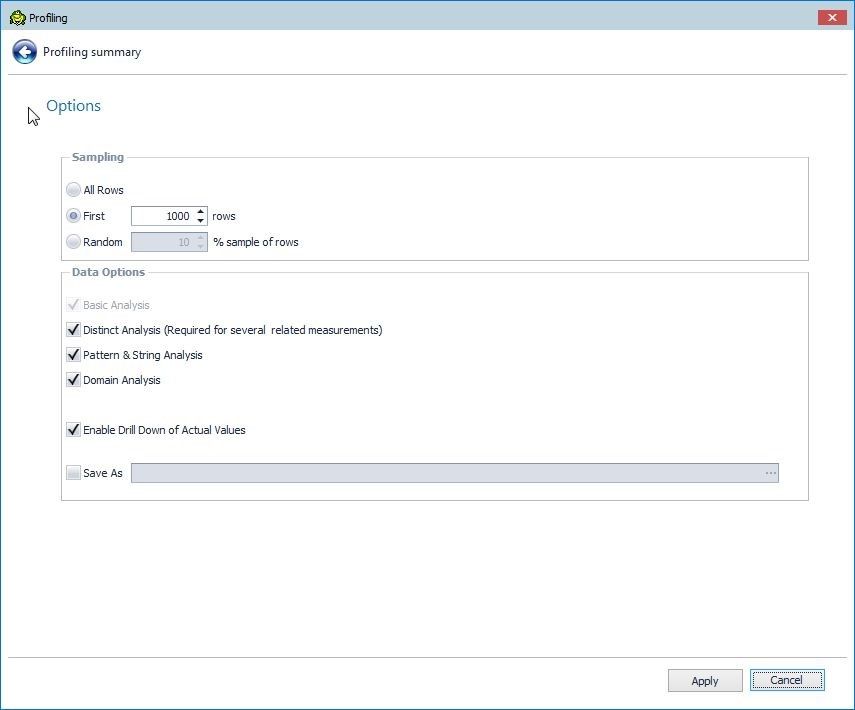
Figure 19. Profiling Options
To select columns for the different type of analysis click on the link Profile allcolumns as shown in Figure 20.
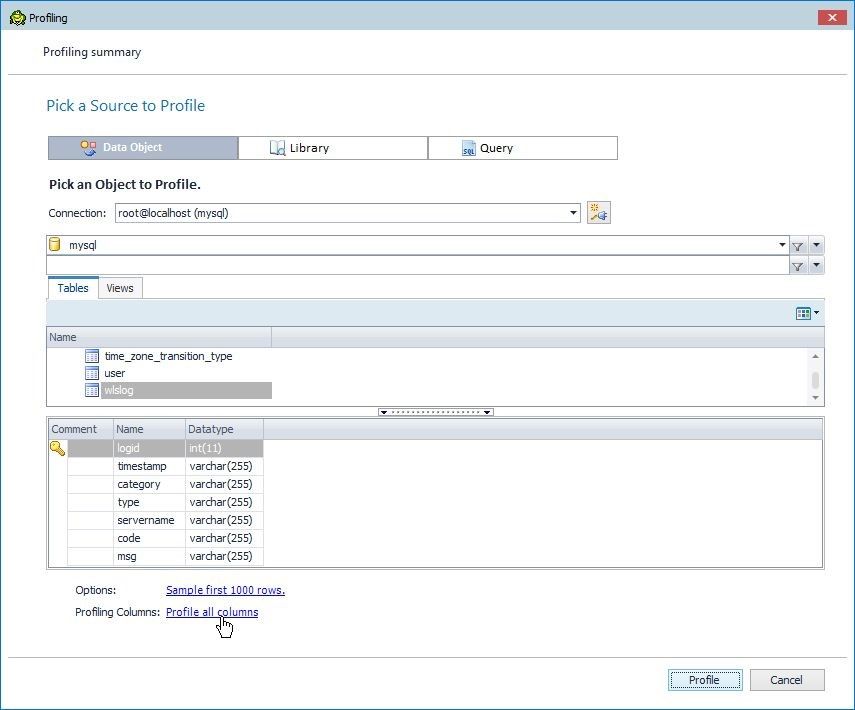
Figure 20. Profile all Columns
Column-specific analysis may be selected, as shown in Figure 21. By default all types of analysis are applied to all columns. Click on Apply.
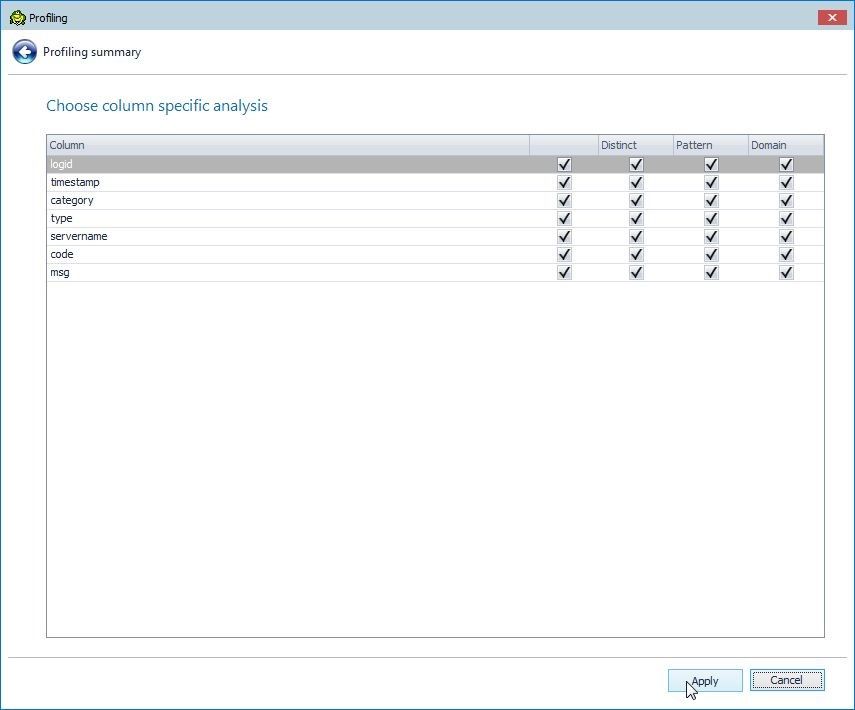
Figure 21. Column Specific Analysis
With the profiling table, columns, and options selected, click on Profile as shown in Figure 22.
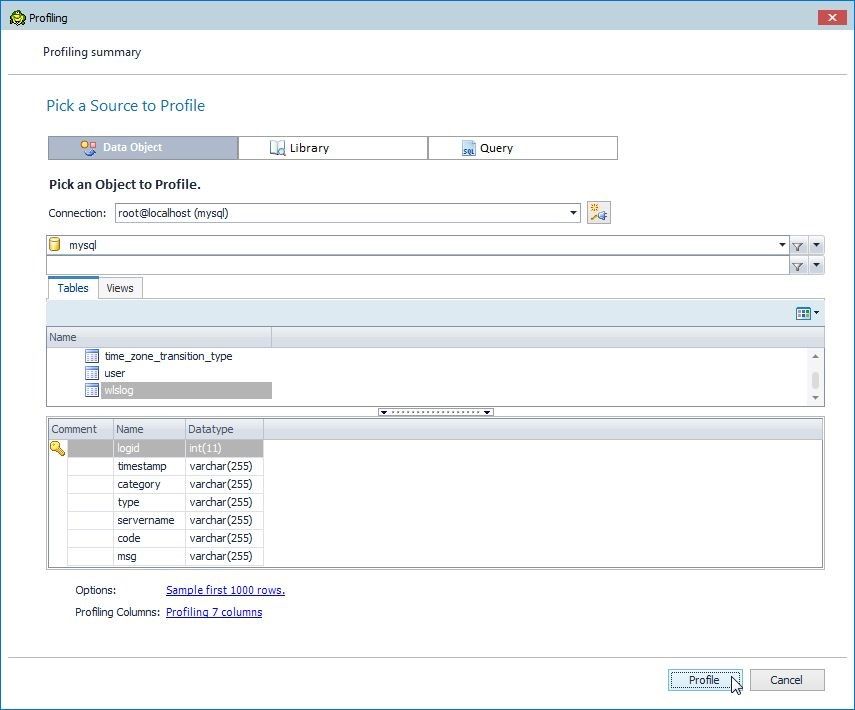
Figure 22. Starting Profiling
The Profiling wlslog window gets added, as shown in Figure 23. The Summary tab displays the summary of the profiling as a frequency histogram for all columns listed on the Y axis. By default columns are listed in the same order as in the table (wlslog). The frequency of each of the measures (Unique, Non Unique, Repeated Rows, Null, Missing) is listed along the X axis. As an example, the logid has all 10 values as unique. The timestamp column has some unique values, some non-unique or values with duplicates, some repeated rows or values that are dupicated values, and some null values. None of the timestamp values is missing.
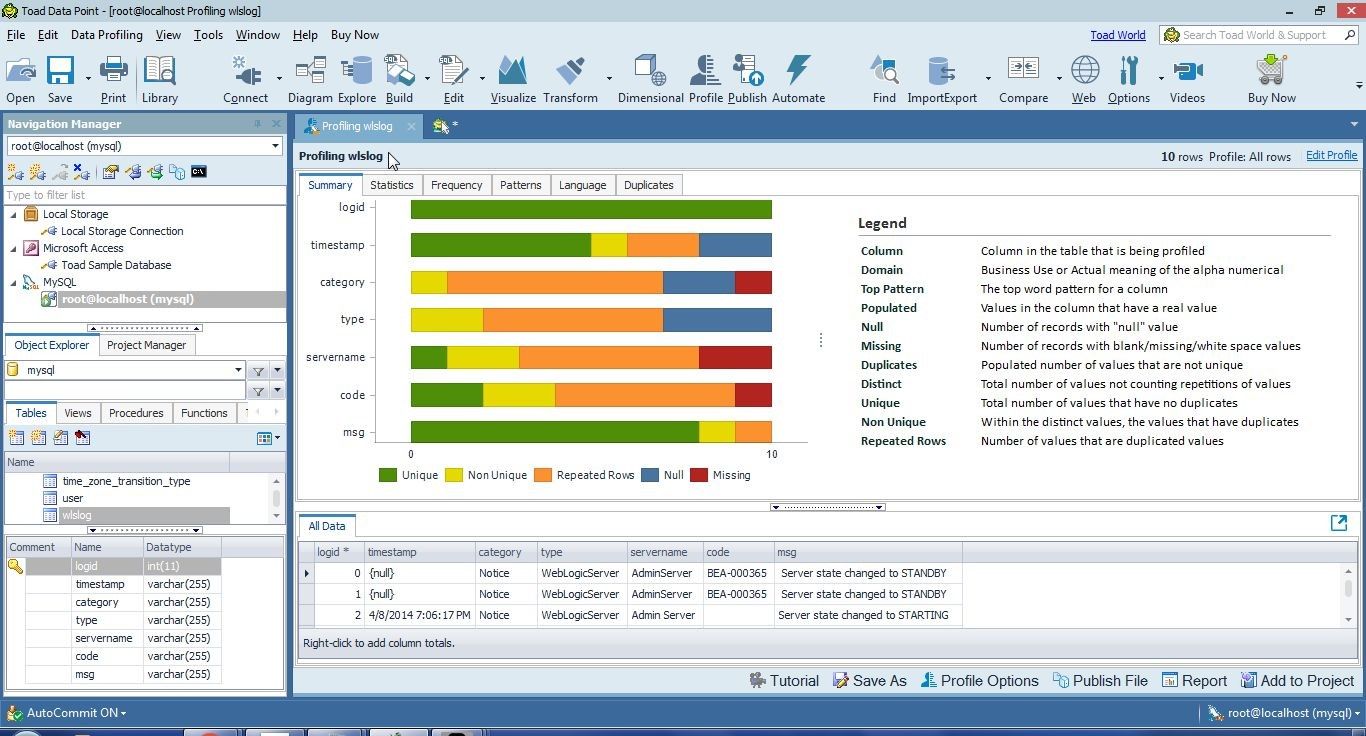
Figure 23. Profiling wlslog
The order in which the columns are listed along the Y axis is set by the selected criterion in the Legend. If Column is selected in the Legend, as shown in Figure 24, columns are displayed alphabetically.
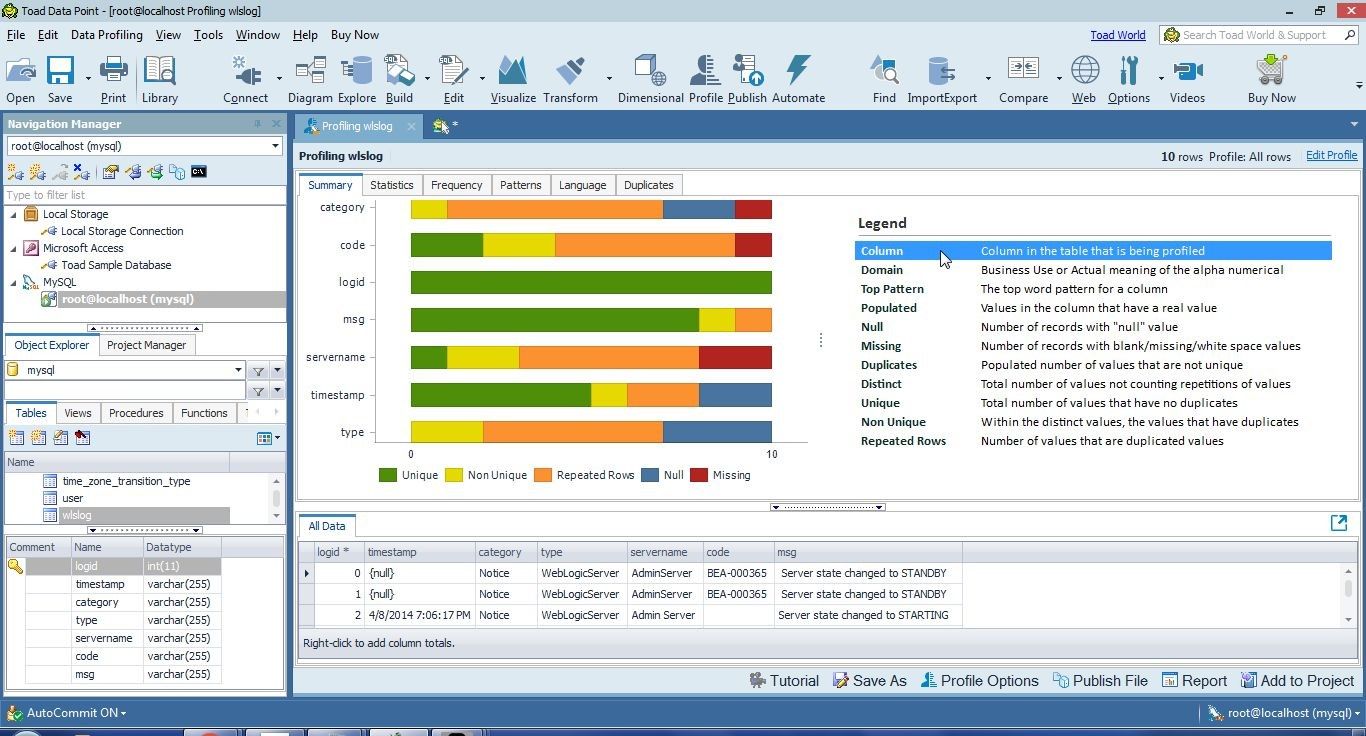
Figure 24. Legend>Columns
Selecting Domain in the Legend displays the columns in the order as defined in the table. If Top Patterns is selected in Legend the columns are displayed according to the column with the greatest number of unique word and letter patterns, as shown in Figure 25. Patterns are discussed in more detail later in this section.
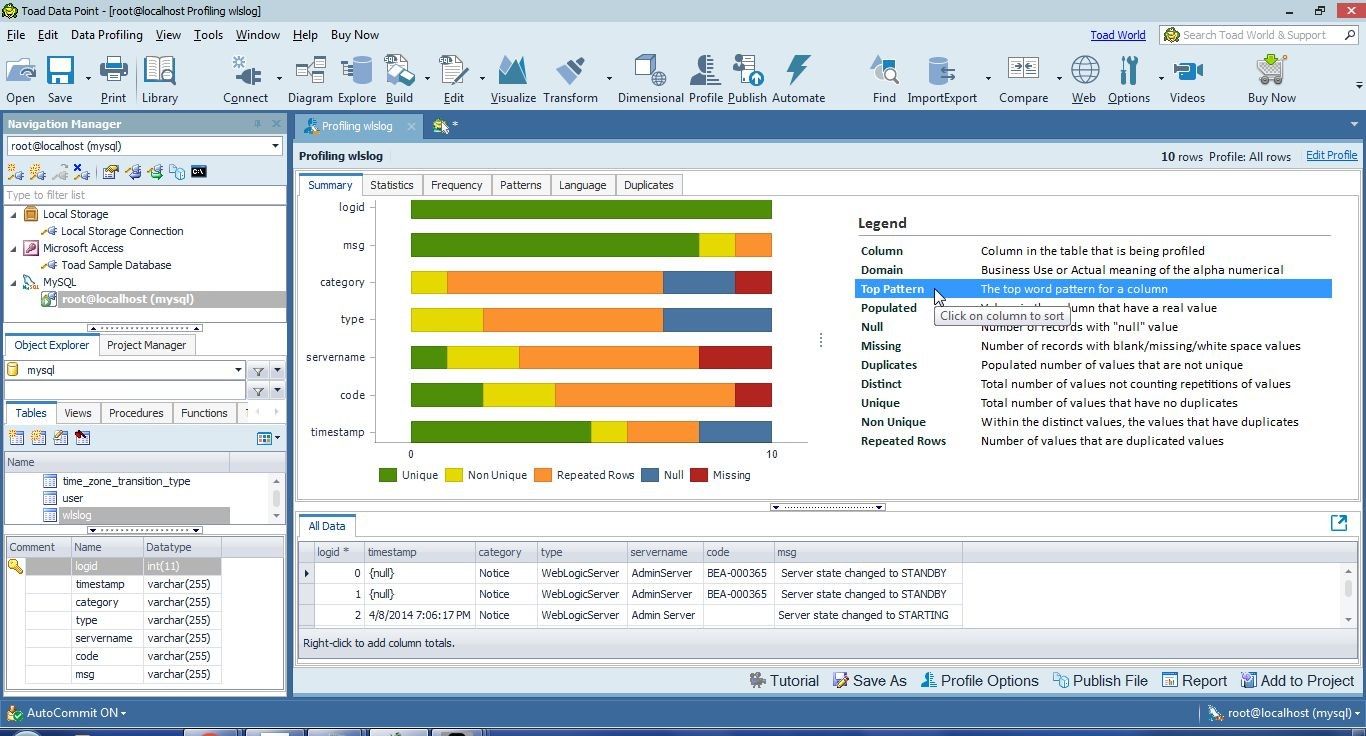
Figure 25. Legend>Top Patterns
If Populated is selected in Legend the columns are displayed based on which column has a real value in most rows and is not set to 0, null value, or blank value; as shown in Figure 26. The msg column has a real value in all rows and is at the top along the Y axis. The category column has twonull values and one missing value and is at the bottom.
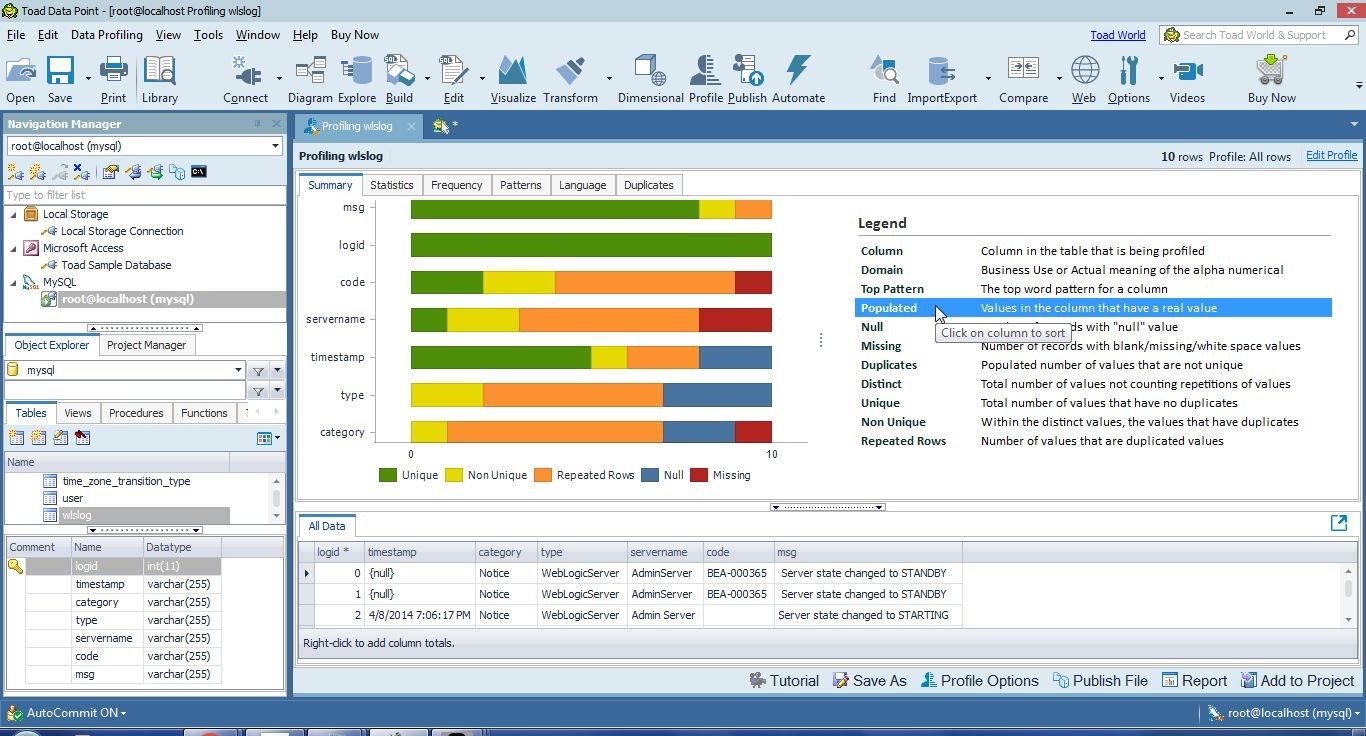
Figure 26. Legend>Populated
Select Null in Legend, and thetype column gets listed at the top along the Y axis because it has the most null values (3), as shown in Figure 27.
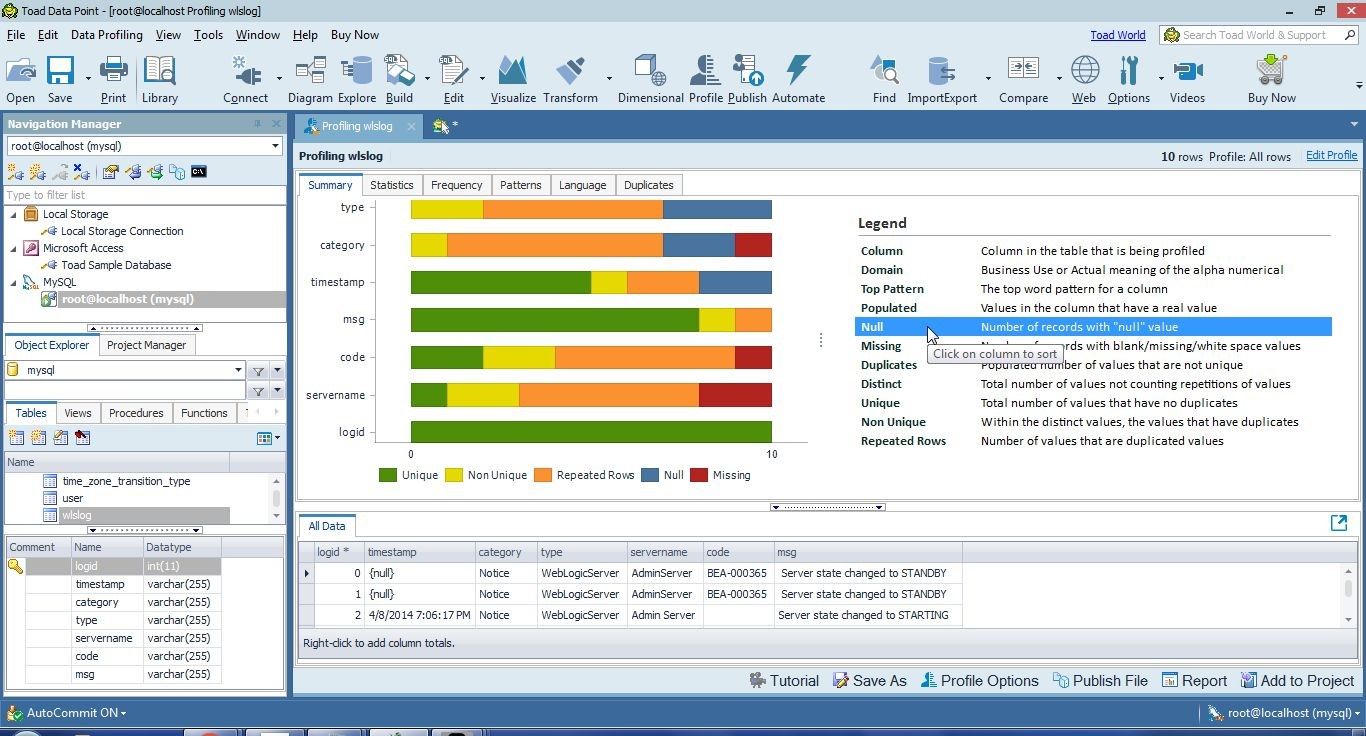
Figure 27. Legend>Null
Select Missing in Legend, and the servername column gets listed at the top because it has the most missing values (2), as shown in Figure 28. Missing values include blank/missing/white space values.
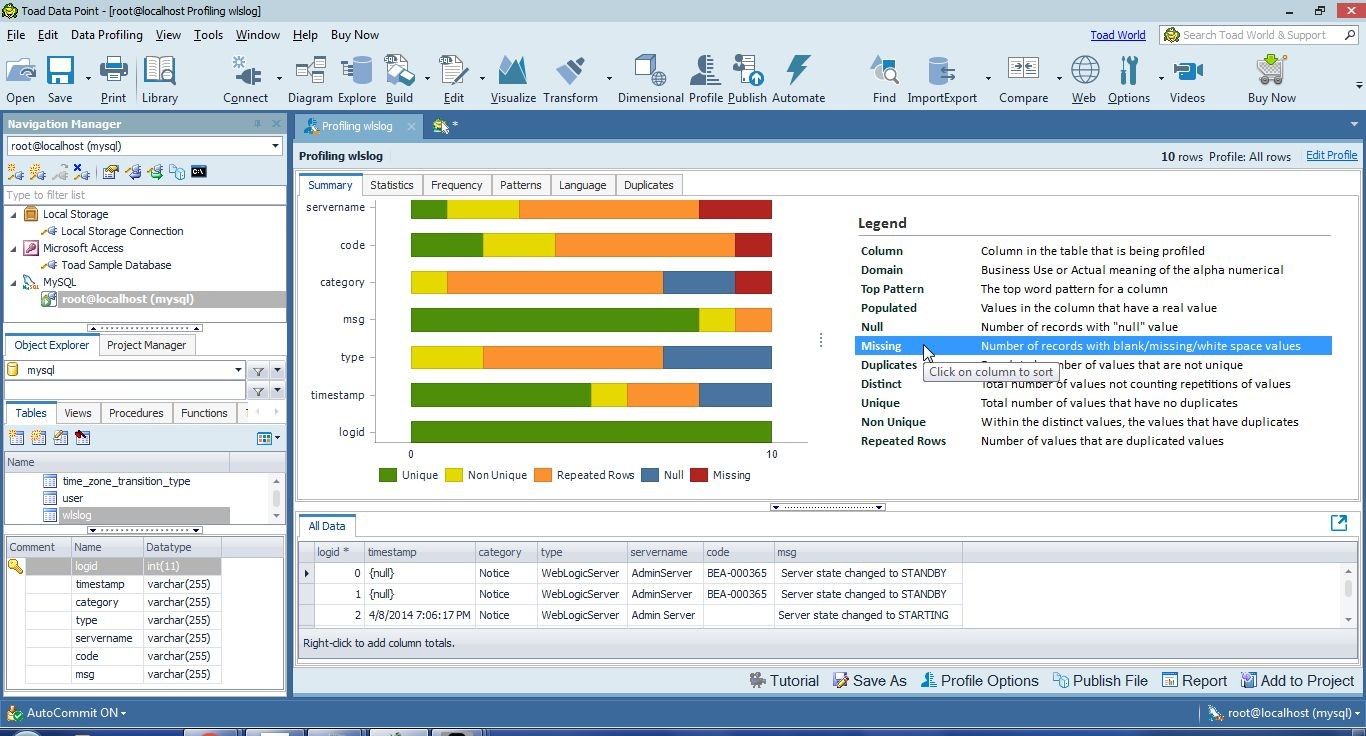
Figure 28. Legend>Missing Values
Select Duplicates in Legend, and the columns get displayed along the Y axis based on which column has the most real values (not null or missing values) that are duplicated, as shown in Figure 29. The code column is at the top because it has 2 real values (BEA-000360 and BEA-000365) that are duplicated. Some of the other columns have one real value that is duplicated.
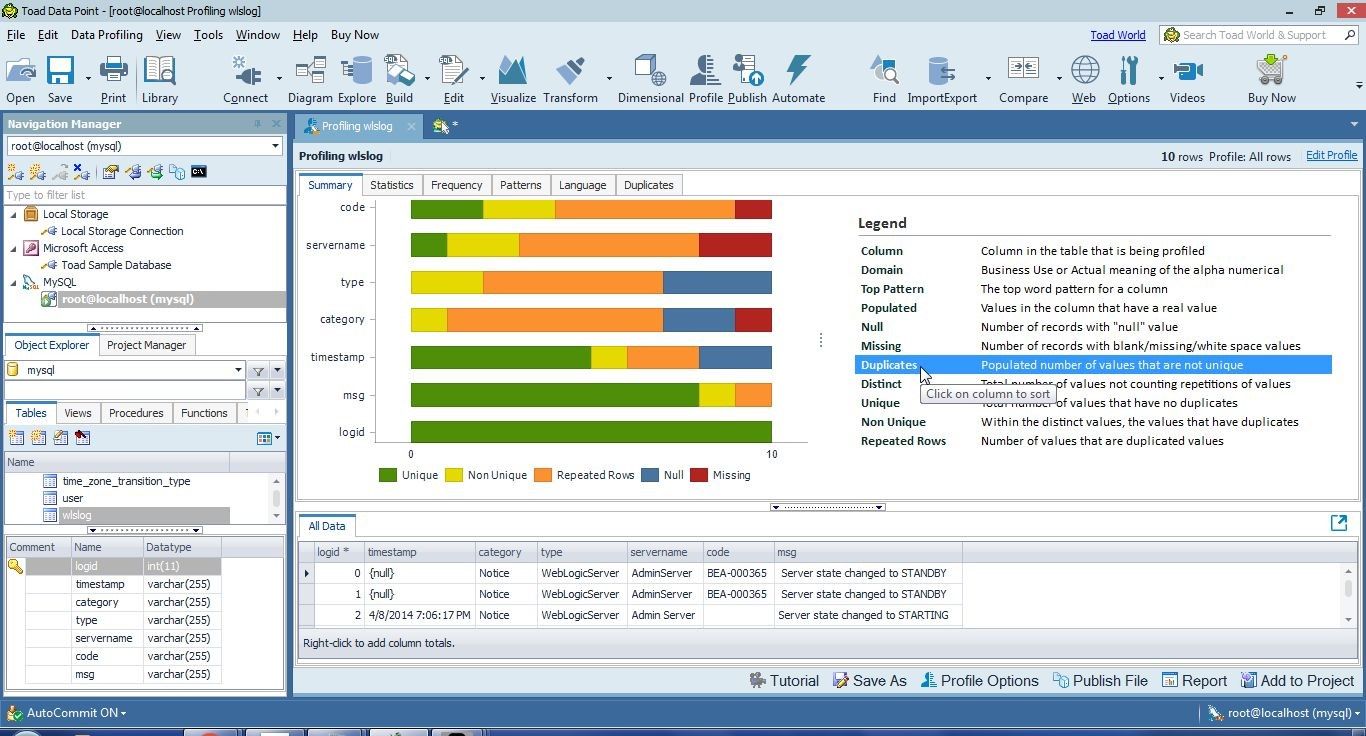
Figure 29. Legend>Duplicates
Select Distinct in Legend to display columns based on which column has the greatest number of distinct values; that is, the total number of values not counting repetitions of values, as shown in Figure 30. The logid column has all distinct values. The msg column is listed second and has some repeated rows. The category column is listed last as it has only one distinct value. The type column is listed above type as it has distinct values AdminServer and Admin Server.
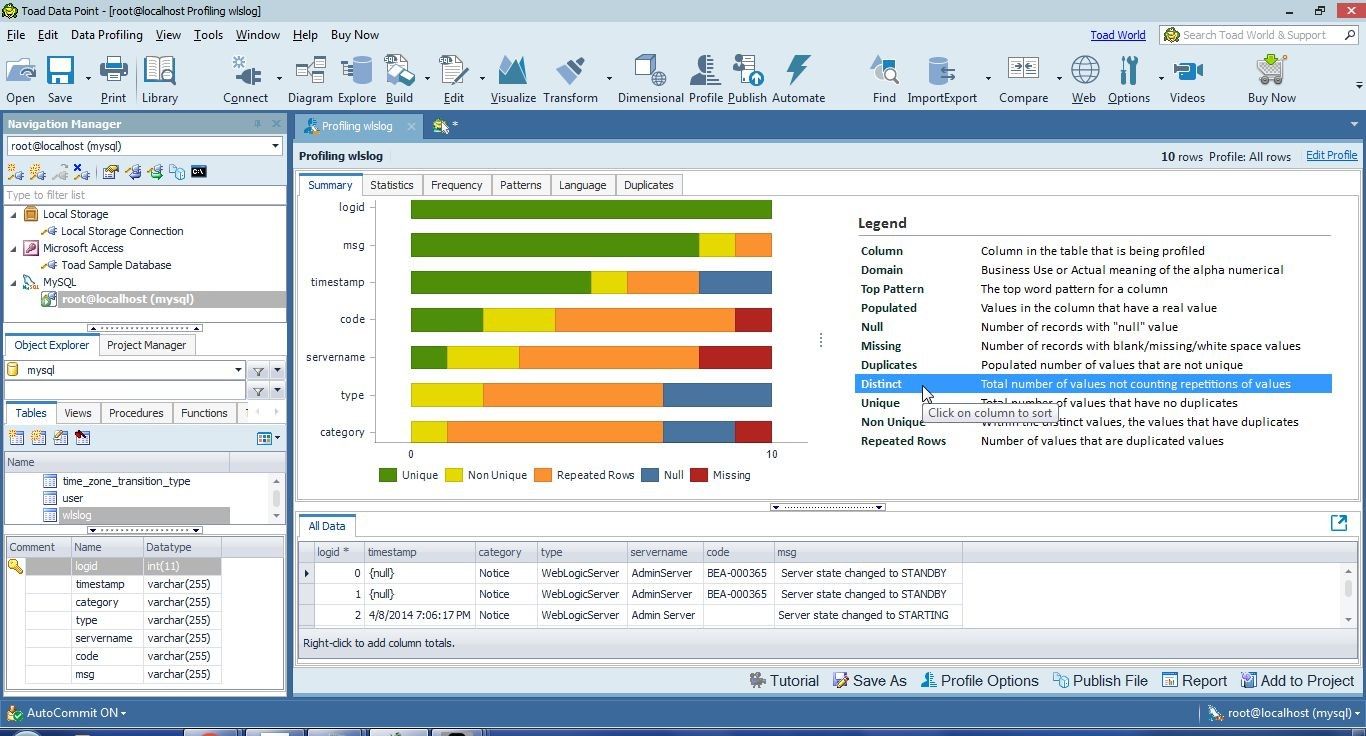
Figure 30. Legend>Distinct
Select Unique in the Legend to order the columns based on the frequency of unique values; within the distinct values, the values that have no duplicates, as shown in Figure 31. The logid has all unique values and is listed at the top.
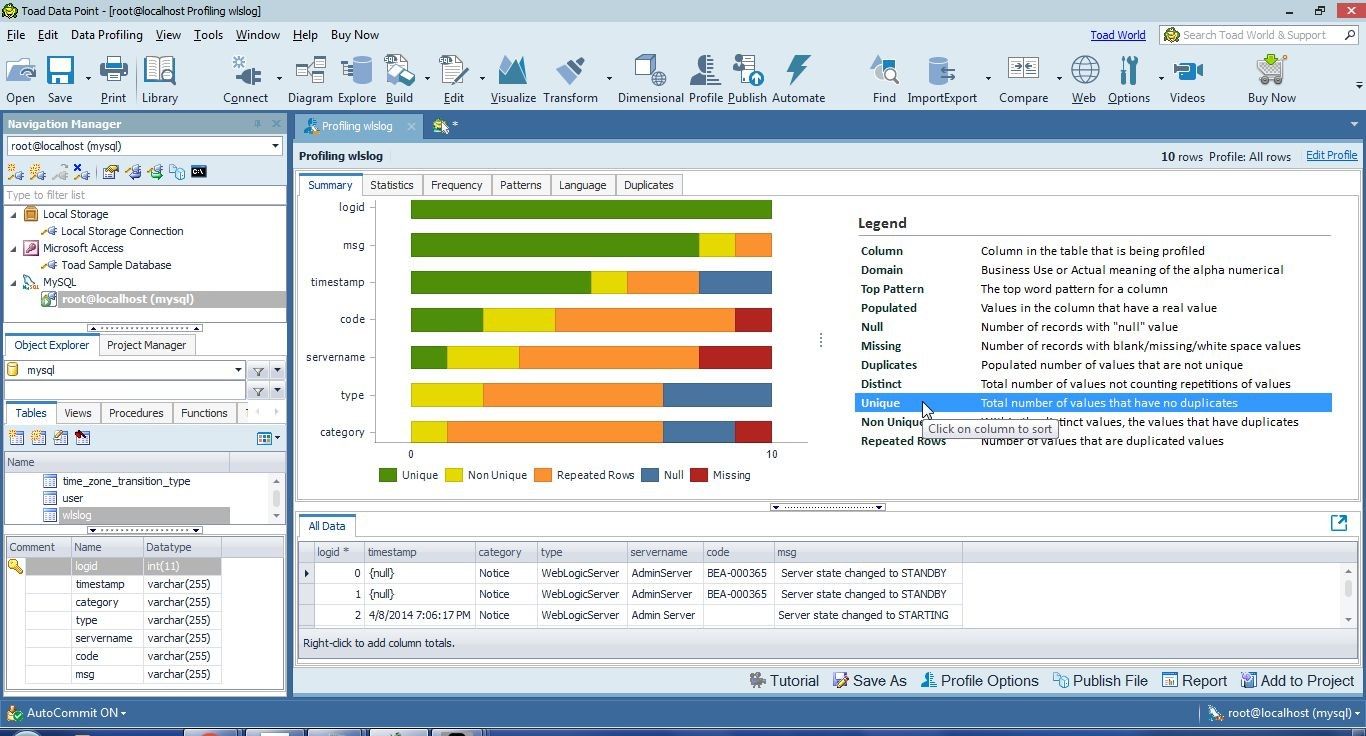
Figure 31. Legend>Unique
Select Non Unique in Legend to display the column order based on non-unique values; within the distinct values, the values that have duplicates, as shown in Figure 32.
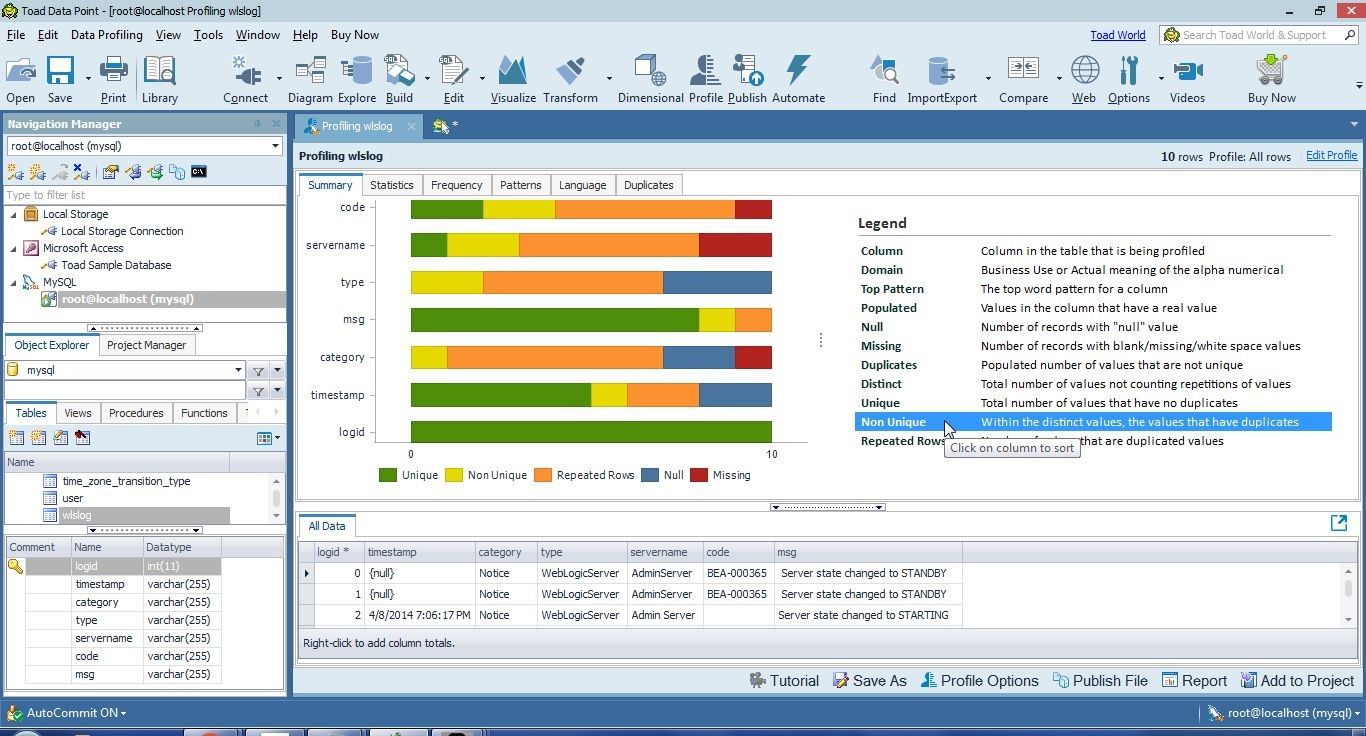
Figure 32. Legend>Non Unique
Select Repeated Rows in Legend to display the column order based on the frequency of duplicated values, as shown in Figure 33. The duplicated values could be the same value duplicated across all rows, as in the category column, or different values duplicated. The category column is at the top as it has 7 duplicated values. The code column has also 7 values that are duplicated values.
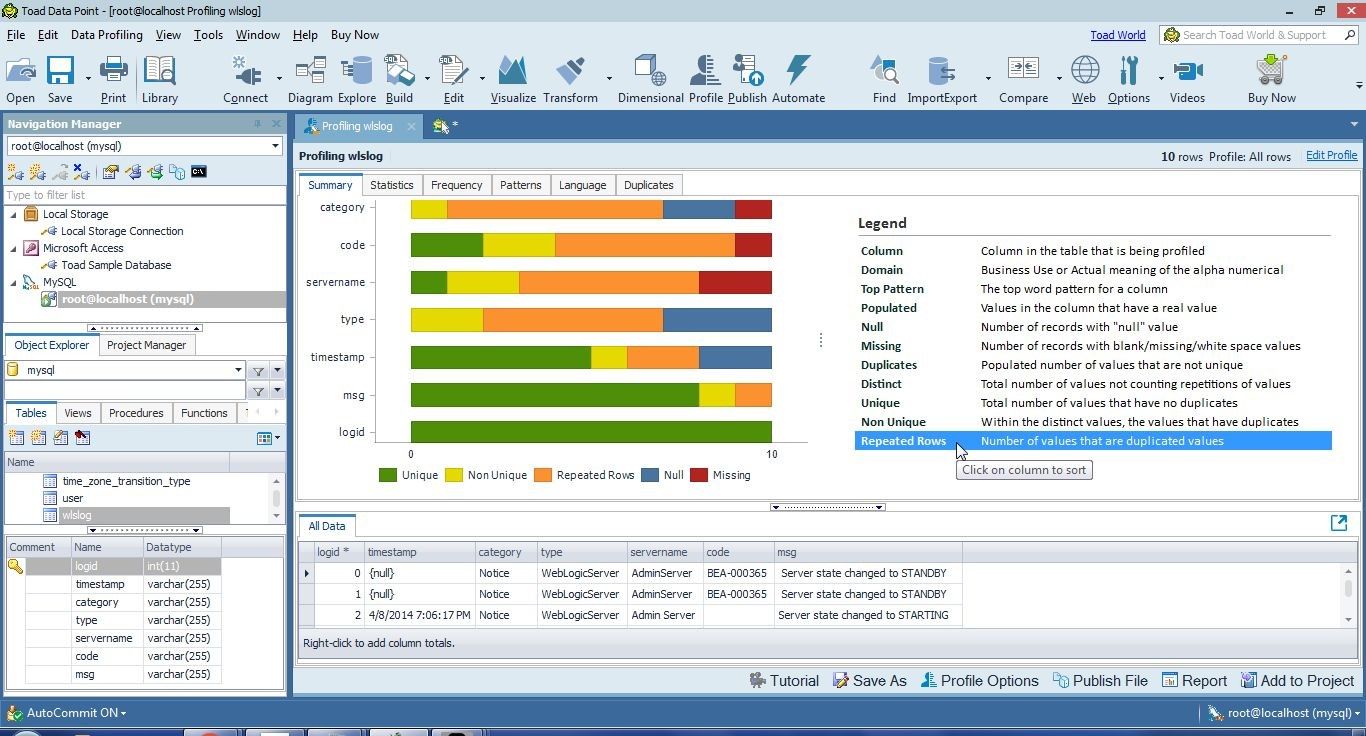
Figure 33. Repeated Rows
The detail for a column may be displayed by positioning the cursor over a column, as shown for logid in Figure 34.
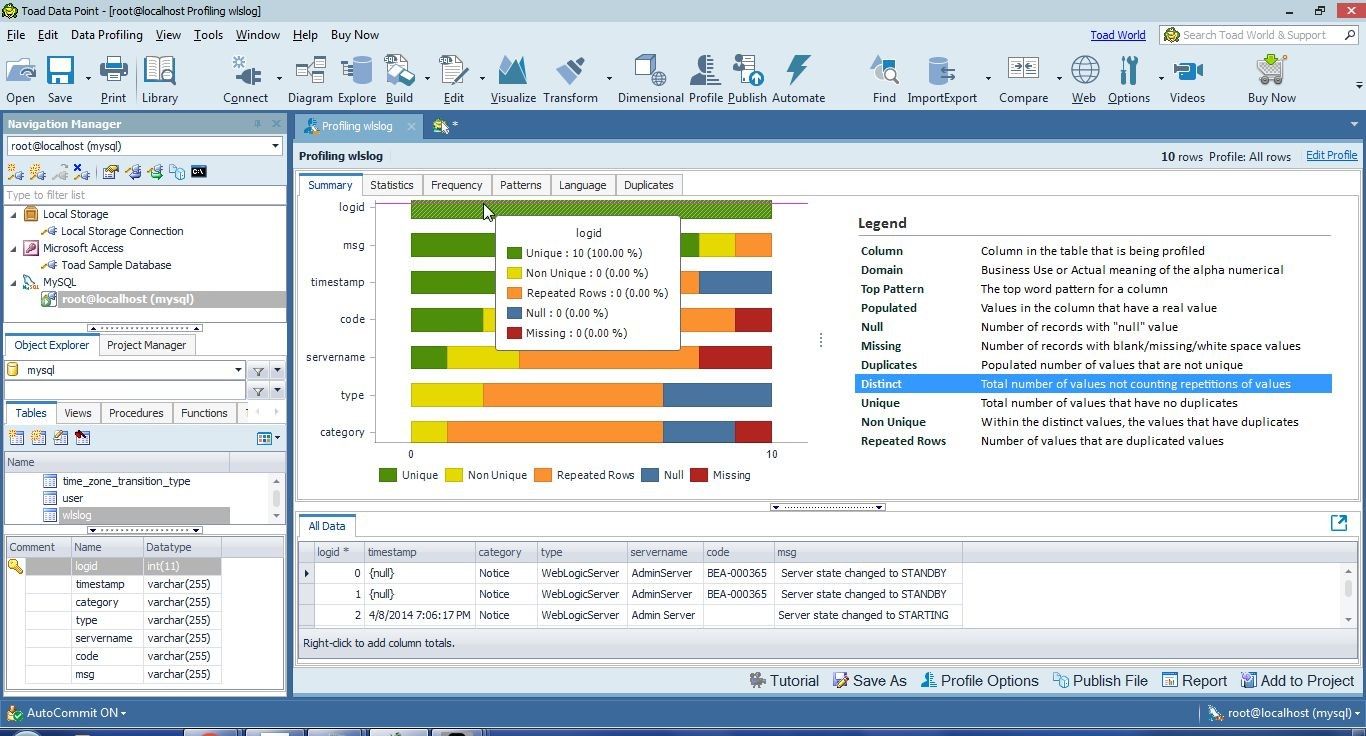
Figure 34. Column Detail
The All Data tab displays the data in the wlslog table, as shown in Figure 35.
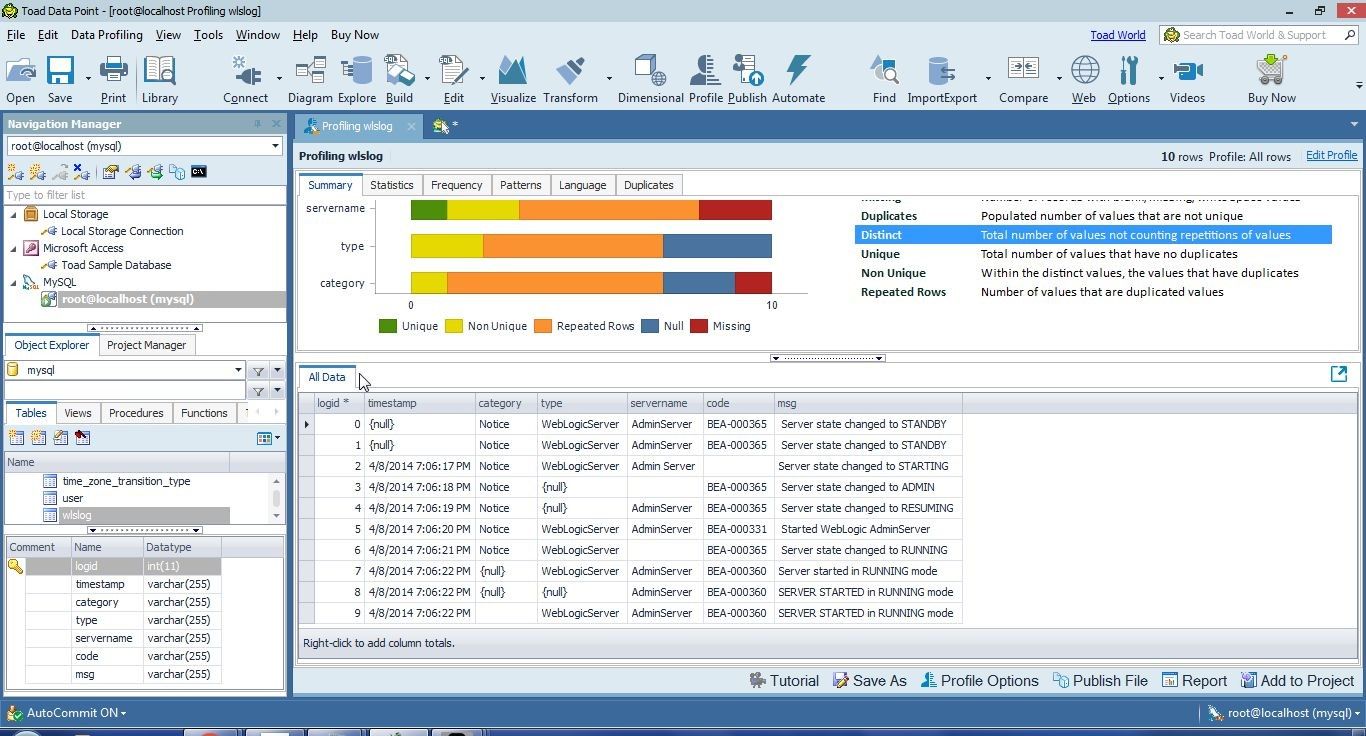
Figure 35. All Data
The Statistics tab displays the per-column statistics, as shown for the logid column in Figure 36.
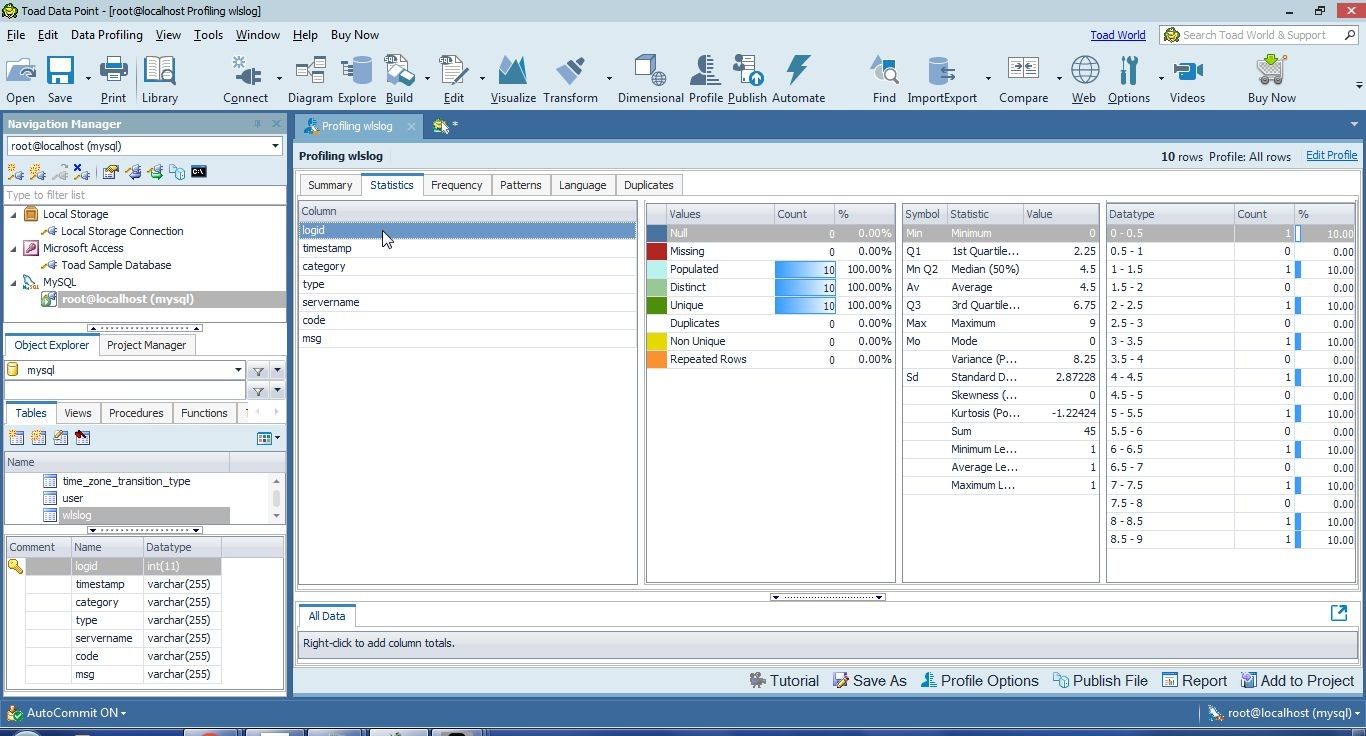
Figure 36. Per Column Statistics
Similarly, the timestamp column statistics are shown in Figure 37.
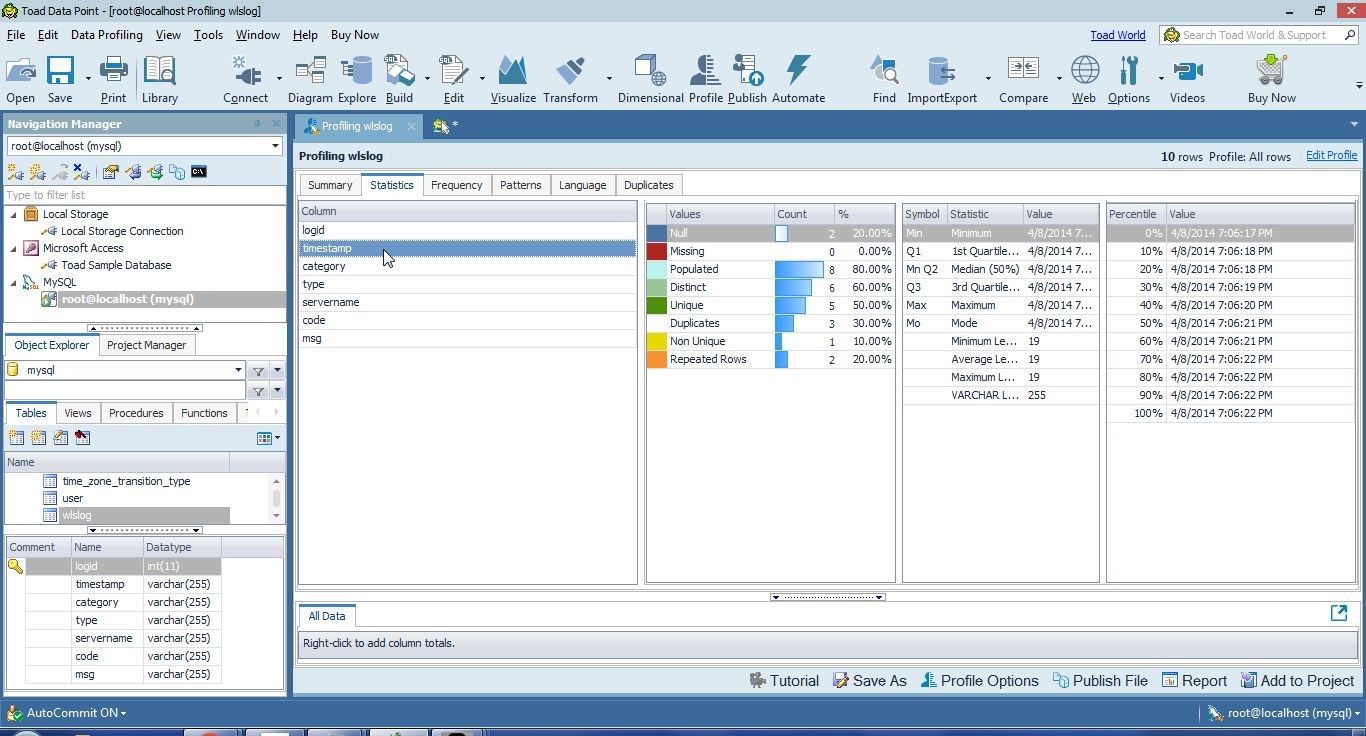
Figure 37. Statistics for timestamp Column
The Frequency tab displays the frequency for each column, as shown for the logid column in Figure 38. Top Values, Bottom Values, First Values and Last Values are displayed in separate tables.
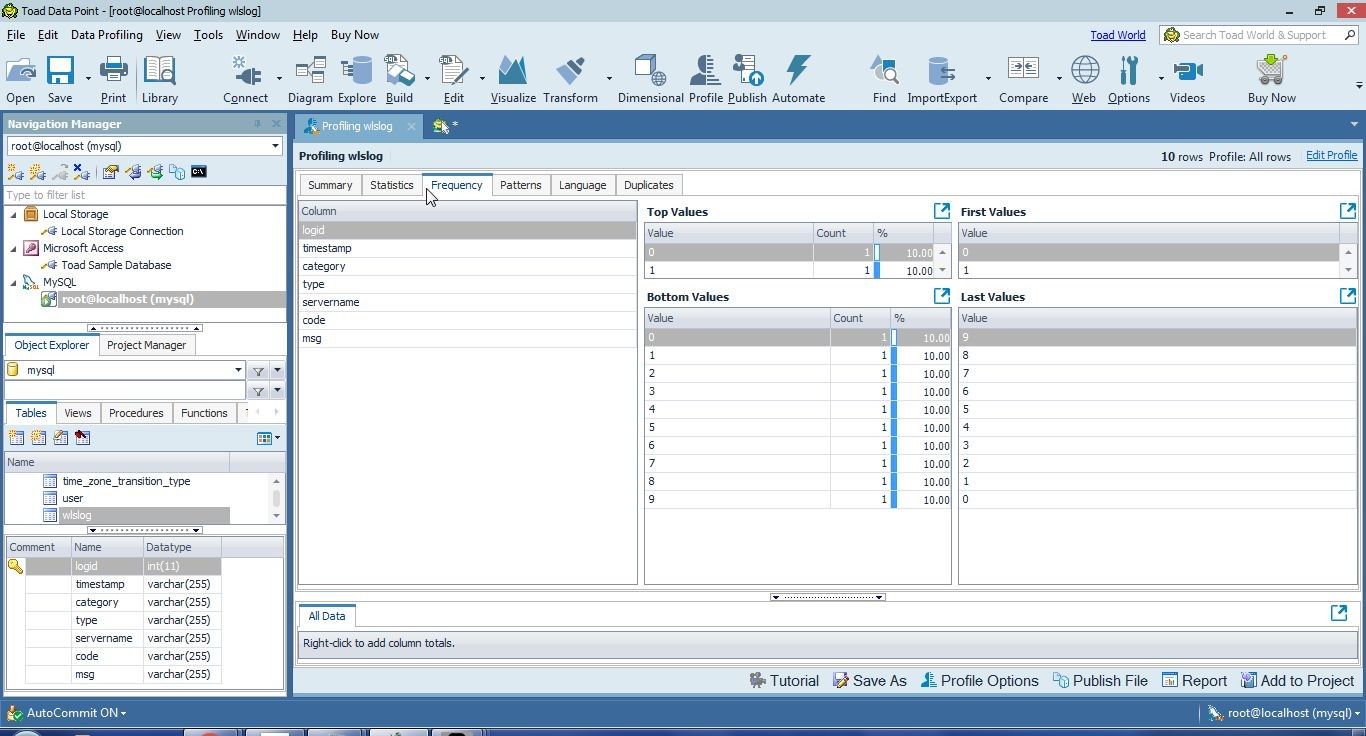
Figure 38. Frequency
The Patterns tab displays the Word patterns and Letter patterns within each column, as shown for the timestamp column in Figure 39.
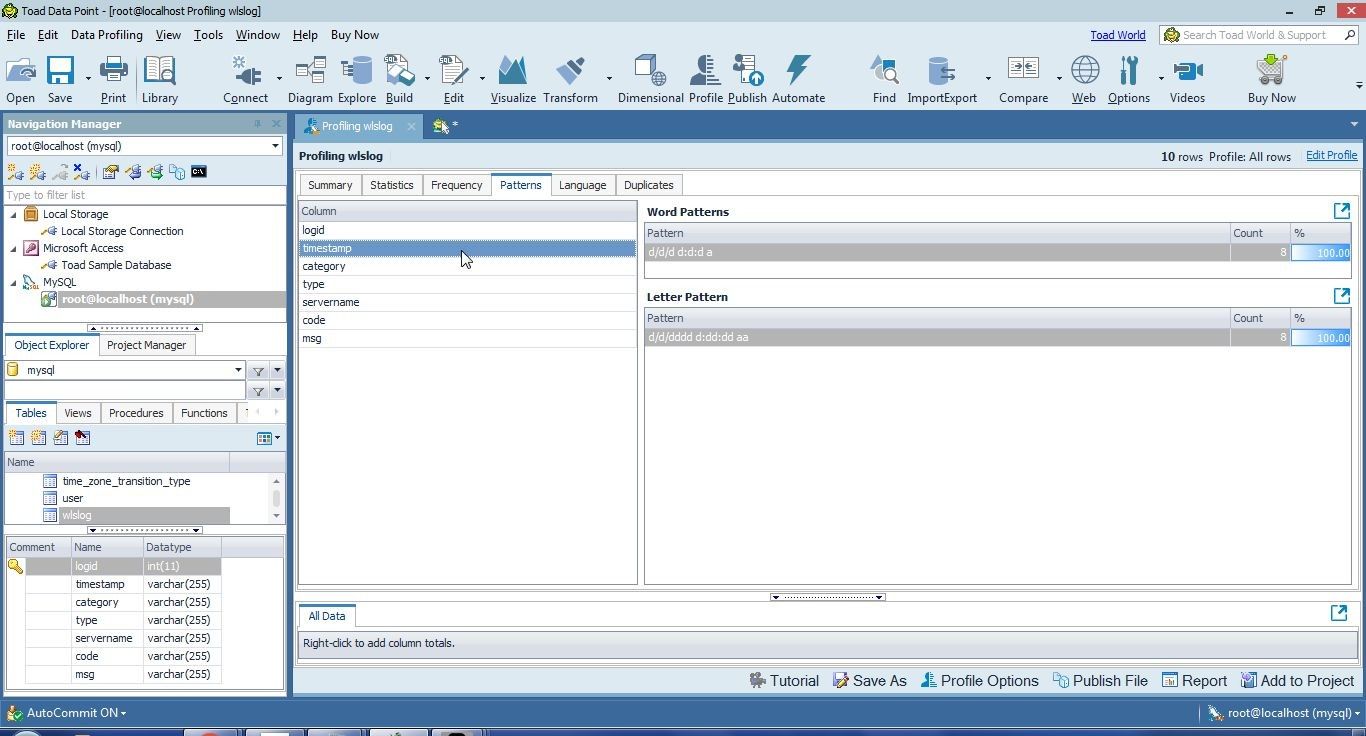
Figure 39. Patterns
The msg column has the most patterns, as shown in Figure 40.
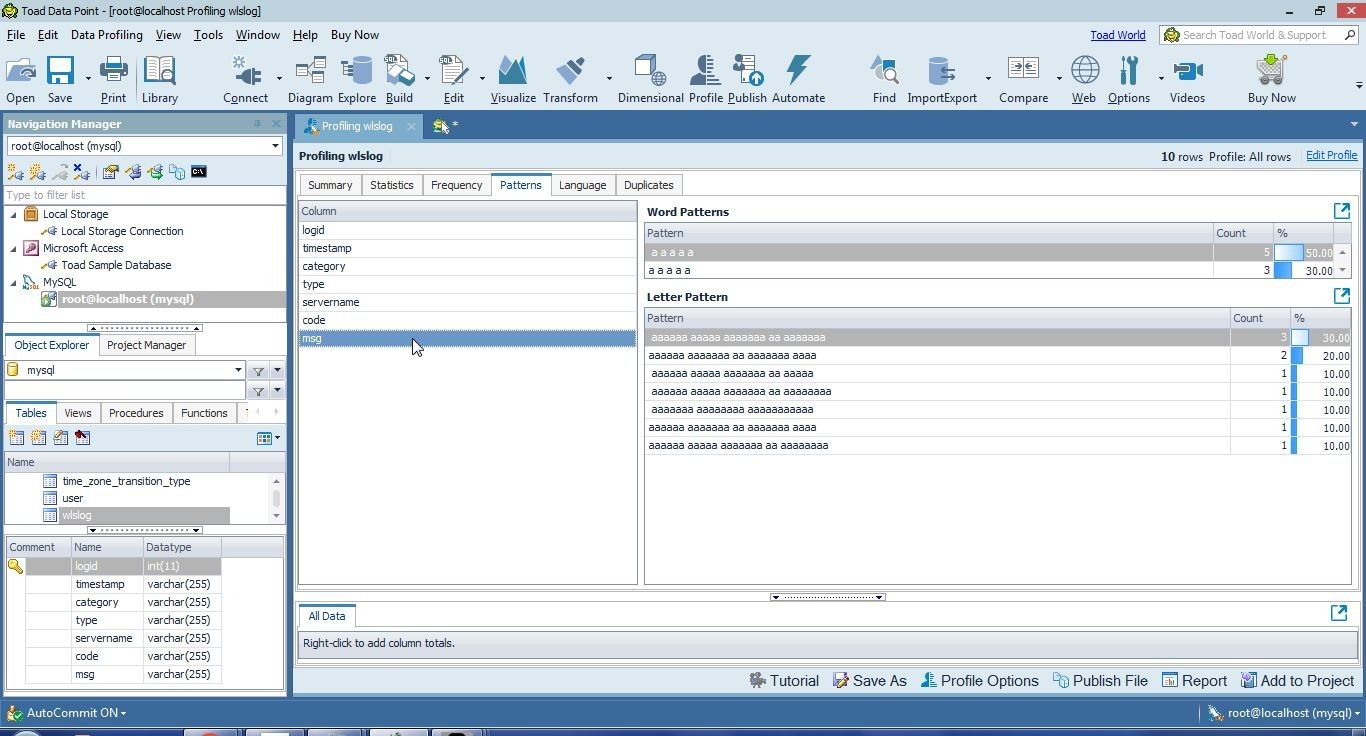
Figure 40. Patterns in msg Column
The Duplicates tab may be used to check for duplicates. Select one or more columns to check for duplicates. As an example, include the logid column and click on Check Duplicates as shown in Figure 41.
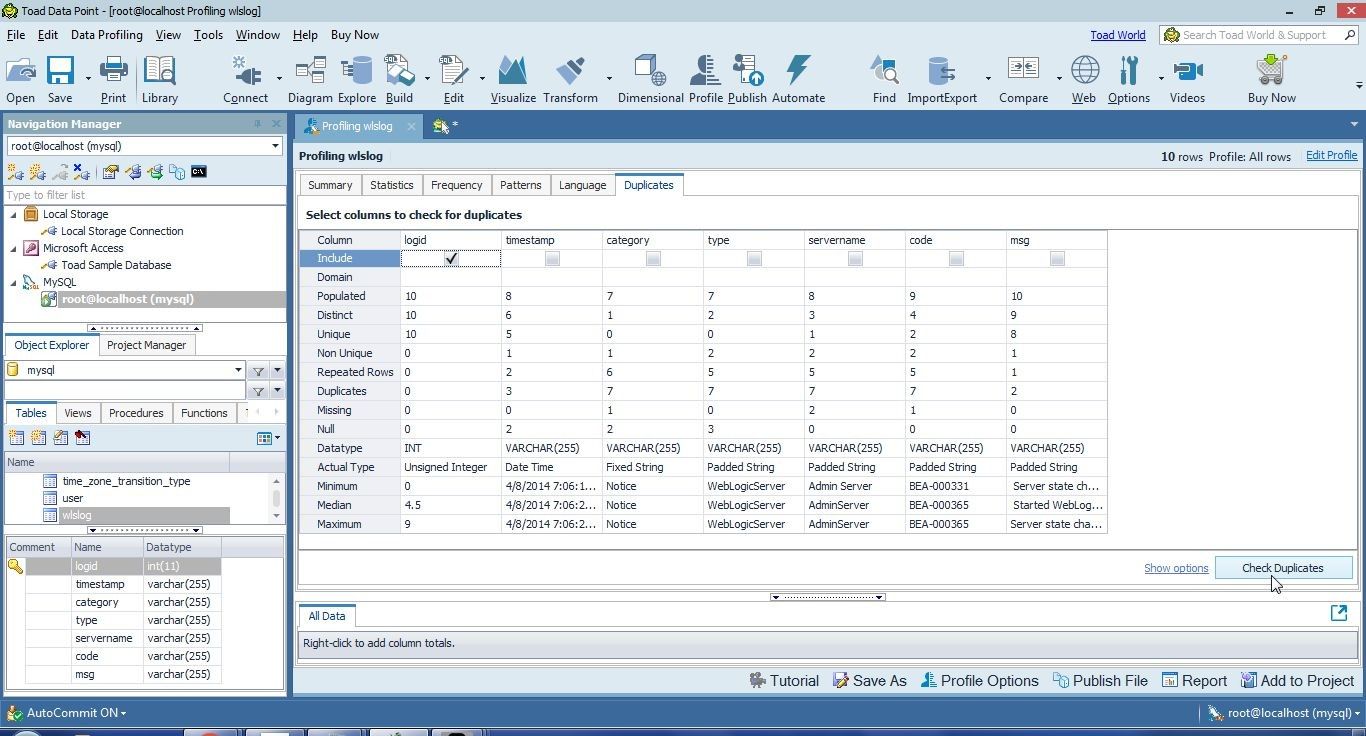
Figure 41. Check for Duplicates
No duplicates are listed for the logid column, as shown in Figure 42.
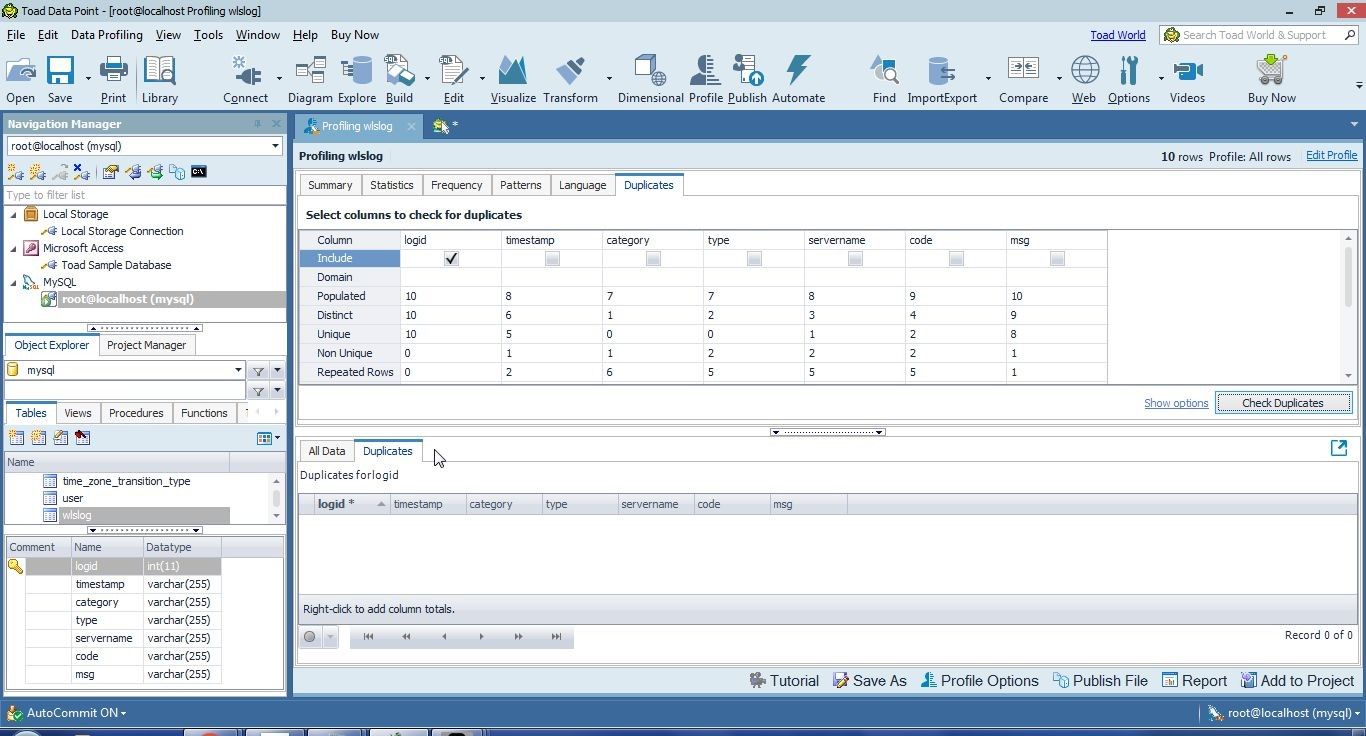
Figure 42. No Duplicates in logid Column
As another example, include timestamp, code and msg to check for duplicates; two rows have the same value in each of the included columns, as indicated by Count=2 in Figure 43.

Figure 43. Two rows with duplicated Column Values
The column values are compared based on various criteria or options. Click on Show options as shown in Figure 44 to display the options.
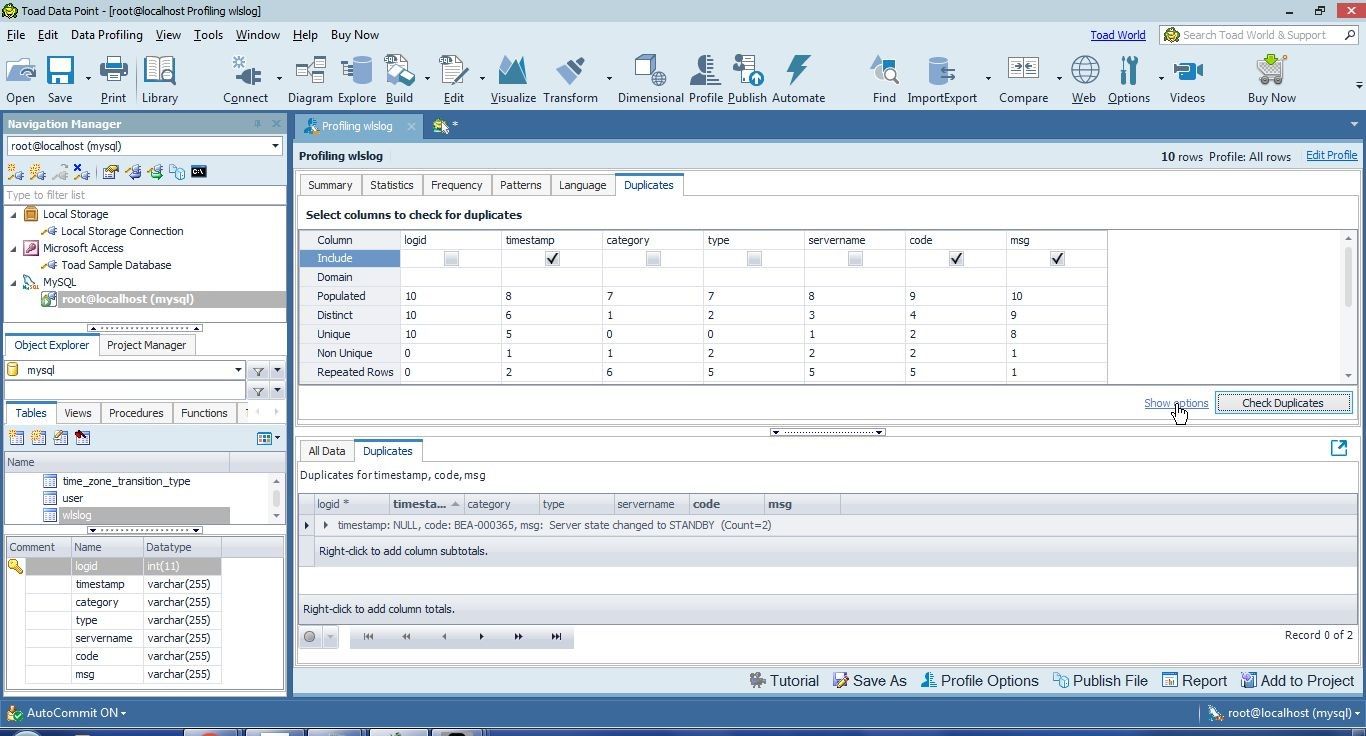
Figure 44. Show options
The different options are displayed in Figure 45. The Source Options include Profile Sample and All Rows. String Comparison options are Exact, Case Insensitive and Fuzzy. Similarly, Date and Time Comparison options and Number Comparison options may be selected.
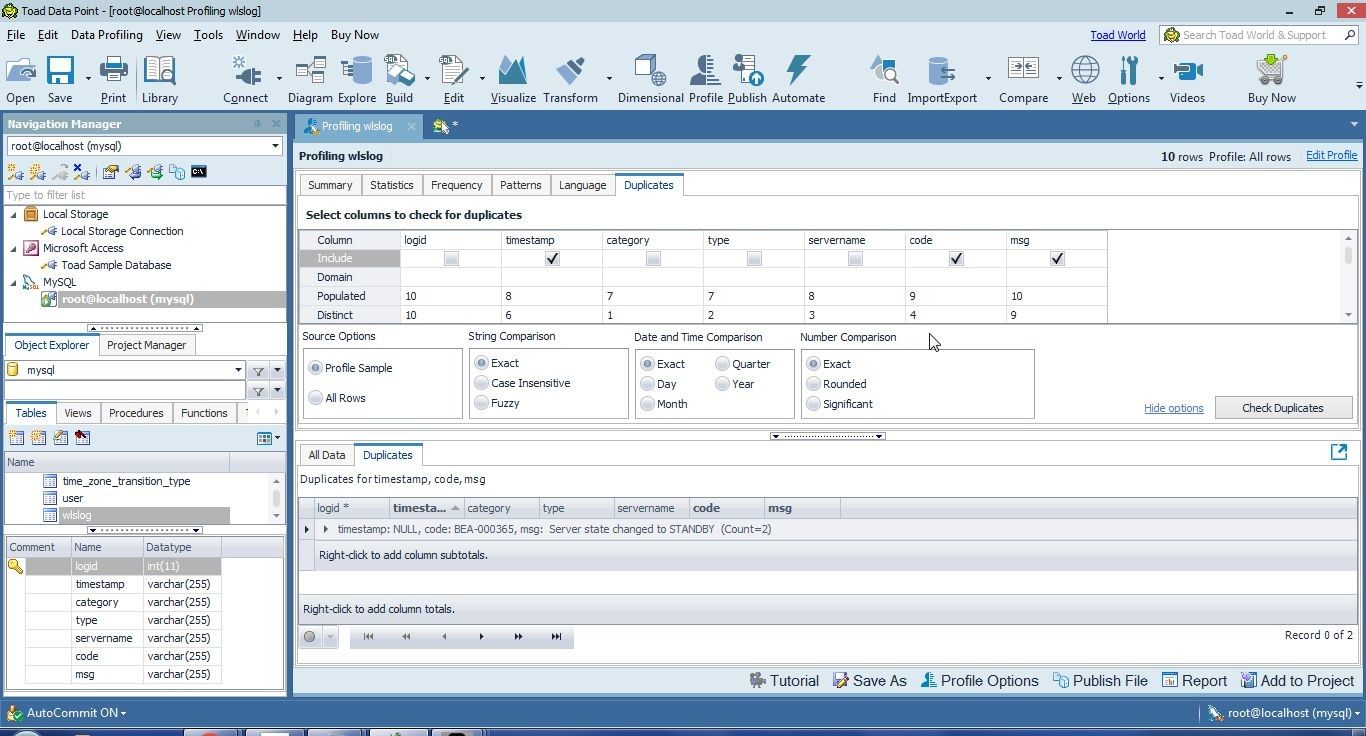
Figure 45. Comparison Options
As an example, select Case Insensitive in String Comparison as shown in Figure 46.
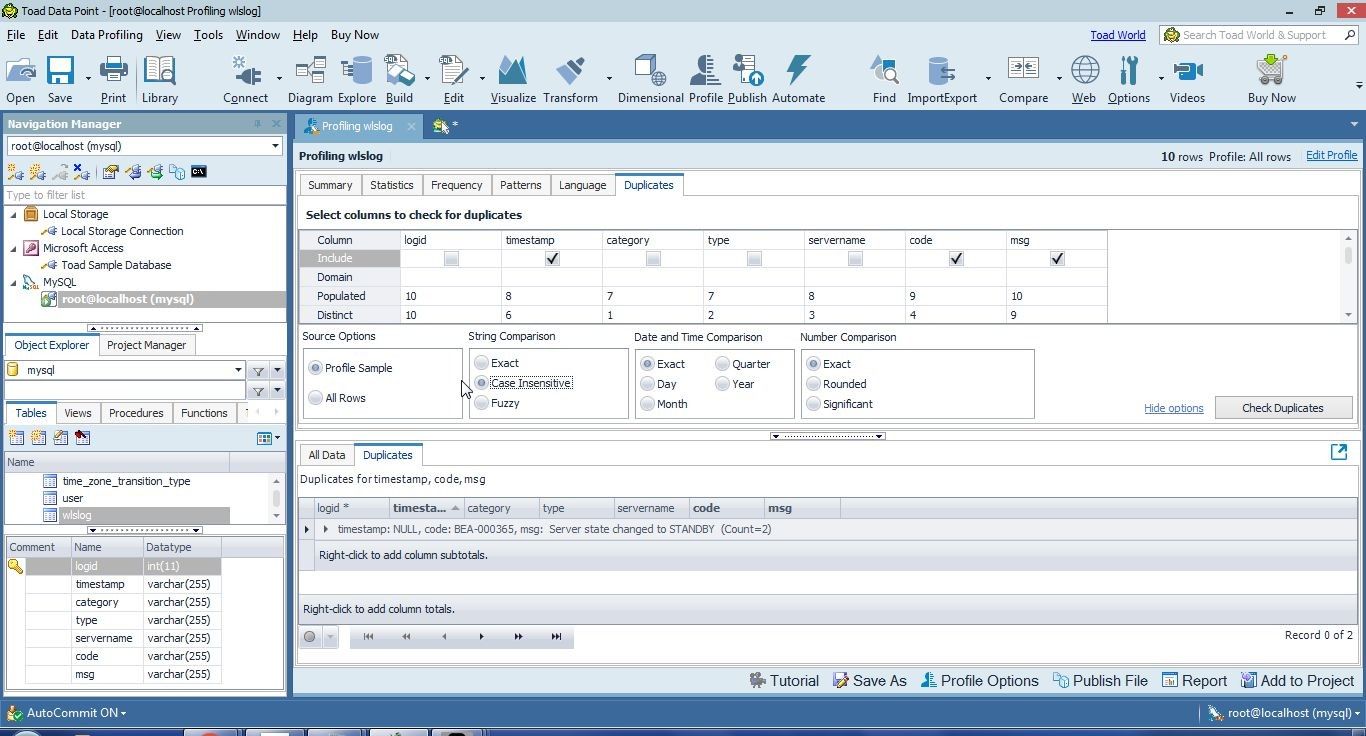
Figure 46. Selecting String Comparison as Case Insensitive
Click on Check Duplicates again as shown in Figure 47.
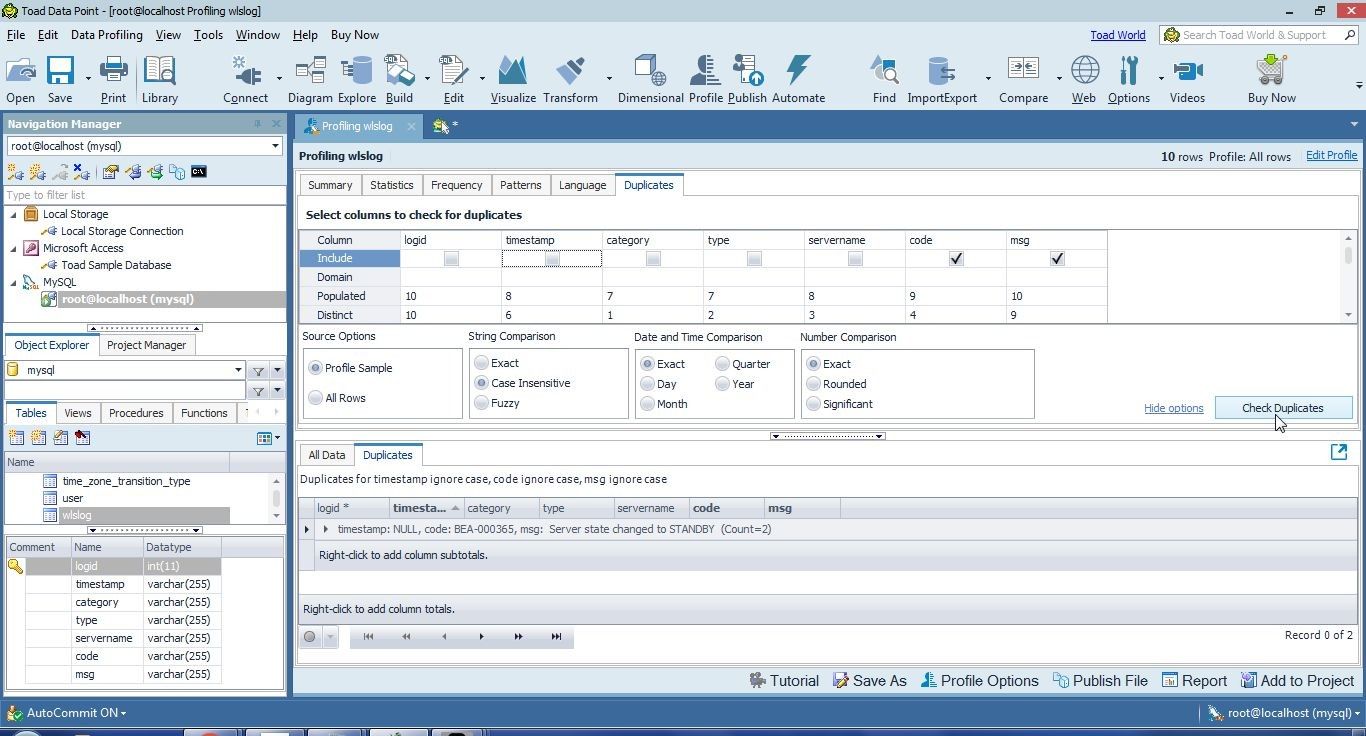
Figure 47. Check Duplicates
Two different msg column values are found to have duplicates, as shown in Figure 48.
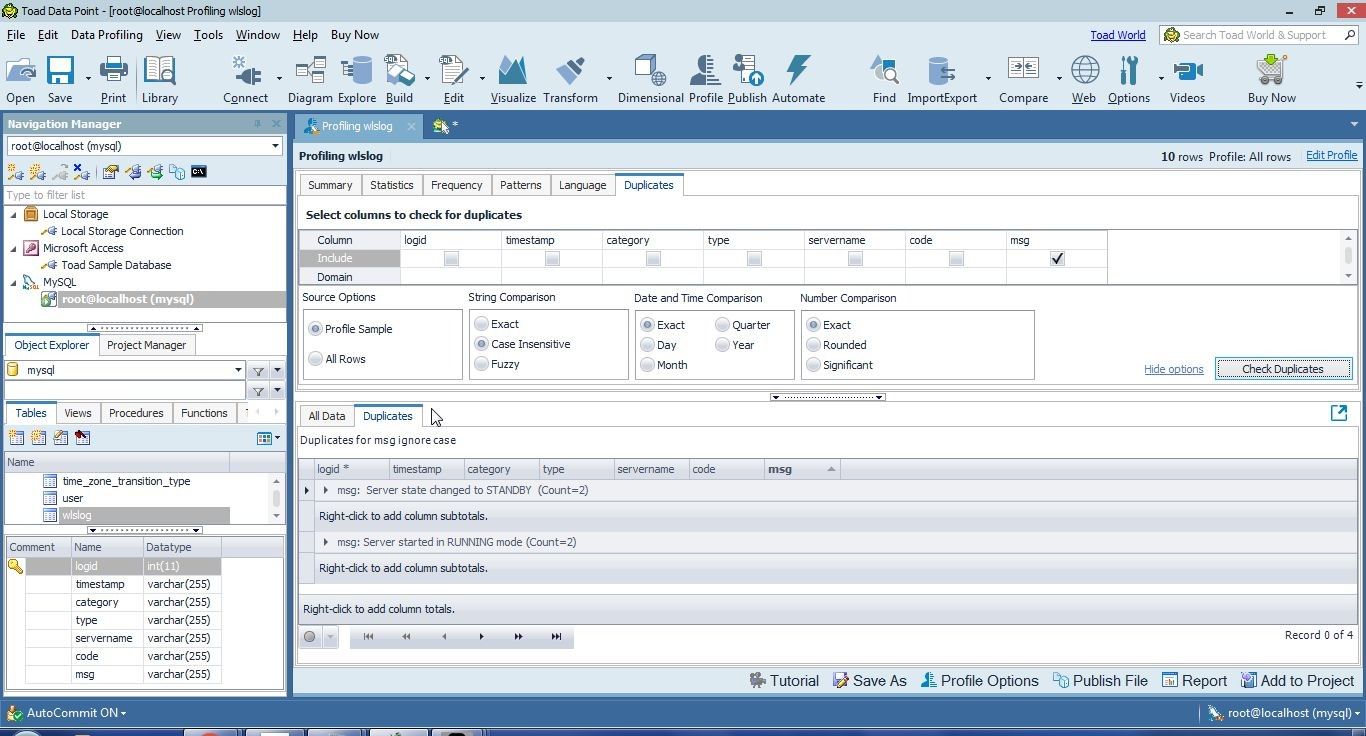
Figure 48. Two msg Column values with Duplicates
Summary
In this first of three articles we introduced data preparation, why it is needed and how it can be performed using Toad Data Point. We prepared a data source from which raw data is to be extracted for data preparation. We added some inaccuracies or shortcomings in the data, such as duplicated values and missing data. We discussed profiling the raw data to find what needs to be fixed in terms of duplicate data, missing data, and inaccurate data. In subsequent articles we shall discuss transforming the data to remove these inaccuracies and fix the data. We shall generate an Excel report after fixing all of the issues with the data.
Start the discussion at forums.toadworld.com