Want to learn about Toad Data Point automation? Join us November 12.

Toad Data Point provides a user-friendly, “no code” approach to creating automations that you can run on your desktop as well as publish to a server through Toad Intelligence Central. We contacted Toad Data Point users and asked them to tell us their top “asks” about automation. In this session, we’re revealing the answers.
What would you like to know? Provide your questions now and join the webcast on October 8 to see if your topic made the top five!

On-demand webcast:
Answering Your Top Five Questions About Toad Data Point Automation

Every 2nd Thursday of the month
Be on the lookout for a new program on the second Thursday of every month (except December). Each 30-minute session includes step-by-step guidance on an everyday challenge to simplify and streamline your work, followed by a helpful Q&A. So get ready to learn something new about data preparation with Toad Data Point.
Tell your colleagues about the webinar
If you think your colleagues would benefit from this blog, share it now on social media with the buttons located at the top of this blog post. Thanks!
Try Toad Data Point for freeLearn how Toad Data Point can help you access and prepare data faster. Seamlessly access more than 50 data sources—both on premises and in the cloud—and switch between these data source with near zero transition times. Get started with our free 30-day trial. Already in a trial? If Toad Data Point is helping you connect, query and prepare data for faster business insights, buy it now or contact a sales representative. |
Watch past data preparation made easy sessions on demand at your convenience and access Q&As
Skip to the Q&As
Session 1 (May): How to navigate Toad® Data Point
Session 2 (June): Dive Right in with Toad Data Point 101 – The Essentials
Session 3 (July): Toad Data Point Workbook 101: The Ins and Outs. Watch on demand now.Q&As coming soon!
Session 4 (August): Have Questions About Toad® Data Point Pivot Grids? Watch on demand now.Q&As coming soon!
Session 5 (September): Have Questions About Toad® Data Point Pivot Grids? Watch on demand now. There were no questions asked.
Session 6 (October): Answering Your Top Five Questions About Excel. Watch on demand now. All questions were answered in the session.
Session 1 (May): How to navigate Toad® Data Point
Julie Hyman makes it abundantly clear that she knows how to get around in Toad® Data Point, kicking off our new Toad Data Point webcast series Data Preparation Made Easy.
Our first session features Julie Hyman, Product Manager. Julie presents How to Navigate Toad Data Point – Tips and Tricks and demonstrates how to get the most value from Toad Data Point.
Julie Hyman makes it abundantly clear that she knows how to get around in Toad Data Point. And she wants the same for all of us, so Julie shows the many ways to navigate through Toad Data Point with helpful tips, settings and color coding to make data preparation easy.
Watch: How to navigate Toad Data Point on demand and view this quick, 30-minute session and sign up for future sessions.
Keep reading to get a brief recap of what Session 1 covers and access Q&As.
Left-hand Navigation Manager, Connections and color coding
Kicking off the first session in data preparation, Julie first introduces the left-hand Navigation Manager of Toad Data Point version 5.1.6. It consists of three sections where you can view the database connections, explore objects and view the fields within the specified tables. Each section has a dotted bar that allows it to expand or collapse.
Within the connections area, you can organize similar items into groups, such as connections to Excel spreadsheets or different types of databases. You can also rename individual connections to make them more intuitive.
One of the most helpful features is the ability to assign a color code to a particular connection. This code appears as a colored dot beside the connection in the Navigation Manager, and by using option settings, you can have the color extend to the Object Explorer and to tabs in the query editor. This provides a powerful visual signpost that reinforces which connection you’re currently using.
Import and export connections using an XML file
Another handy feature is the ability to import and export connections using an XML file. This is useful if you want to share connection information with another user, or simply keep a backup of connections you’ve already set up.
Query Builder
The Query Builder area also has some powerful navigation features that allow you to see the queries as you’re building them. Using the F9 function key, you can immediately run the query – opening a new tab for each set of results. So if you change a query parameter, you can toggle between tabs to see how the query results change.
Visual theme, including dark option
Julie also showed the options for changing the entire visual theme of Toad Data Point, including a dark option for those who prefer it. Julie seems to prefer the standard Toad theme!
There are many more useful tips in this presentation that pave the way to easy data preparation that would be helpful for new and experienced Toad Data Point users alike.
Q&As from session 1, May 14:
Q: Will connections.xml (the connection export) store passwords and are they encrypted?
A: Connections.xml stores encrypted passwords if user has ‘save password’ checked on the connection properties.
Q: How to create a chart from within a data report?
A: To learn how to add charts to reports, you can search inside the help (F1 for help) for “Create Charts Using Chart Designer”
Q: I tried running a procedure to one of my database connections and got an error that the command is not available in read only connection. Is it possible to run procedures or see procedure code in Toad Data Point?
A: You can call procedures within Toad Data Point, however if you only have Read Only rights to the database then the database will not allow you to call procedures OR if you have installed Toad Data Point in “Read Only” mode then you also cannot call procedures.
Q: Does the connection export also export the ODBC information?
A: You can export information about ODBC connections, but it will not include the ODBC drivers or create an ODBC connection with the correct name – you will need to add the ODBC connection to the ODBC manager manually.
Q: Is there a way to export ER diagrams to another tool such as Visio or LucentCharts?
A: No, Toad Data Point only saves diagrams in the Toad Data Point diagram format.
Q: I know when I run wizards the entire instructions are cut off and do display and there is no scroll bar to scroll down to see the entire message. Anyway to adjust that?
A: You can alter your screen settings, but I would suggest calling support so they can walk you through choosing the right settings for your environment.
Q: How can I change the Fetch to default to "Fetch All" rather than "Fetch 1000 rows"?
A: This can be changed at the top of the query window for an individual query or you can change the default settings under Tools > Options > Database > general settings.
Session 2 (June): Dive Right in with Toad Data Point 101 – The Essentials
In May’s session, Julie Hyman, Product Manager, covers how to navigate easily through Toad Data Point. During June’s session, she demonstrates how easy it is to create a query and automate it.
Selecting databases to query
Using Toad Data Point v5.1.6, Julie first shows how easy it is to select one or more databases to query. They can be any type of database in your environment; for the demo she uses MySQL and SQL Server databases. After selecting the databases, she drags a table from each into the visual query builder area of the application, and from there checks the fields to query and draw connections between the tables.
Knowing beforehand which tables contain the data needed for the query could be hardest part of this process. In large organizations with multiple databases and hundreds of tables, it could be difficult to pinpoint the exact data needed. But once you know it, the rest of the process within Toad Data Point is easy.
Once you identify the tables and fields, the visual query builder lets you specify the number of rows to return and apply filters with WHERE clauses. Then, you just run the query and get the results.
Pivot grids and visualizations help you take a deeper look into queries
Once you have your query results, you can choose to analyze them further within Toad Data Point using pivot grids and visualizations. Or, you can opt to export the results directly into an Excel spreadsheet. Subsequent query results and pivot grids can be saved to the spreadsheet – either overwriting an existing sheet or appending a new one. Queries and pivot grids can also be saved within Toad Data Point for reuse.
Julie uses the traditional view of Toad Data Point, and calls out an important difference between the traditional and Workbook views. In traditional, all the artifacts, such as pivot grids and reports, are independent of each other. So, a change to the query won't generate an update to an associated pivot grid. In Workbook, the artifacts are connected, so a change will cascade through the connected items automatically.
Automating the query
The last part of the session focuses on automating the query and other associated tasks like creating a pivot grid, exporting results and emailing them to team members. This is done from the automation builder, where you visually select the steps of the automation and configure each one with a variety of settings. Each automation step icon can be renamed for clarity, and of course the entire automation sequence can be saved and scheduled for execution. Because Toad Data Point runs in Windows, it takes advantage of the Windows Scheduler for running automations.
Be sure to join Julie again on July 9 when she’ll demonstrate many of these concepts using the Workbook feature of Toad Data Point. Workbook is an intuitive interface designed for users and business analysts who just want to get at the data without some of the technical overhead.
Q&As from session 2, June 11
Toad Data Point 101—The Essentials
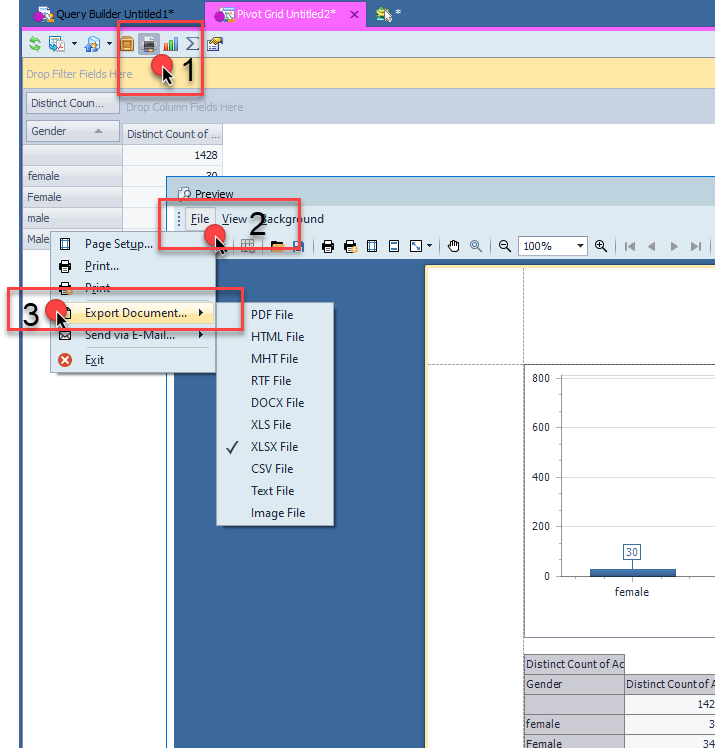
Q: When you export a pivot grid, can you also export the graph?
A: You cannot export the chart via the export options on the pivot grid screen, but you can choose to include the chart if you “print” the pivot. Choosing to “Print” the pivot will bring up a print preview screen and from there you can choose to export the print preview (with chart) to Excel or other formats.
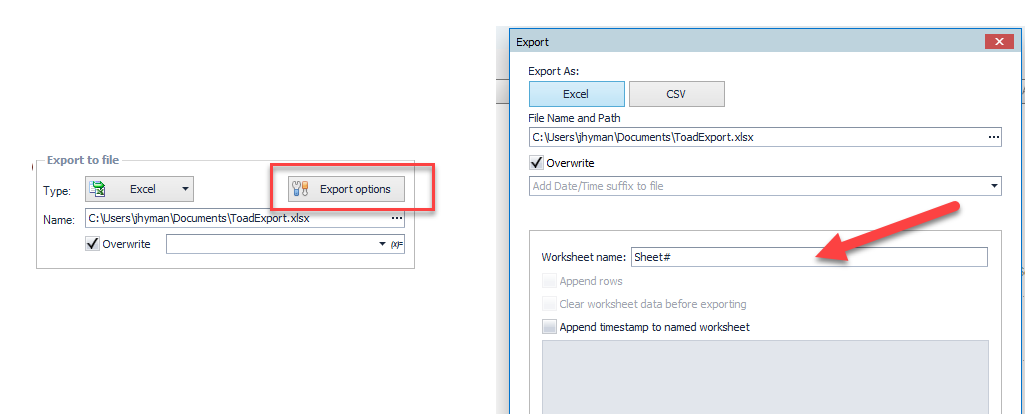
Q: When exporting to Excel, how do you append data to a worksheet? And, the reverse of that question, how do you make sure you are not appending data when exporting to Excel?
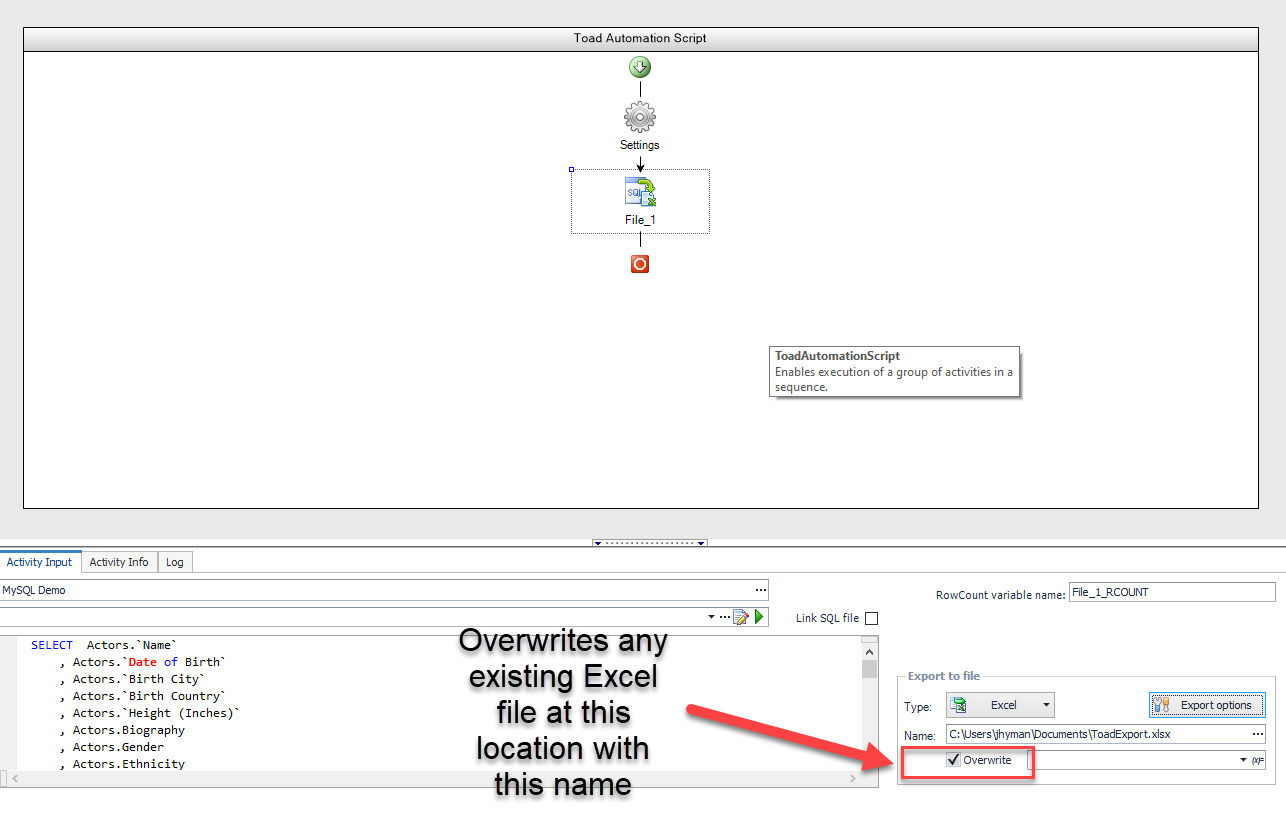
A: You have a lot of options when you are exporting to Excel through Toad Data Point Automation.
- You can overwrite any existing Excel file and build a completely new Excel file with the same name. If you want to start your export with a completely new file, you can make sure you are overwriting any existing Excel file in that location with that name.
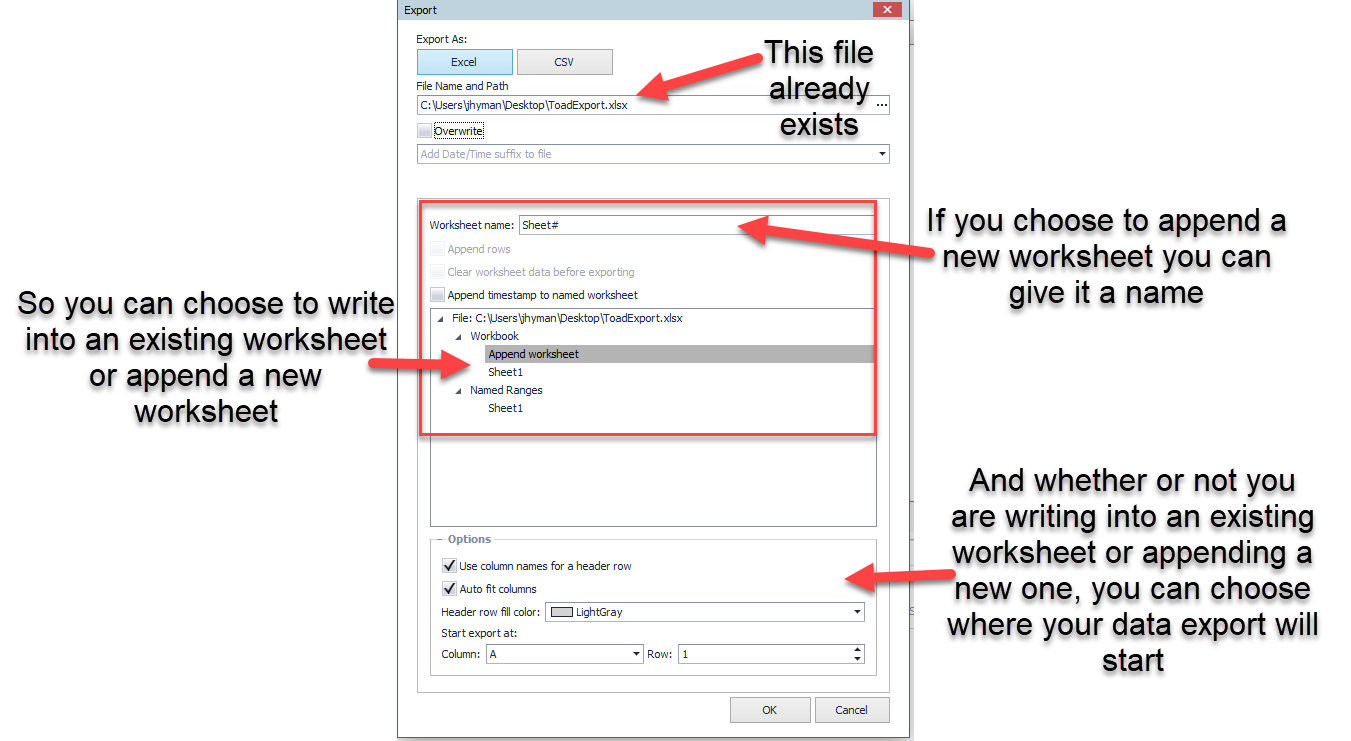
- If you choose to export data into an existing excel file, you can choose whether you want to write into an existing worksheet or append a new one
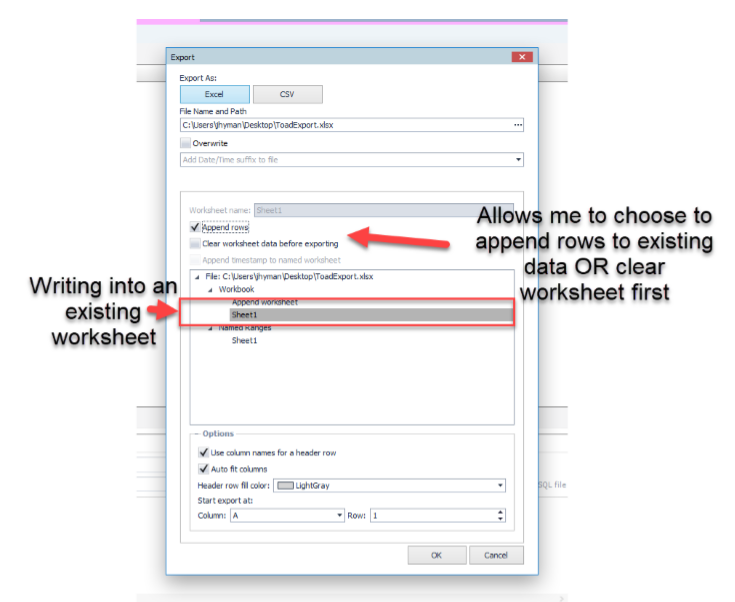
- And if you are writing into an existing worksheet you can choose whether you want to append this data to the existing data OR clear the worksheet first.
Q: Do I need to be logged into Toad Data Point on a workstation for a scheduled automation to run?
A: Your PC needs to be on, and you need to be logged into your network if your automation requires network access to complete, but you do not need to have Toad Data Point open for your automations to run. Your Windows Scheduler will kick off your automations as a background process at the scheduled time(s).
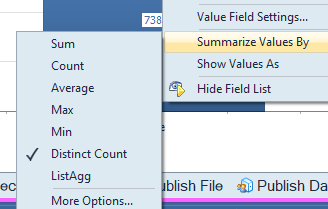
Q: Is there any benefit to pivoting in Toad Data Point rather than Excel?
A: When you create a pivot in Excel, you need to have all of the detailed data in Excel as well, which can create very large Excel workbooks. Also Toad Data Point offers some aggregation choices like Distinct Count and ListAgg (read about ListAgg here – https://docs.oracle.com/cd/E11882_01/server.112/e41084/functions089.htm#SQLRF30030 ) that are not available in Excel.
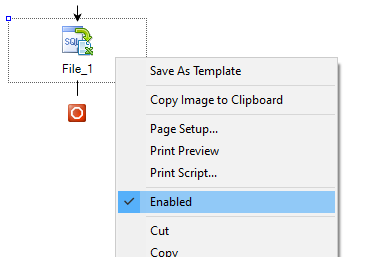
Q: How do you disable an automation step?
A: You can disable any automation step you want to skip in a run, by right-mouse clicking on the step and deselecting Enabled.
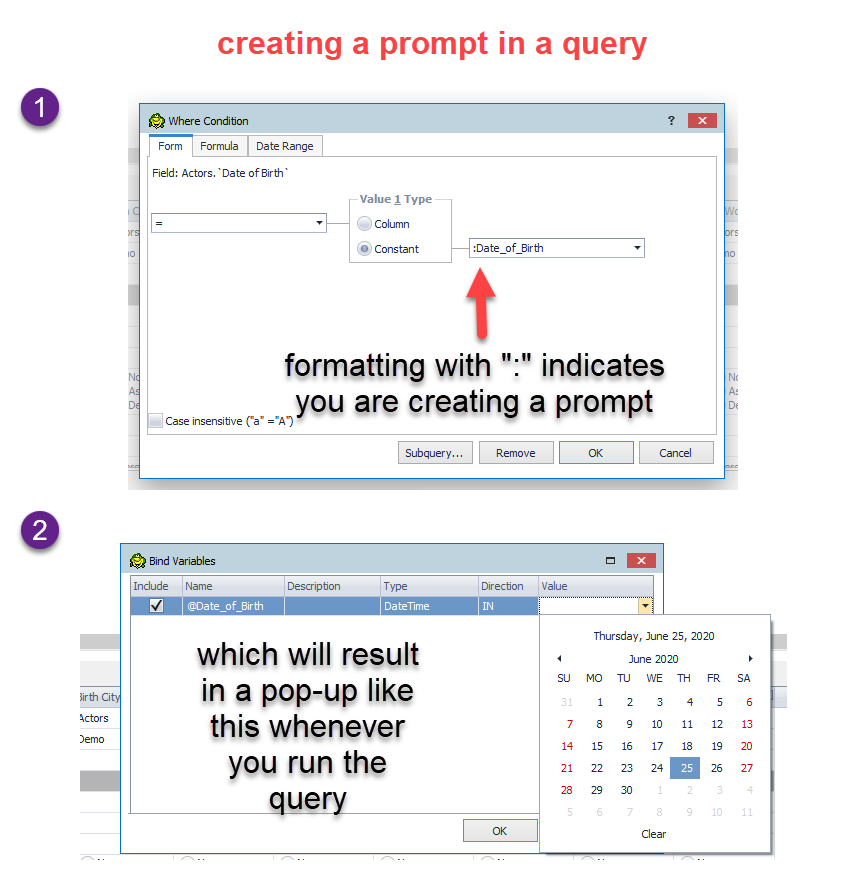
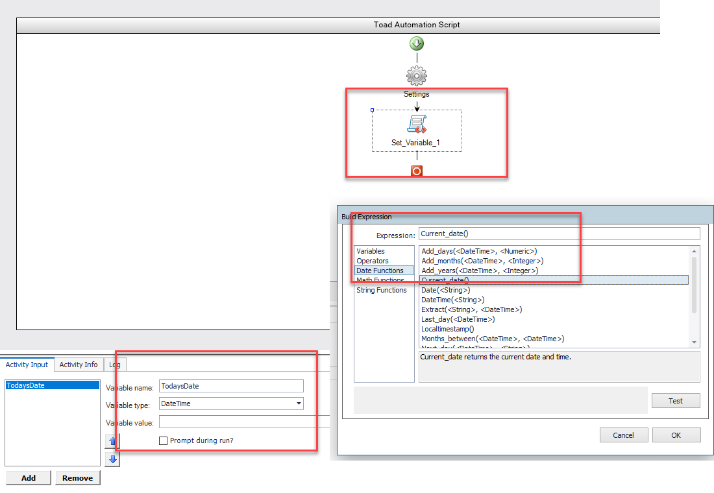
Q: How I add a variable – like “run this query for today’s date” where “today’s date” is calculated on the fly?
A: For queries in the Toad Data Point Visual Query Builder (VQB) you can select options for relative dates (today, the current month, this year, next year, last year, etc) when you add a where clause to a date field.
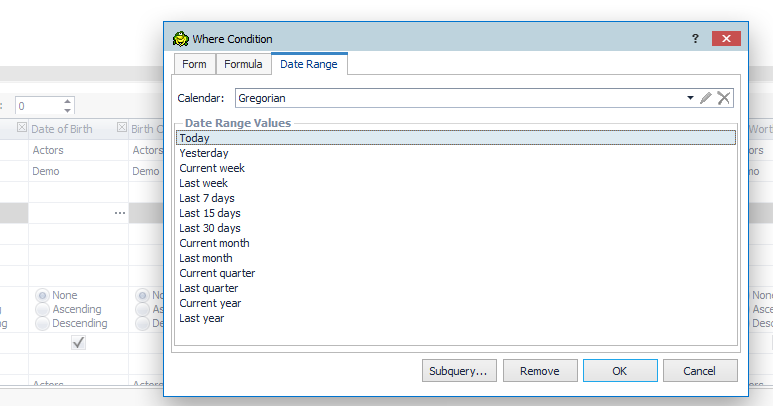
You can also add a date prompt or anything kind of variable prompt as well.
You can automate these kinds of queries by adding a “Set variable” action to define how the automation should populate the variable during an scheduled run – for more info on this see https://blog.toadworld.com/2010/01/31/automation-variables-automation-variables-using-datasets
Q: In Automation can you name an Excel sheet anything you want when you write out to Excel?
A: Yes – you have control over the name of the sheets you create in Excel
Q: How can you open multiple databases to query both databases in a single query?
A: in Toad Data Point Pro you can create “Cross Connection Queries” which opens up a visual query builder ready to accept tables from different databases. See https://blog.toadworld.com/performing-cross-connection-queries-with-toad-data-point for more info
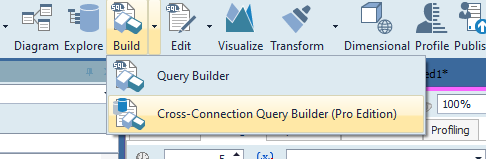
Q: Is it possible to use cross connection queries for UPDATE and INSERT or just selects?
A: Cross connection queries can only be SELECT queries.
Q: Do I have to run automations on my desktop or can I run them on a Server?
A: By adding Toad Intelligence Central into your environment you can publish automations from Toad Data Point to Toad Intelligence Central so that they run on a server.
Q: Will Toad Data Point be available for MacOS?
A: At this time we do not have plans for Toad Data Point on MacOS.
Q: When you export to an existing excel spreadsheet that has Excel’s conditional formatting, will the conditional formatting be preserved or erased?
A: Yes – in many conditions you can retain your Excel formatting. For example, if you are using and Excel template that has conditional formatting on a Pivot table – you can export data to the ‘Data’ worksheet and retain the Excel conditional formatting.
Session 3 (July): Toad Data Point Workbook 101: The Ins and Outs
As part of our monthly webcast series, Data Preparation Made Easy, product manager Julie Hyman has been explaining different aspects of Toad® Data Point. This month, the focus was on Workbook – an easy to use, intuitive interface that simplifies and streamlines the use of Toad Data Point.
In session 3, Julie demonstrates how to create a workbook from beginning to end, starting from the two desktop icons installed by Toad Data Point Professional – Traditional and Workbook.
Workbook allows you to create a combined set of analysis, queries, pivots and reports that are all connected. If you update your query, those updates will flow through the data transformations and outputs linked to the query. This is different than what you may be used to with Toad Data Point Traditional.
Step 1: How to create and name a new workbook
The first step is to create and name a new workbook. Within the workbook, you can create one or more workflows – which are a set of tasks to be executed. A workflow generally starts with a query that pulls data from a source and yields a results set.
You’re given an option as to how you want to build the query – either by using the Visual Query Builder or by writing SQL by hand. Since Workbook is about making things easier, especially for people who don’t know how to write SQL statements, it’s probably better to choose the Visual Query Builder. You can also choose to reuse a query file that was previously created in the Traditional interface.
The Visual Query Builder is the same as in Toad Data Point Traditional; it’s just accessed differently from within Workbook. So everything you know about selecting your data source, choosing fields, applying filters and generating a results set is the same.
Step 2: Transform and cleanse your data
Once you’ve generated the results set, you can begin your transformation and cleansing steps within Workbook. These all take the form of different steps in your workflow and help connect the query results through to the end of the process. Transformation and cleansing steps can also be saved and reused, which is handy if you find yourself doing the same cleanup tasks repeatedly. As you go, you can apply and view the result of the cleansing rules on the data. If you don’t like it, just undo it. Workbook lets you filter data, group results and de-duplicate, all without writing any SQL – you can even do complicated nested case statements very easily.
Step 3: Add a pivot grid or export
When the data looks clean, you can add a pivot grid to the workflow, or go on to export the data to an Excel spreadsheet. If you decide to go back to the original query and filter in more data or filter out data, the workflow will refresh all the way down to the pivots and Excel exports.
You also can save output to local storage
Another interesting feature in Workbook is the ability to save output to local storage; this is a built-in database within Toad Data Point. There’s a huge advantage to this because it lets you pull data from one type of database, for example SQL Server, into a query based on a different database, such as MySQL. In a new workflow, open the MySQL database and pull in your tables and columns. Then, join in the SQL Server data from local storage. Of course, the records need to be connected by a common field, such as a unique ID.
Step 4: Share reports
Finally, once you’ve created a stable set of reports from your data, you’ll probably want to share them on a regular basis. You can use the Share Reports feature to email your exported Excel spreadsheets as attachments. Or, you can create scheduled tasks for this. Toad Data Point will use the Windows scheduler on your desktop to execute your tasks according to the schedule you specify.
Q&As from July coming soon!
Session 4 (August): Have Questions About Toad® Data Point Pivot Grids?
Once again, the Data Preparation Made Easy webcast series has showcased how easy it is to create SQL queries in Toad Data Point using the Visual Query Builder. In this session, Julie Hyman, product manager, enthusiastically pointed out the Builder’s capabilities when it comes to options, tables, joins, WHERE clauses and sub-queries.
Julie reminded us, that in keeping with its name, the intent of the Visual Query Builder is to visually build non-proprietary, compliant SQL statements. When you drag items on to the palette and make relationships, Toad Data Point is building a SQL query behind the scenes that is based on what you’re doing. That SQL could be exported and used elsewhere since it is standard SQL.
First, Julie pointed out some of the options available when you use the Visual Query Builder. These are accessible from the Tools/Options menu. Among the items Julie pointed out were:
- Fully qualified object and column names (default on) – although you can choose not to use fully qualified names, if you have tables with identical column names, you must use the fully qualified name.
- Automatically join tables with key relationships (default on) – if the tables you drag onto the palette already have back-end relationships, those will be maintained.
- Sort order of the columns (default is database order) – when tables are first brought onto the palette, field names are displayed in the same order they appear in the database. You can choose to sort them alphabetically and change the default to alpha order.
- Number of objects to add (default 50) – this dictates how many tables can be added to the Visual Query Builder. It’s limited to 50, which is a lot of tables, but can be expanded beyond that.
- Color coding of altered text in the SQL editor – if you choose to alter a query from within the SQL editor, Toad Data Point will re-visualize the change in the diagram when you click on the eyeball icon. The altered text is highlighted in the editor and you can choose to change the color of the text.
Julie reminded us that there is a rich right mouse click menu within the Visual Query Builder. By right-clicking you can choose to add notes, refresh the diagram, auto-size the tables and arrange the tables. If you right-click inside the table itself, there’s a different menu that lets you drill into table details.
For the remainder of the session, Julie demonstrated building a basic query with the various functions of the Visual Query Builder. She showed how it’s easy to use the WHERE clause on individual fields to filter the results set. You can also use IN to do multiple selects, and can even import a text or Excel file if you have a long select list.
If you have more specific or more complicated WHERE conditions, you can use a formula or create a sub-query. A sub-query will open up a new Visual Query Builder palette.
Be sure to watch the recording to learn more about the rich functionality and ease of use of the Visual Query Builder in Toad Data Point.
Q&As from August coming soon!
Session 5 (September):no questions asked.
Session 6 (August):no questions asked.
Start the discussion at forums.toadworld.com