Introduction
Several articles have been written about how to track the usage of indexes and there are several scripts to determine which indexes are being used after monitoring for a while. In previous versions to 12cR2 of Oracle Database there is the clause “ALTER INDEX (…) MONITORING USAGE” that can be used for this. However Oracle 12.2 introduced two new views that automatically monitor index usage:
V$INDEX_USAGE_INFO: V$INDEX_USAGE_INFO keeps track of index usage since the last flush. A flush occurs every 15 minutes. After each flush, ACTIVE_ELEM_COUNT is reset to 0 and LAST_FLUSH_TIME is updated to the current time.
DBA_INDEX_USAGE: DBA_INDEX_USAGE displays cumulative statistics for each index.
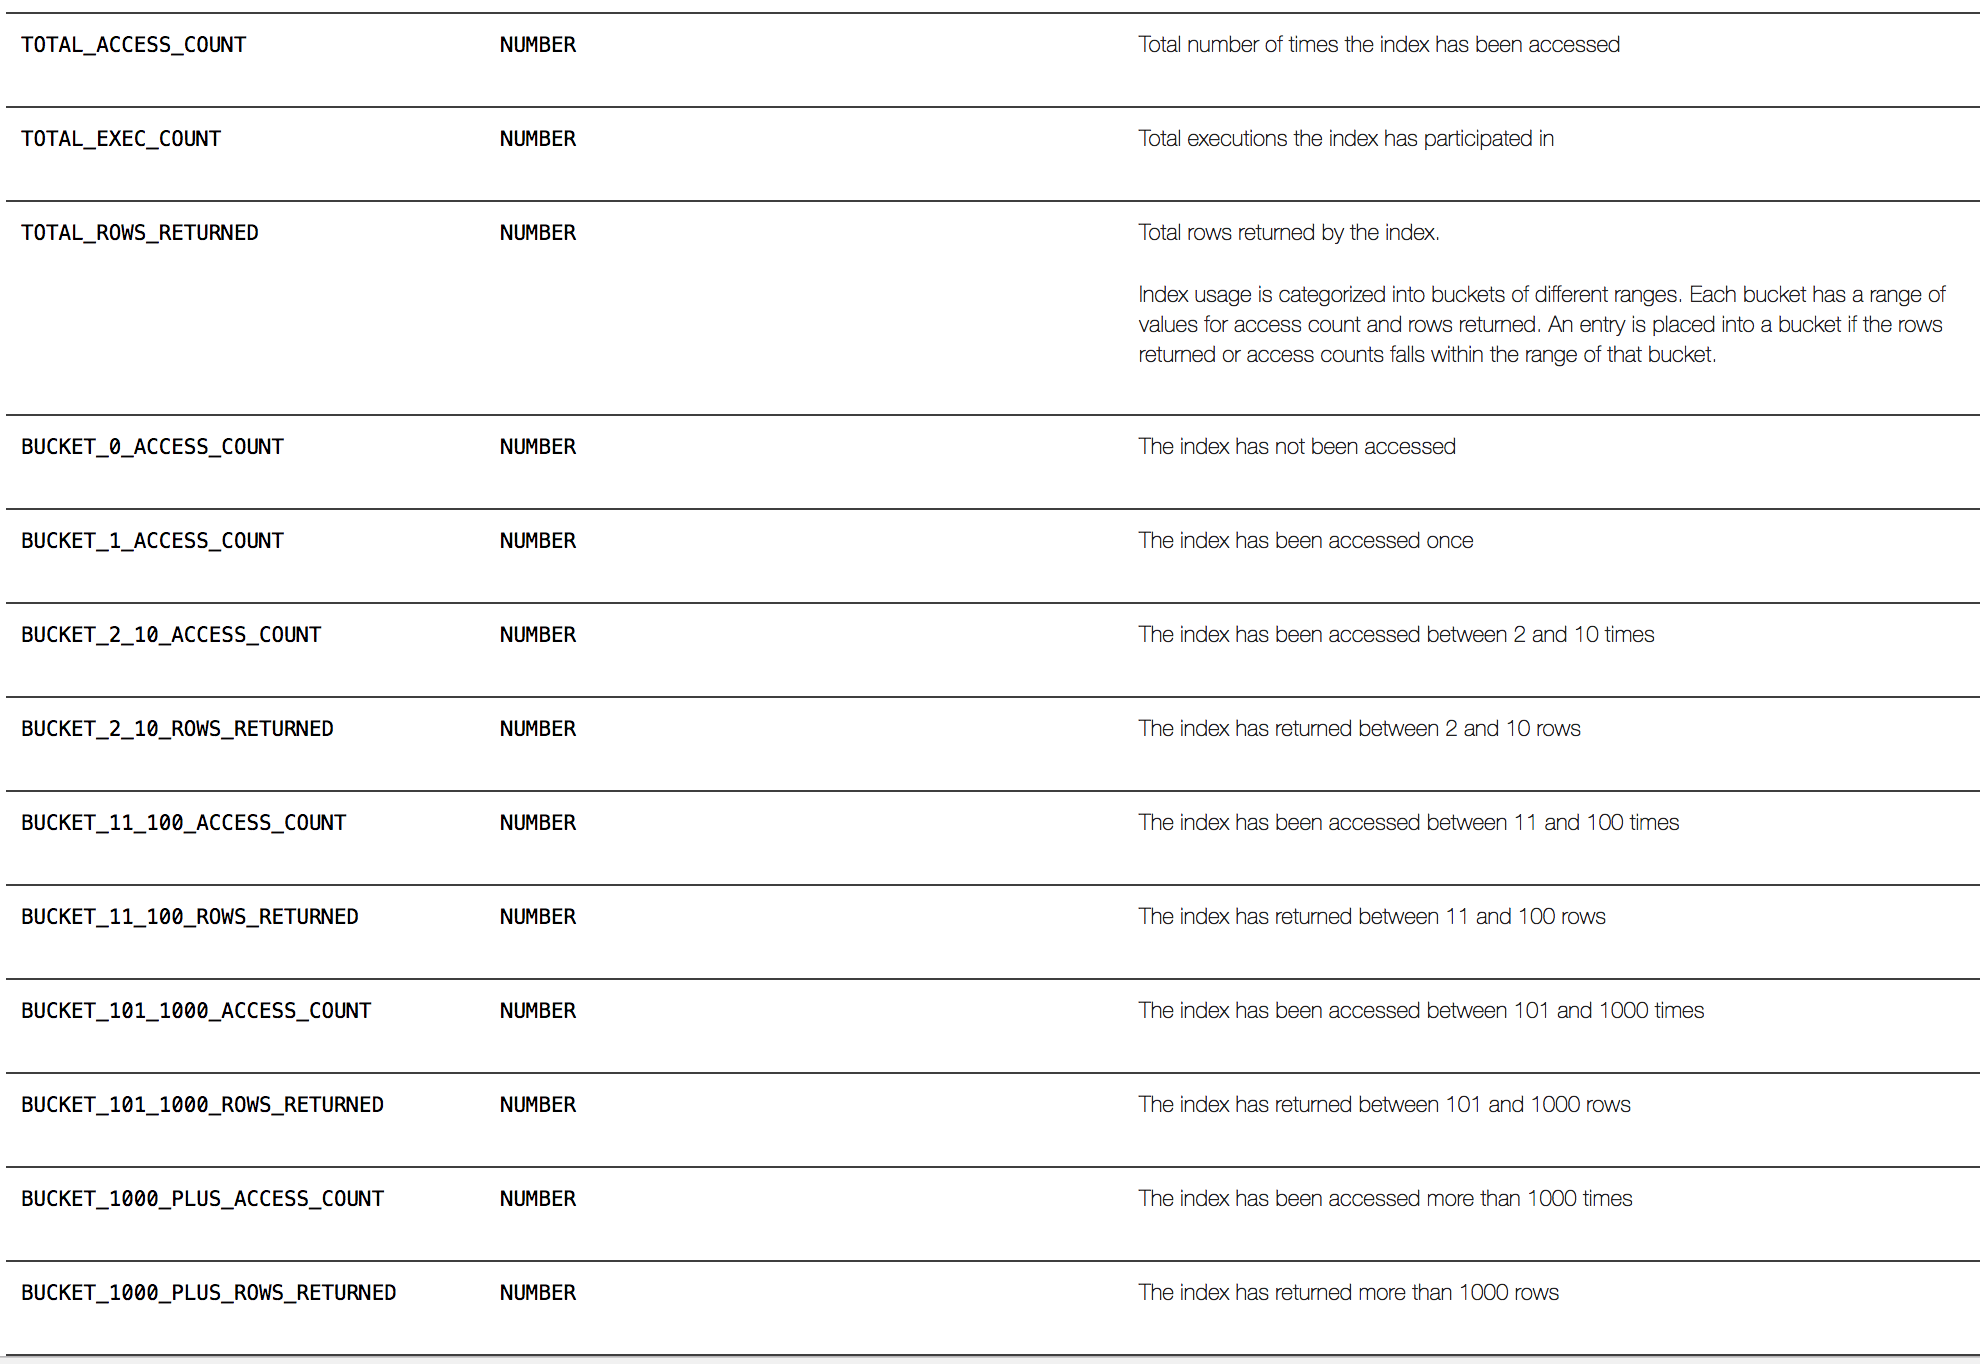
With these two new views, Oracle automatically tracks the usage of indexes. There are several columns in the dba_index_usage that can be used to find out how many accesses the indexes have received, how many rows have returned, and, even better, there are buckets to create histograms for accesses and rows returned. The most recent time that the index was used is also recorded.
In the following example, I will create a table with three columns, with one index in every column. Then I will run some queries against the table in order to use the indexes, and we will confirm that indeed Oracle 12.2 tracks the usage.
Creating the table
SQL> create table dgomez.table1 (id number, val1 varchar2(20), val2 varchar2(20));
Table created.
Creating an Index in each column
SQL> create index dgomez.idx_id on dgomez.table1(id);
Index created.

SQL> create index dgomez.idx_val1 on dgomez.table1(val1);
Index created.

SQL> create index dgomez.idx_val2 on dgomez.table1(val2);
Index created.
Perform some INSERTs in the table
While the INSERTs sentences also impact the index (index entries must be created in the b-tree), this doesn’t count as “access”.
SQL> insert into dgomez.table1 values (1,'a','b');
SQL> insert into dgomez.table1 values (2,'b','c');
SQL> insert into dgomez.table1 values (3,'c','d');
SQL> insert into dgomez.table1 values (4,'d','e');
SQL> insert into dgomez.table1 values (5,'e','f');
SQL> insert into dgomez.table1 values (6,'f','g');
SQL> insert into dgomez.table1 values (7,'g','h');
SQL> insert into dgomez.table1 values (8,'h','i');
SQL> insert into dgomez.table1 values (9,'i','j');
SQL> insert into dgomez.table1 values (10,'j','k');
SQL> insert into dgomez.table1 values (11,'k','l');
SQL> commit;
Executing some queries
I will execute some queries. I have enabled autotrace to confirm that the query is using the index. This counts as an “access”. Also pay attention to how many rows each query has returned, since this count is also monitored by Oracle. At the end, we will list how many accesses and how many rows each index has returned and we will confirm whether the data displayed is correct.
Using the index IDX_ID:
SQL> select id from dgomez.table1 where id>1;

10 rows selected.

---------------------------------------------------------------------------
| Id | Operation        | Name   | Rows  | Bytes | Cost (%CPU)| Time     |
---------------------------------------------------------------------------
| 0  | SELECT STATEMENT |        | 10    | 130   | 1 (0)      | 00:00:01 |
|* 1 | INDEX RANGE SCAN | IDX_ID | 10    | 130   | 1 (0)      | 00:00:01 |
---------------------------------------------------------------------------

SQL> select id from dgomez.table1 where id>0;

11 rows selected.

---------------------------------------------------------------------------
| Id | Operation        | Name   | Rows | Bytes | Cost (%CPU)| Time     |
---------------------------------------------------------------------------
| 0  | SELECT STATEMENT |        | 11   | 143   | 1 (0)      | 00:00:01 |
|* 1 | INDEX RANGE SCAN | IDX_ID | 11   | 143   | 1 (0)      | 00:00:01 |
---------------------------------------------------------------------------
Using the index IDX_VAL1:
SQL> select val1 from dgomez.table1 where val1 !='a';

10 rows selected.

-----------------------------------------------------------------------------
| Id | Operation        | Name     | Rows | Bytes | Cost (%CPU)| Time     |
-----------------------------------------------------------------------------
| 0  | SELECT STATEMENT |          | 10   | 120   | 1 (0)      | 00:00:01 |
|* 1 | INDEX FULL SCAN  | IDX_VAL1 | 10   | 120   | 1 (0)      | 00:00:01 |
-----------------------------------------------------------------------------

SQL> select val1 from dgomez.table1 where val1 !='z';

11 rows selected.

-----------------------------------------------------------------------------
| Id | Operation        | Name     | Rows | Bytes | Cost (%CPU)| Time     |
-----------------------------------------------------------------------------
| 0  | SELECT STATEMENT |          | 11   | 132   | 1 (0)      | 00:00:01 |
|* 1 | INDEX FULL SCAN  | IDX_VAL1 | 11   | 132   | 1 (0)      | 00:00:01 |
-----------------------------------------------------------------------------
Using the index IDX_VAL2:
SQL> select val2 from dgomez.table1 where val2 !='b';

10 rowsselected.

-----------------------------------------------------------------------------
| Id | Operation        | Name     | Rows | Bytes | Cost (%CPU)| Time     |
-----------------------------------------------------------------------------
| 0  | SELECT STATEMENT |          | 10   | 120   | 1 (0)      | 00:00:01 |
|* 1 | INDEX FULL SCAN  | IDX_VAL2 | 10   | 120   | 1 (0)      | 00:00:01 |
-----------------------------------------------------------------------------

SQL> select val2 from dgomez.table1 where val2 !='z';

11 rows selected.

-----------------------------------------------------------------------------
| Id | Operation        | Name     | Rows | Bytes | Cost (%CPU)| Time     |
-----------------------------------------------------------------------------
| 0  | SELECT STATEMENT |          | 11   | 132   | 1 (0)      | 00:00:01 |
|* 1 | INDEX FULL SCAN  | IDX_VAL2 | 11   | 132   | 1 (0)      | 00:00:01 |
-----------------------------------------------------------------------------
Confirming the information captured
Now let’s take a look into the information captured by Oracle. In the previous part of this demo I executed each query two times in order to use every index twice. The first query always returned 10 rows for every index, and the second query returned 11 rows for every index; this means in total the index has returned 21 rows. Now let’s confirm these values:
SQL>select name, total_access_count, total_exec_count, total_rows_returned, last_used from DBA_INDEX_USAGE where owner='DGOMEZ';

NAME      TOTAL_ACCESS_COUNT TOTAL_EXEC_COUNT TOTAL_ROWS_RETURNED LAST_USED
--------- ------------------ ---------------- ------------------- ---------------------
IDX_ID                     2                2                  21   07-16-2017 18:58:43
IDX_VAL1                   2                2                  21   07-16-2017 18:58:43
IDX_VAL2                   2                2                 21   07-16-2017 18:58:43
Fortunately the information about every query I executed was captured, but it seems not all the SELECTs are captured, as Frank Pachot explains in this article. I also saw that if the Quries are executed by SYS the index usage is not captured.
The following output shows how many accesses the index has received:
SQL> select name, bucket_1_access_count, bucket_2_10_access_count, bucket_11_100_access_count,
 bucket_101_1000_access_count from DBA_INDEX_USAGE where owner='DGOMEZ';

NAME      BUC_1_ACC_CT BUC_2_10_ACC_CT BUC_11_100_ACC_CT BUC_101_1000_ACC_CT
--------- ------------ --------------- ----------------- -------------------
IDX_ID               0               1                 1                  0
IDX_VAL1             0               1                 1                  0
IDX_VAL2             0               1                 1                  0
The definition of the column “BUCKET_11_100_ACCESS_COUNT” is “The index has been accessed between 11 and 100 times. At first look it seems that this definition is not correct, because I just executed the same query two times for each index. I didn’t execute a query that accessed the index between 11 and 100 times.
So apparently this column actually captures its accesses, not operations. Since the first SELECT operations accessed the index 10 times because it returned 10 rows, the bucket_2_10_access_count was increased by one. It is the same for the second query, which accessed the index 11 times because it returned 11 rows; the bucket_11_100_access_countwas increased by one.
But… Wait! TOTAL_ACCESS_COUNT says every index was accessed only two times in total. So, there are some inconsistent definitions here:
- Either there were two accesses of every index because I executed two SELECT operations that touched the index, in which caseTOTAL_ACCESS_COUNT is correct but BUCKET_11_100_ACCESS_COUNT is not correct, because I didn’t execute any query more than 10 times and fewer than 101 times.
- Or, the BUCKET_11_100_ACCESS_COUNT is correct and it doesn’t count the operations (SELECTs in this case) and instead counts every access to the b-tree nodes into the index; in which case the definition of TOTAL_ACCESS_COUNT is wrong.
In the following output we can confirm that every bucket received the correct information. For example, for the bucket bucket_2_10_rows_returned there is 1 execution; this is because the first query always returned 10 rows in every index. The bucket bucket_11_100_rows_returned always has the right value (1 execution) since the second query we executed against every index always returned 11 rows.
SQL> select name, bucket_2_10_rows_returned, bucket_11_100_rows_returned,
 bucket_101_1000_rows_returned from DBA_INDEX_USAGE where owner='DGOMEZ';

NAME      BUC_2_10_RW_RETD BUC_11_100_RW_RETD BUC_101_1000_RW_RETD
--------- ---------------- ------------------ ---------------------
IDX_ID                  10                 11                     0
IDX_VAL1                10                 11                     0
IDX_VAL2                10                 11                     0
Conclusion
Oracle has been introducing new views that provides very useful information to DBAs so that the DBAs can administrate properly the databases and diagnose problems in order to avoid any reactive problems. For several years scripts, third-parties tools, ALTER INDEX clauses, etc., were used to track the index usage, but this changed now Oracle perform this automatically without overheads in the performance.
Start the discussion at forums.toadworld.com