Yesterday, I explained how we can access MySQL database from Zeppelin which comes with Oracle Big Data Cloud Service Compute Edition (BDCSCE). Although we can use Zeppelin to access MySQL, we still need something more powerful to combine data from two different sources (for example data from CSV file and RDBMS tables). Spark is a great choice to process data. In this blog post, I’ll write a simple PySpark (Python for Spark) code which will read from MySQL and CSV, join data and write the output to MySQL again. Please keep in mind that I use Oracle BDCSCE which supports Spark 2.1. So I tested my codes on only Spark 2.1 and used Zeppelin environment. I expect you run all these steps on same environment. Otherwise, you may need to modify paths and codes.
For my sample script, I’ll use the flight information belongs to year 2008. If you read my my blog post series about BDCSCE, you should be familiar with it. Anyway, do not worry about the data structure, I use only a few columns of the data, and you get more information about it on the statistical computing website.
First, I’ll create a table on MySQL to store most active carriers (in 2008). I already set Zeppelin to access my MySQL database, so I create a new paragraph, put the following SQL commands and run them.
%jdbc(mysql)
create table carriers (code TEXT, description TEXT );
insert into carriers values( 'WN','Southwest Airlines Co.');
insert into carriers values( 'AA','American Airlines Inc.');
insert into carriers values( 'OO','Skywest Airlines Inc.');
insert into carriers values( 'MQ','American Eagle Airlines Inc.');
insert into carriers values( 'US','US Airways Inc.');
insert into carriers values( 'DL','Delta Air Lines Inc.');
insert into carriers values( 'UA','United Air Lines Inc.');
select * from carriers;
By executing the above SQL codes, we create a table named “carriers” and insert 7 rows. I use the following code to download and unzip flight data from stat-computing.org.
%sh

mkdir /tmp/flight

cd /tmp/flight
wget -q http://stat-computing.org/dataexpo/2009/2008.csv.bz2
bunzip2 2008.csv.bz2
hdfs dfs -put -f 2008.csv
cd
rm -rf /tmp/flight
hdfs dfs -ls *.csv
If you get an error (Paragraph received a SIGTERM), increase the shell.command.timeout.millisecs of sh interpreter. If everything went OK, we should have the 2008.csv file in our hadoop system and carriers table in our MySQL server. Now it’s time to read data from MySQL carriers table to carriers dataframe:
%pyspark

credentials = { "user" : "gokhan", "password" : "super_secret_password" }
carriers = sqlContext.read.jdbc(
url="jdbc:mysql://100.100.100.100:3306/mydatabase",
table="carriers",
properties=credentials)
carriers.show()
Do not forget to modify the code according to your MySQL credentials and server address. Let me explain the code: First I create a variable for storing credentials (for code readability), then I use Spark’s sqlContext object to read from JDBC source. As you can see I give URL, table name and my credentials (as properties). I assign the output to “carriers” object and then call “show” method to fetch the data and show it on screen.
Here’s the next block:
%pyspark

from pyspark.sql.functions import desc

flights_file = sc.textFile( "/user/zeppelin/2008.csv")

def flights_mapper(line):
fields = line.replace('NA','0').split(',')
return Row( fl_code=str(fields[8]),CancellationCode=str(fields[22]), CarrierDelay=str(fields[24]), WeatherDelay=str(fields[25]),
NASDelay=str(fields[26]), SecurityDelay=str(fields[27]), LateAircraftDelay=str(fields[28]))
flights = flights_file.map(flights_mapper).toDF()
flights_carriers = flights.join( carriers, flights.fl_code == carriers.code ).groupBy("code","description").count().sort(desc("count"))
flights_carriers.show()
In this block, I read flight information from CSV file (line 5), create a mapper function to parse the data (line 7-10), apply the mapper function and assign the output to a dataframe object (line 12), and join flight data with carriers data, group them to count flights by carrier code, then sort the output (line 14). Then I call show method to display the result (line 16). For my sample, I do not need to parse it all these columns but I just copied from one of old blog posts. You can surely write a simpler parsing function.
Now we can write the result dataframe to a MySQL table:
%pyspark

credentials = { "user" : "gokhan", "password" : "super_secret_password" }

flights_carriers.write.jdbc(
url="jdbc:mysql://100.100.100.100:3306/mydatabase",
table="flights_carriers",
mode="overwrite",
properties=credentials)
I use write method of dataframe to write the content of the dataframe to a table named “flights_carriers”. By the way, On the first run of this script, mode parameter is not required, because the flights_carriers table does not exist.
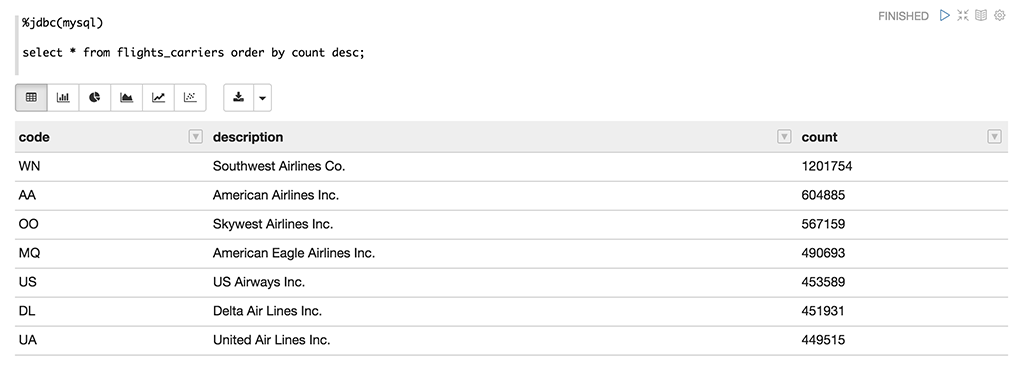
After running all these blocks, I checked my flights_carriers, and as you see the table contains the data calculated by Spark scripts. You can use the same method to combine data from different data sources such as JSON, Oracle RDBMS, Hive etc… See you next blog post!
Start the discussion at forums.toadworld.com