Release 2 of Toad Edge has introduced Postgres as a new data source. Using Toad Edge in your Postgres environment, both Open Source and Enterprise (EBD) versions, you can easily:
- View, explore and edit your database schema, objects and properties.
- Write SQL code comfortably in a SQL worksheet.
- View and manage your database users and privileges.
- Compare and synchronize databases using schema compare.
- Synchronize to your file systems to make it easy to work with your version control.
- Work more easily with JSON data types using the JSON editor.
- View running SQL and other attributes with the session browser.
In this blog I am going to touch on bullet items 1 and 2. In future blogs I will cover the other items.
Viewing a table
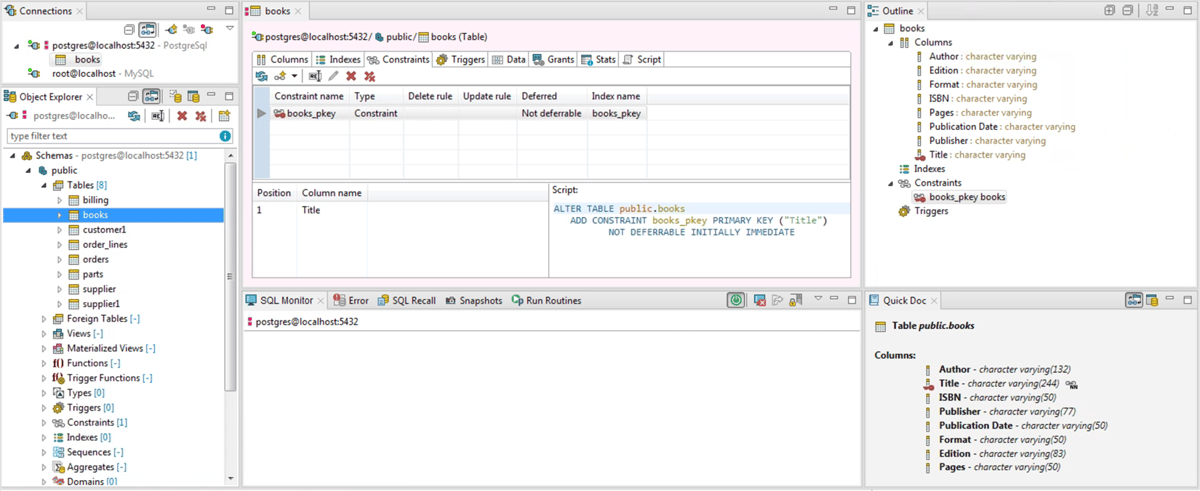
In the screen below you can see my current Postgres connection and some of the objects that are viewable in the Object Explorer window. Scrolling down in the window would show you more.
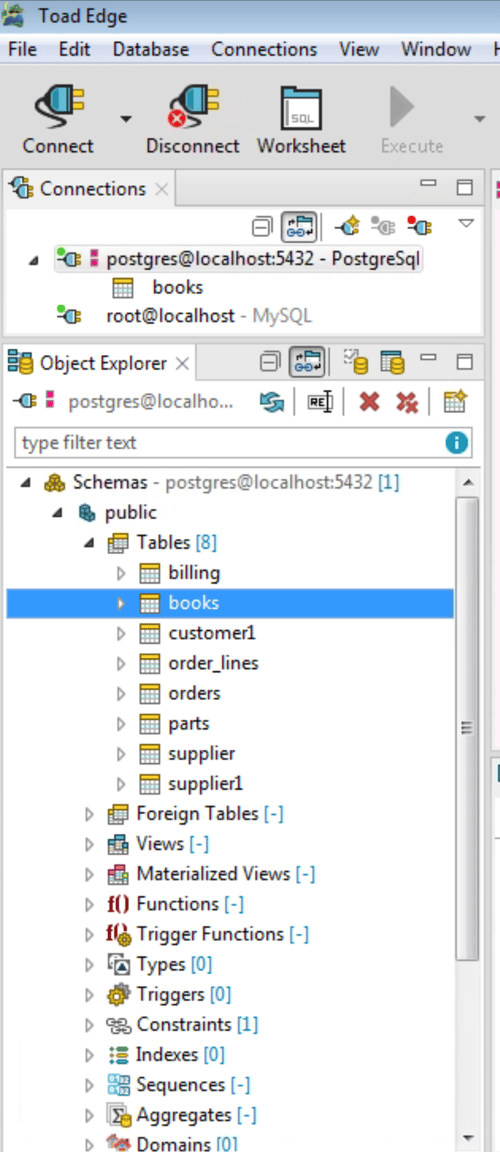
I have expanded the TABLES menu item and below you can see the BOOKS table that is opened:
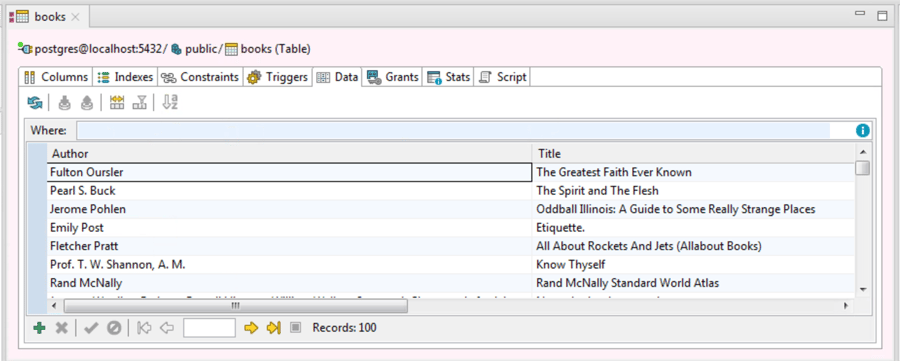
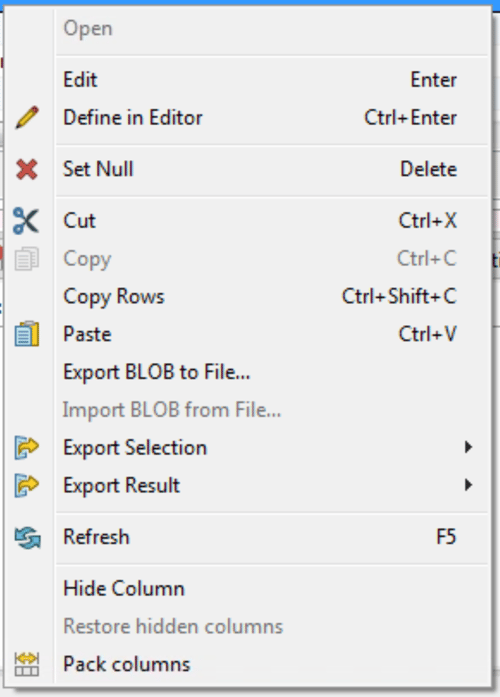
By simply clicking on the DATA tab you can view the data in the table. A right-click on the data will show the options available on the data window:
Clicking on the other tabs in the window would show you the columns, indexes, constraints, etc., associated with the table.
A couple of other nice features are the ‘Outline’ and ‘Quick Doc’ windows. They give you a quick look at the structure of the table without having to change tabs to see this information:
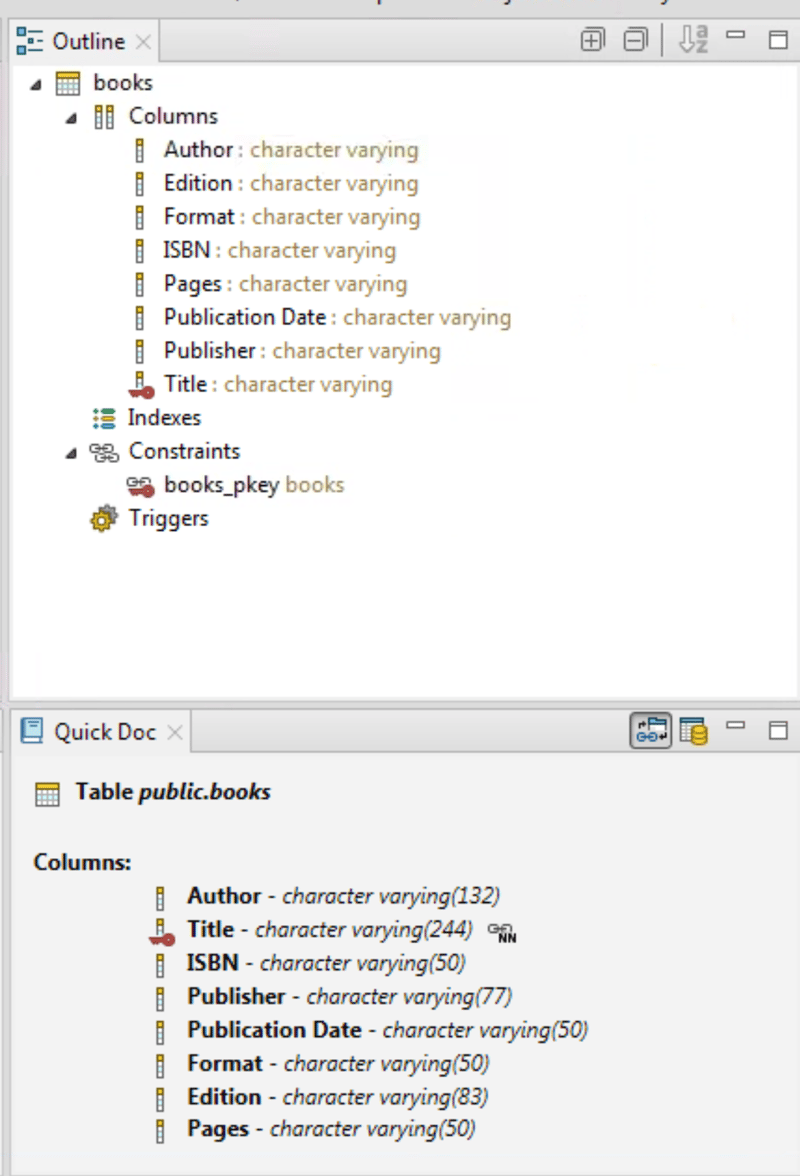
The screen shot below gives you a summary view of the individual windows shown above:
Editing SQL
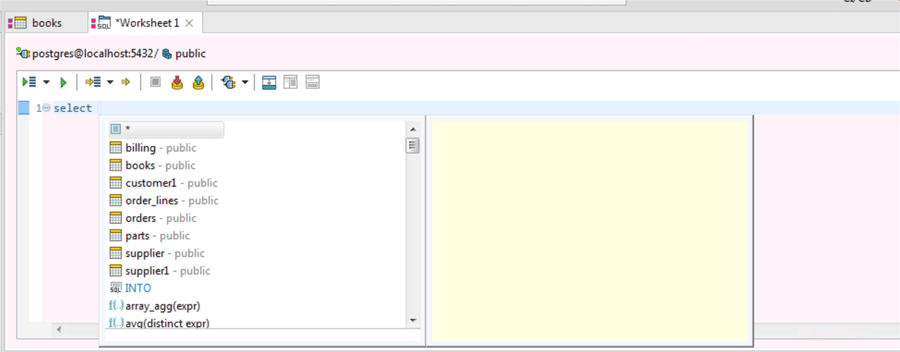
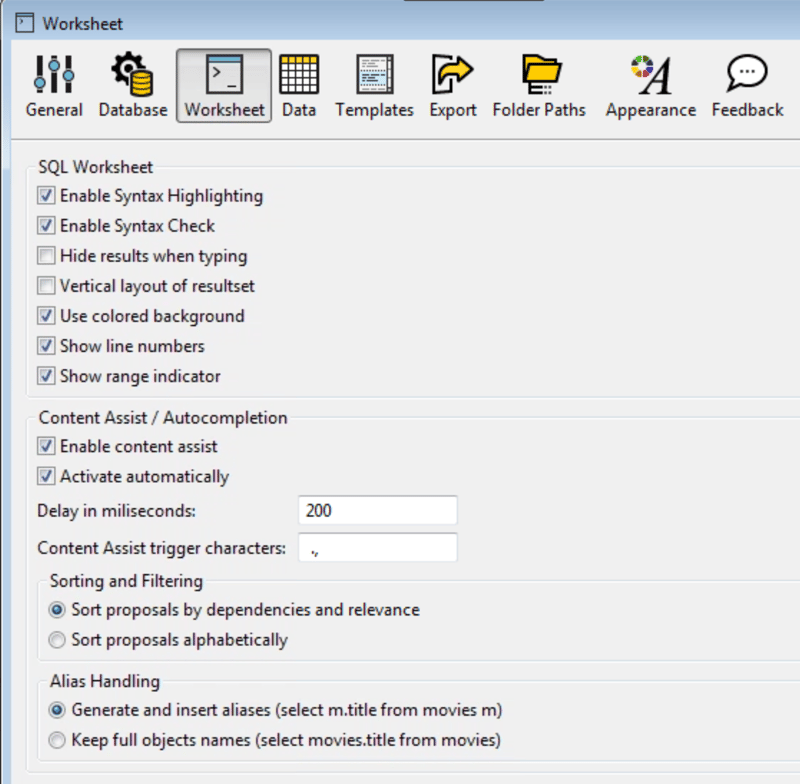
Editing is done via a ‘Worksheet’. Toad Edge has “Content assist/ Autocomplete” capabilities, so as you are typing your SQL it can populate the tables and fields that are available to you without having to stop and go back to the Object Explorer window and look at the structure of the table or trying to remember all of the fields in a table. This can speed up your development time.
This feature is managed under the VIEW menu and choosing ‘Preferences’:
Once you have created your query you simply run it by clicking on the green arrow at the top of the worksheet. Once it has run, the bottom portion of the window will show you the results and with the SQL Monitor tab you can view the elapsed time of the query.

Toad Edge will display any errors you may have in your query as well. But I am sure your code is error free.
When you run queries they are saved in SQL Recall and you can recall them and rerun them at a later date. This is handy if you have several queries you have been working on and now you need to go back and find an ‘old’ query that you ran.
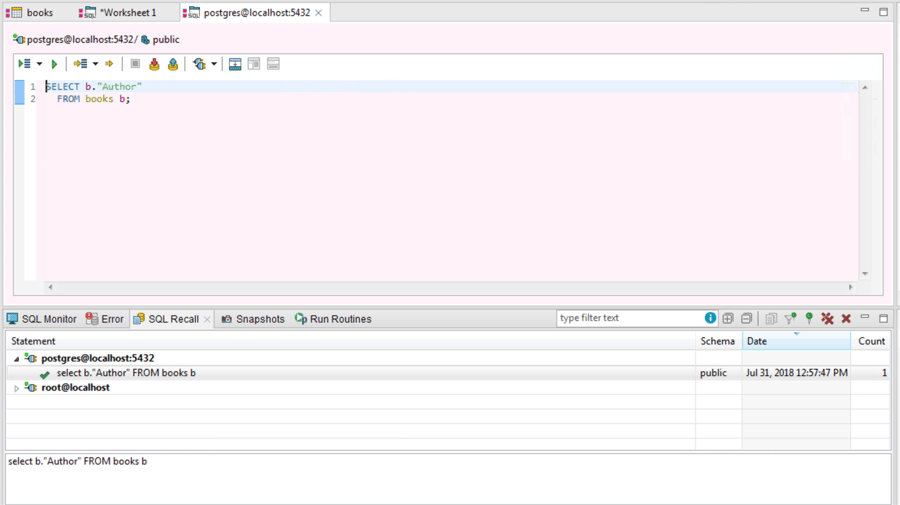
Above you can see the query that was run previously and by doing a right-click on the statement in the recall window you are able to open it in a new worksheet and continue working with it.
Explain Plans
The last thing I want to share with you in this blog are ‘Explain Plans’. You have written a query and it ran successfully. But was it efficient? By looking at the explain plan you can start to get a feel for ‘how’ it ran and if you need to make any changes to it to improve the performance.
Now, the query I am working with is quite simple, but yours will be more complex. To view the explain plan you simply click on the ‘Explain Plan’ arrow in the worksheet:
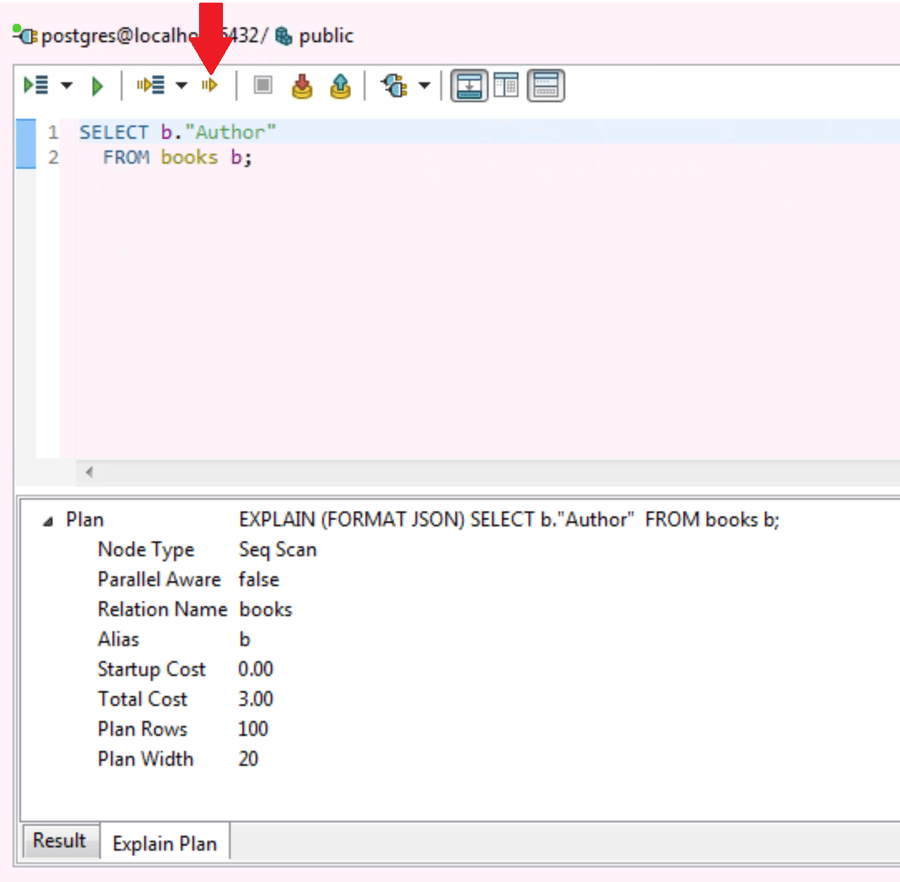
And then you can view the explain plan results in the ‘explain Plan’ tab at the bottom of the window.
Thank you for your time and allowing me to cover a couple of the features in this new release of Toad Edge for Postgres.
Stay tuned for my upcoming blogs and if you have any questions or need more information please visit the Toad Edge page on Toad World or visit us at https://www.quest.com/products/toad-edge/
Start the discussion at forums.toadworld.com