Amazon Redshift is a data warehouse service hosted by AWS. Redshift is a columnar data storage RDBMS database with support for storing petabyte-scale data. Redshift is typically used to run complex data analysis queries run across a cluster of nodes. Redshift is based on PostgreSQL 8.0.2 and gets some its features such as the public schema from PostgreSQL. In an earlier article we discussed creating a connection to Redshift with Toad Edge. In this continuation article we shall discuss some of the Toad Edge features for Redshift. Toad Edge supports several databases, including MySQL and PostgreSQL, and some of its features are different for different databases. This article has the following sections.
Creating a Database Table
Querying Table
Displaying Result
Exporting Query Result
Creating Multiple Connections
Disconnecting and Reconnecting
Dropping Table
Deleting Cluster
Creating a Database Table
In this section we shall create a database table and add table data. The following SQL script creates a table wlslog.
CREATE TABLE wlslog(logid INTEGER,category VARCHAR(255),type VARCHAR(255),servername VARCHAR(255), code VARCHAR(255),msg VARCHAR(255));
INSERT INTO wlslog VALUES(1,'Notice','WebLogicServer','AdminServer','BEA-000365','Server state changed to STANDBY');
INSERT INTO wlslog VALUES(2,'Notice','WebLogicServer','AdminServer','BEA-000365','Server state changed to STARTING');
INSERT INTO wlslog VALUES(3,'Notice','WebLogicServer','AdminServer','BEA-000365','Server state changed to ADMIN');
INSERT INTO wlslog VALUES(4,'Notice','WebLogicServer','AdminServer','BEA-000365','Server state changed to RESUMING');
INSERT INTO wlslog VALUES(5,'Notice','WebLogicServer','AdminServer','BEA-000361','Started WebLogic AdminServer');
INSERT INTO wlslog VALUES(6,'Notice','WebLogicServer','AdminServer','BEA-000365','Server state changed to RUNNING');
INSERT INTO wlslog VALUES(7,'Notice','WebLogicServer','AdminServer','BEA-000360','Server started in RUNNING mode');
Copy and paste the SQL script into a worksheet and click on Execute>Execute All statements in the toolbar as shown in Figure 1.
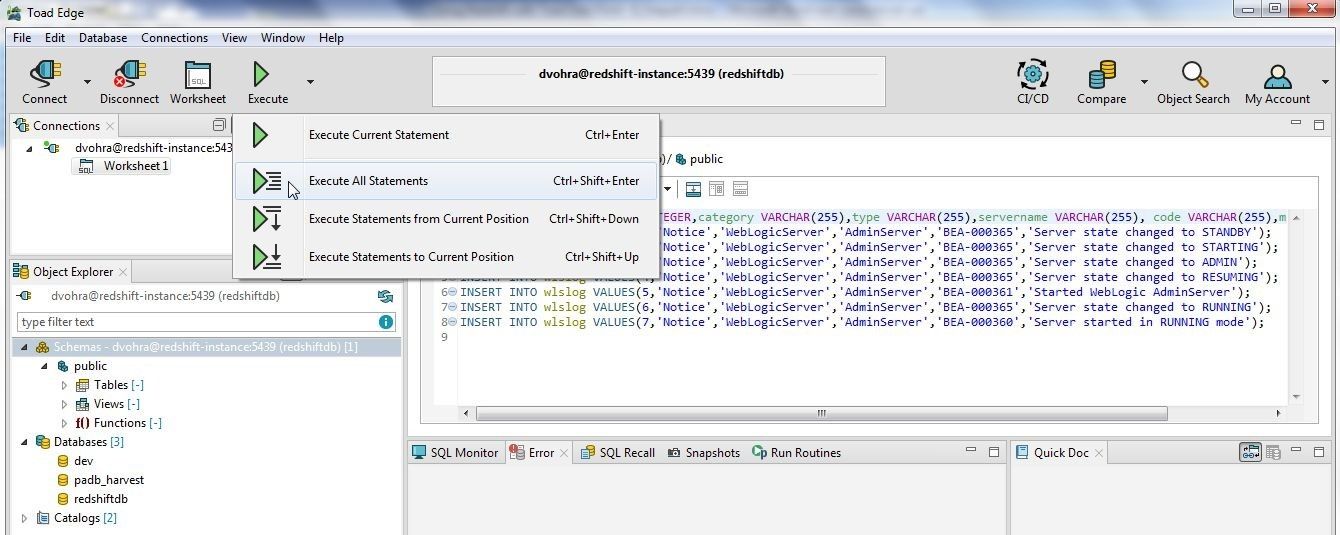
Figure 1. Execute>Execute All Statements
Alternatively, select Execute All Statements in the worksheet toolbar as shown in Figure 2.
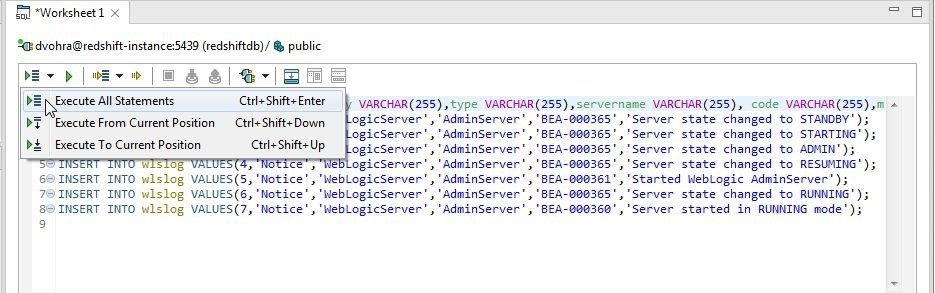
Figure 2. Execute All Statements
The SQL statements get processed and the table wlslog gets created, as shown in Figure 3.
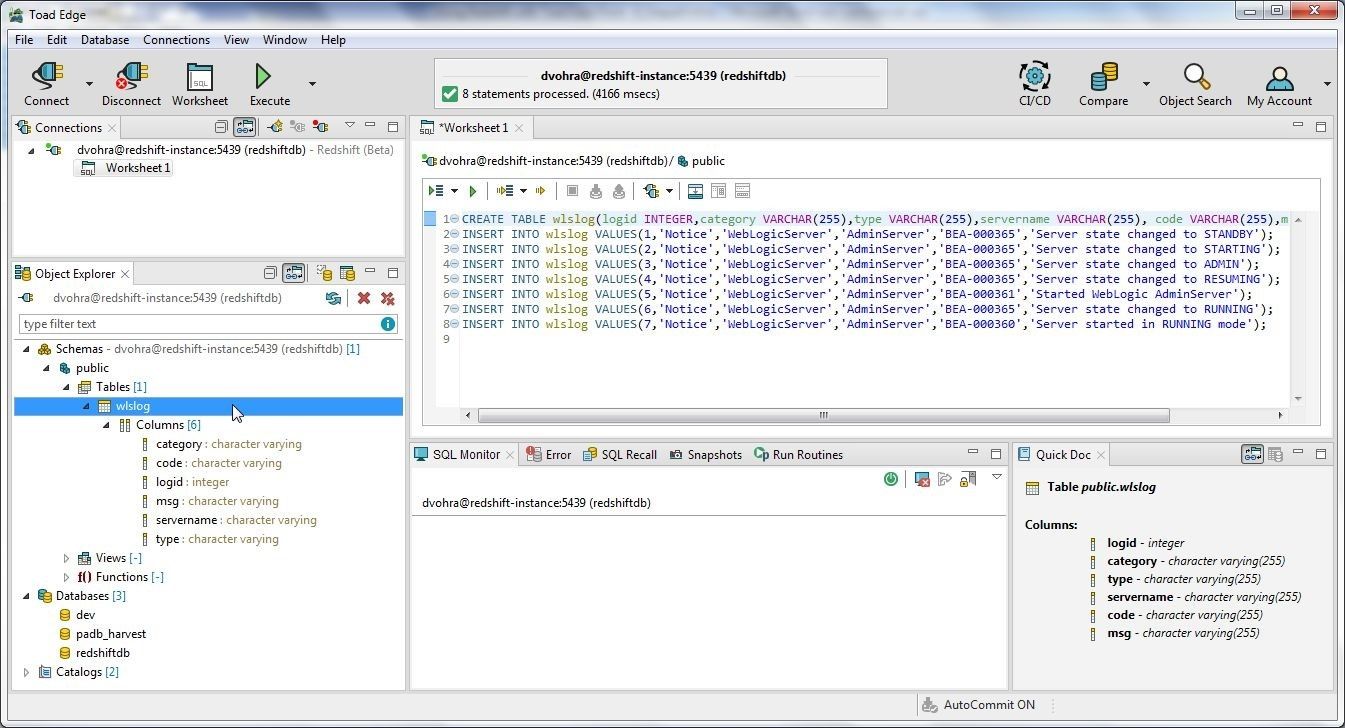
Figure 3. Table wlslog Created
The various options available for a new table are Refresh, Drop, and Cascade Drop, as shown in Figure 4. Right-click on the wlslog table to display and use the options.
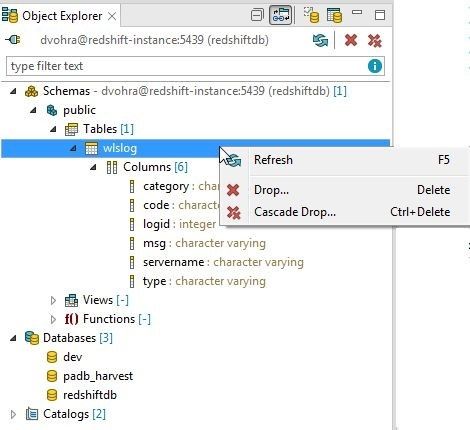
Figure 4. Table Options
Querying Table
In this section we shall query the table created. Open a new SQL Worksheet by selecting Open SQL Worksheet in toolbar as shown in Figure 5.
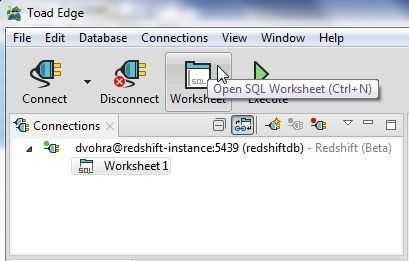
Figure 5. Open SQL Worksheet
Add SELECT to the worksheet and using code completion feature of the worksheet select * as shown in Figure 6.
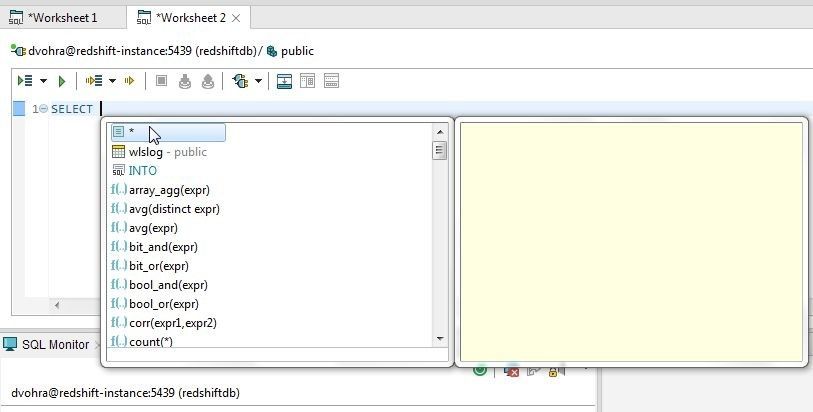
Figure 6. Adding SQL Query Statement using Code Completion
Add a space and code completion displays the options available; from which, select FROM as shown in Figure 7.
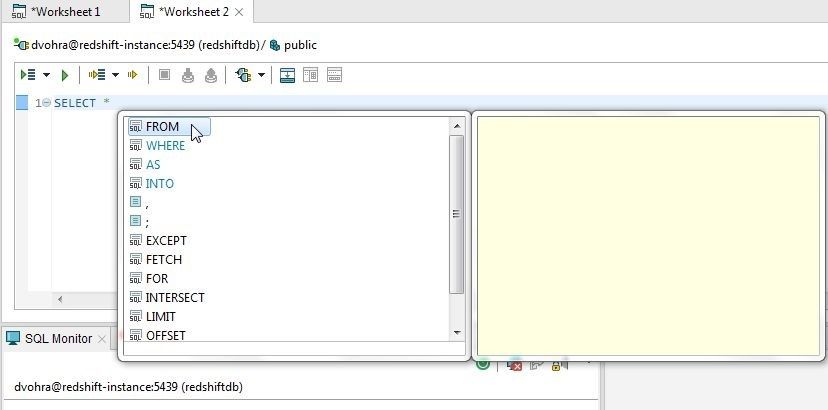
Figure 7. Selecting FROM from Code Completion Options
Using further code completion select the wlslog table as shown in Figure 8.
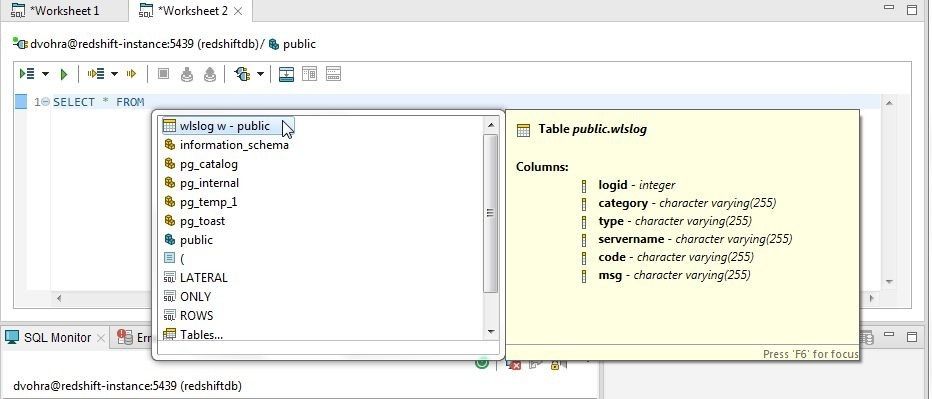
Figure 8. Selecting Table wlslog
The complete SQL query statement is shown in Figure 9. Optionally add a “;” at the statement end.
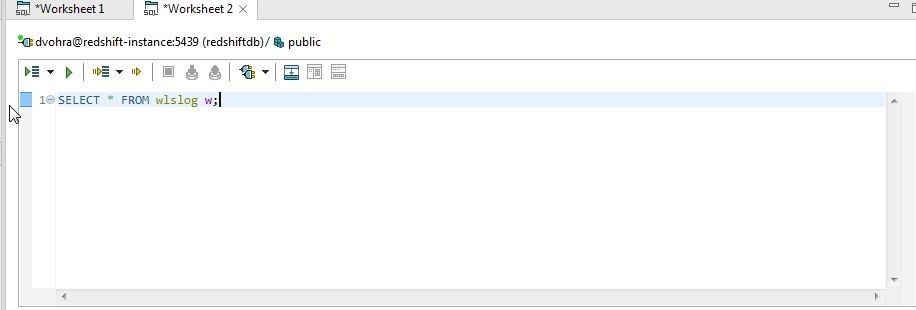
Figure 9. SQL Query Statement
Click on Execute SQL Statement to run the statement as shown in Figure 10.
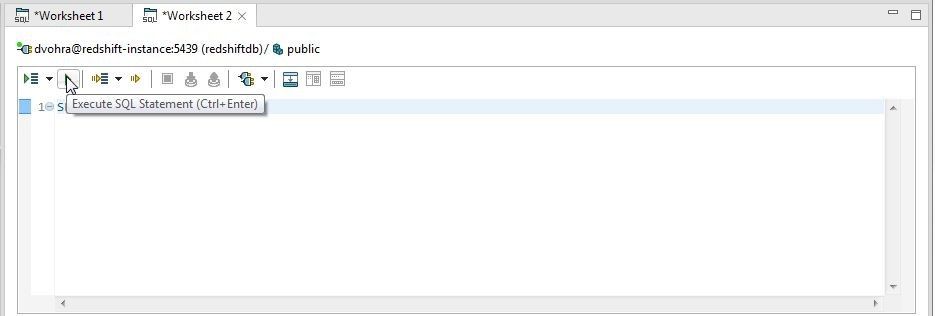
Figure 10. Execute SQL Statement
The SQL query runs and a Result Set is displayed, as shown in Figure 11.
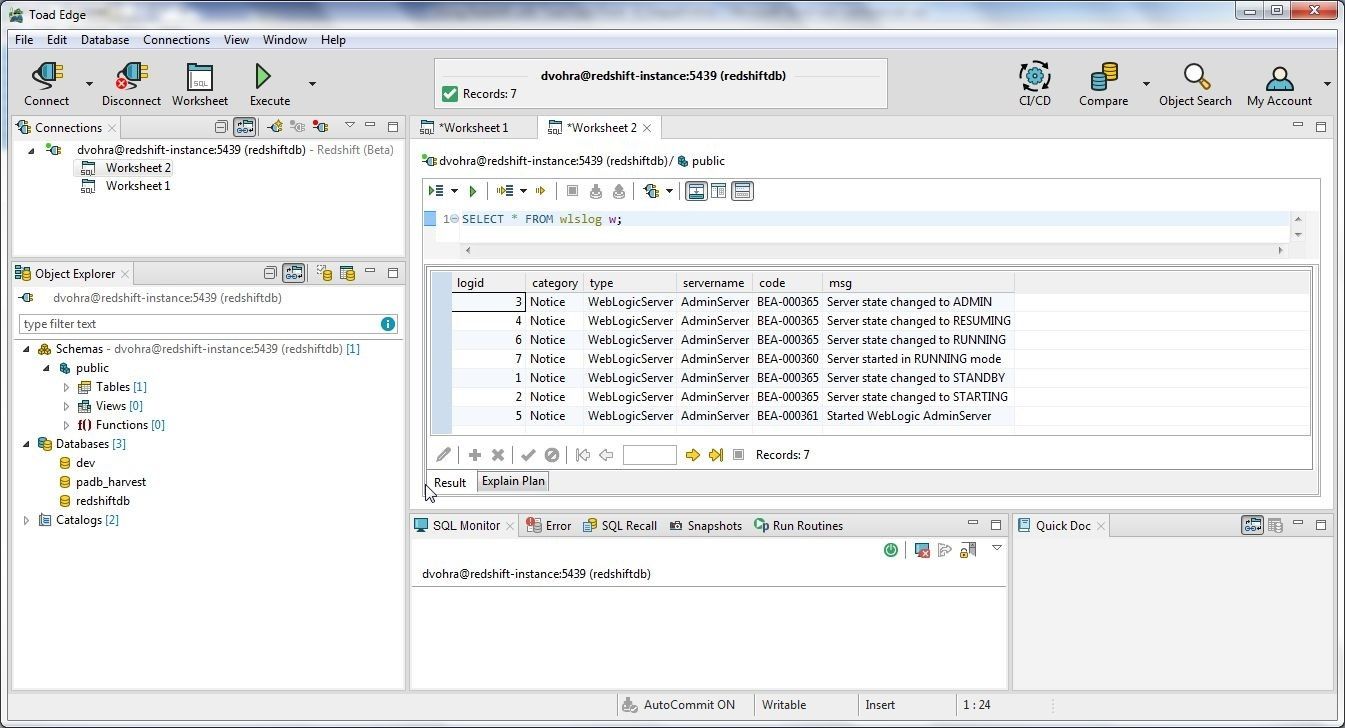
Figure 11. Result Set
The SQL Recall lists the SQL Statements that have run successfully or have failed, as shown in Figure 12.
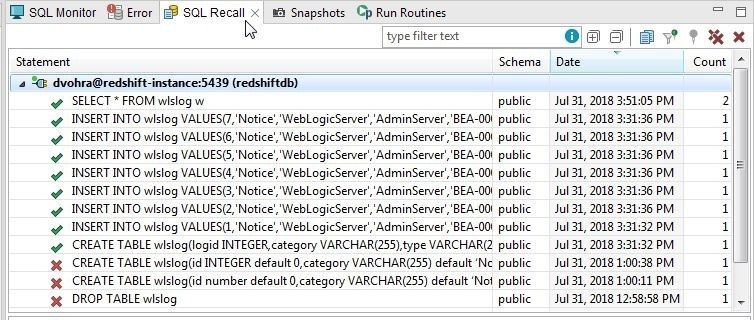
Figure 12. SQL Recall
Displaying Result
Different options are available to customize the display of the result set, including the following:
– Show or Undisplay Result
– Hide individual Columns with the restore option
– Sort individual column values in ascending or descending mode
– Toggle between Vertical and Horizontal Layout
The Show Result button shown in Figure 13 toggles between showing and undisplaying result. With result displayed click on Show Result.
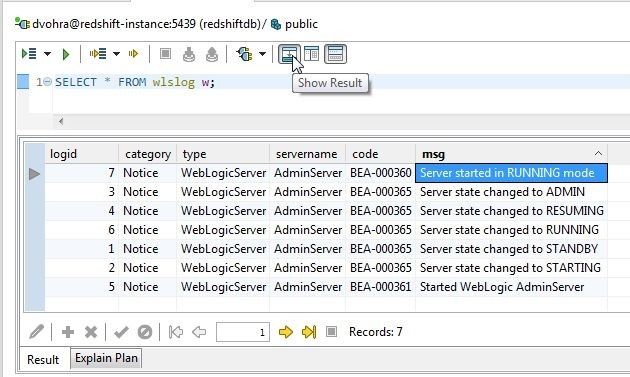
Figure 13. Show Result Toggle
The result gets undisplayed, as shown in Figure 14.
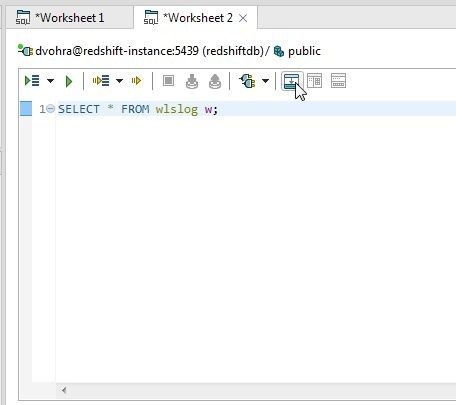
Figure 14. Result undisplayed
Click on Show Result again to redisplay the result.
To hide an individual column right-click in the column and select Hide Column as shown in Figure 15. Hide Column is selected for the code column in Figure 15.
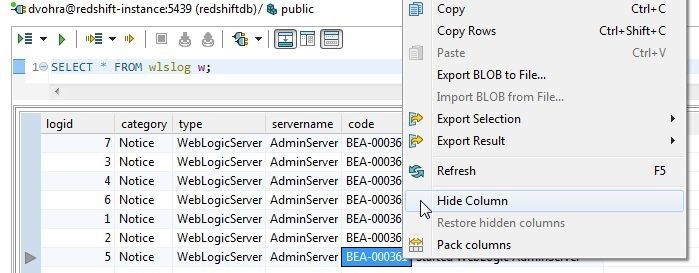
Figure 15. Hide Column
The code column gets removed from the result set, as shown in Figure 16. Similarly, select Hide Column for the servername column as shown in Figure 16.
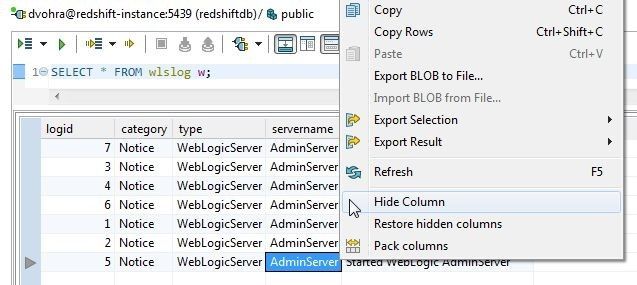
Figure 16. Selecting Hide Column for servername
Remove the category and type columns similarly to display only two columns in result, logid and msg, as shown in Figure 17.
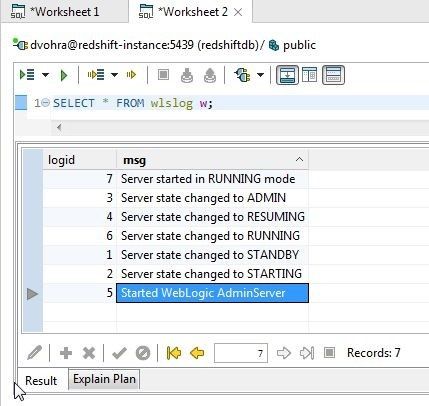
Figure 17. Result with only 2 Columns
To restore hidden columns right-click in the result set and select Restore hidden columns as shown in Figure 18.
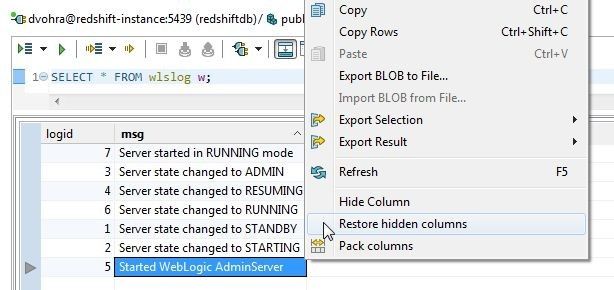
Figure 18. Restore Hidden Columns
All the hidden columns get restored, as shown in Figure 19. Columns may be hidden one at a time and restored together.
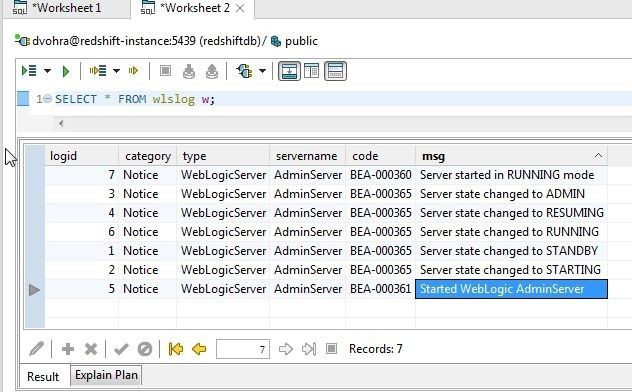
Figure 19. Hidden Columns Restored
Individual attribute or column values may be displayed in ascending or descending mode. As the attribute values are correlated with other attributes in a data record, setting one column in ascending/descending mode would modify the ordering of the other columns and each column cannot be ordered in ascending/descending mode independently. For numeric values ascending is from lower numeric value to higher numeric value and for non-numeric values ascending and descending are based alphabetically. Display the msg column values in ascending mode by setting the toggle to ^ as shown in Figure 20.
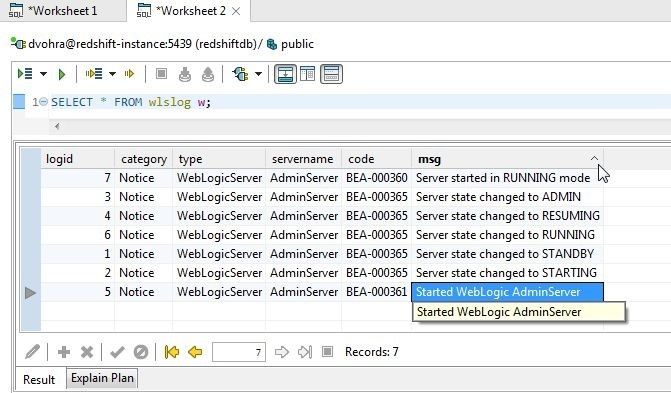
Figure 20. Setting msg Column toggle to ^
To display in alphabetically descending mode set the toggle to v as shown in Figure 21.
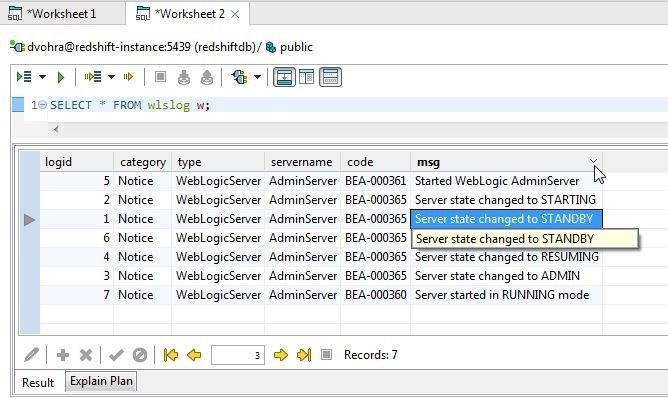
Figure 21. Displaying msg Column in Descending Mode
Similarly, the code column values are shown in descending mode in Figure 22.

Figure 22. Code Column Values in Descending Mode
And the code column values are shown in ascending mode in Figure 23.

Figure 23. Code Column Values in Ascending Mode
The logid column type is a numeric data type and is shown in ascending mode in Figure 24.
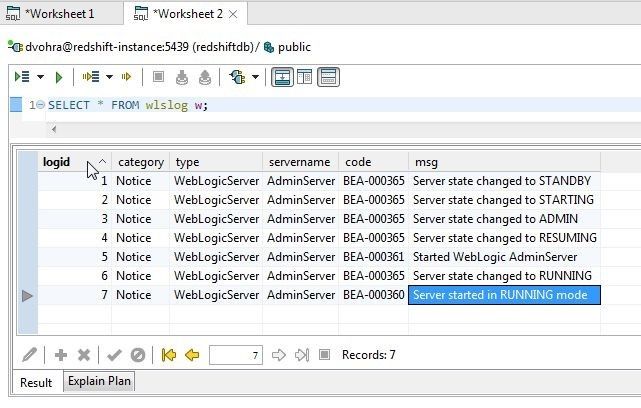
Figure 24. Logid Column Values in Ascending Mode
The logid column values in descending mode are shown in Figure 25.
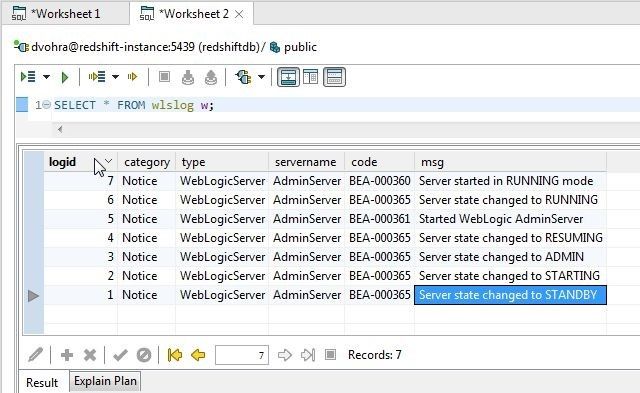
Figure 25. Logid column Values in Descending Mode
By default the layout of the Worksheet and the Result is Horizontal, as shown in Figure 26. To display vertically click on Vertical Layout as shown in Figure 26.
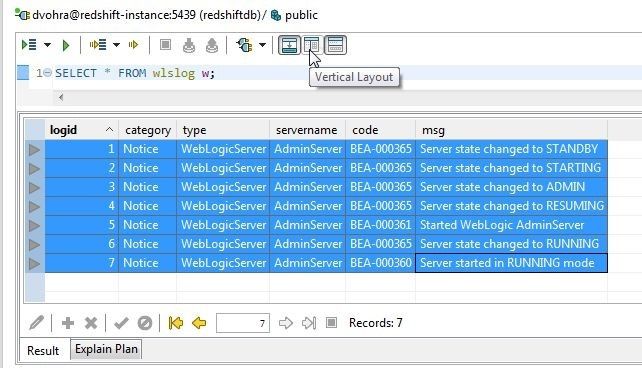
Figure 26. Selecting Vertical Layout
The SQL Worksheet and Result get displayed vertically as shown in Figure 27.
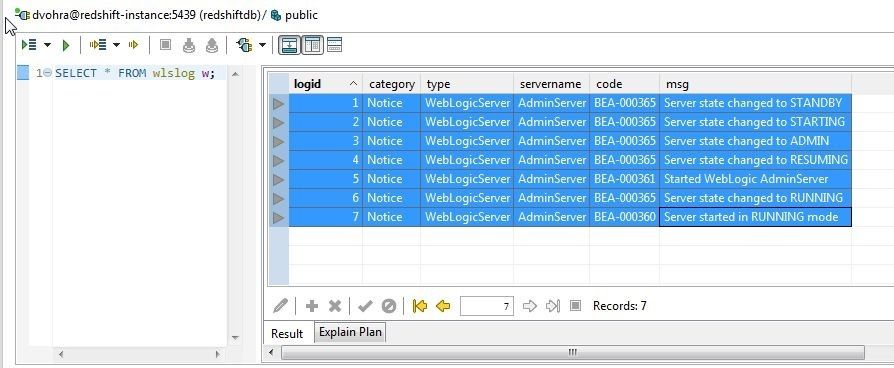
Figure 27. Vertical Layout
To revert to horizontal layout select Horizontal Layout as shown in Figure 28.
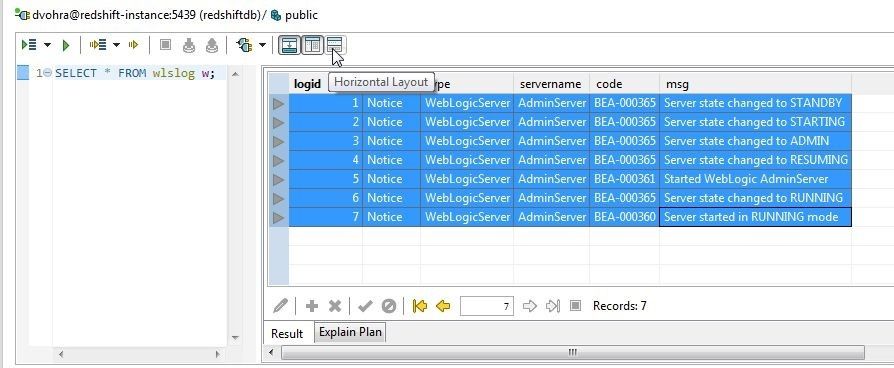
Figure 28. Selecting Horizontal Layout
The layout gets reverted to horizontal as shown in Figure 29.
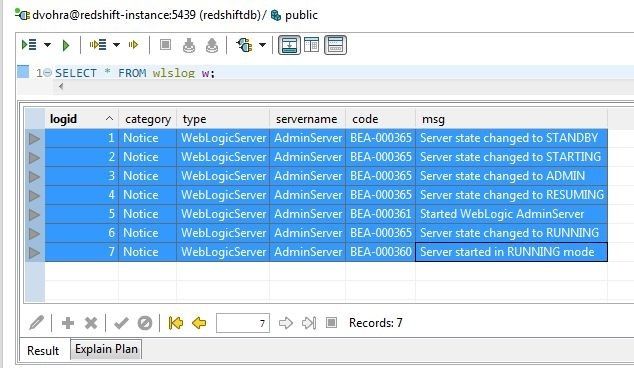
Figure 29. Horizontal Layout
Exporting Query Result
A result set may be exported to one of the supported formats (CSV,HTML,SQL, and XML). The complete result may be exported or selected rows may be exported. To export the complete result right-click in the result set and select Export Result>CSV (or SQL) as shown in Figure 30.
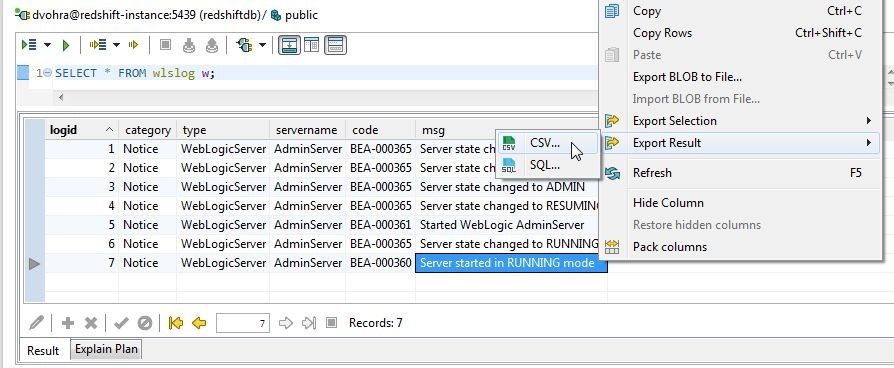
Figure 30. Export Result>CSV
In Export Data select the output format as CSV and select Destination for Exported Data as Worksheet as shown in Figure 31. The export.csv file gets generated in the Users directory by default. With Format exported queries selected click on Next.
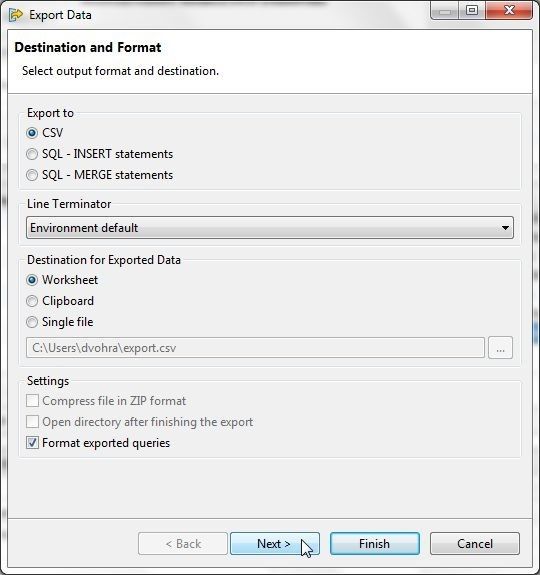
Figure 31. Export Data>Destination and Format
Next, define detailed CSV settings as shown in Figure 32. Keeping the default settings for Field Delimiter, Text Delimiter, Escape Character, and with the Include Column Headers selected, click on Finish.
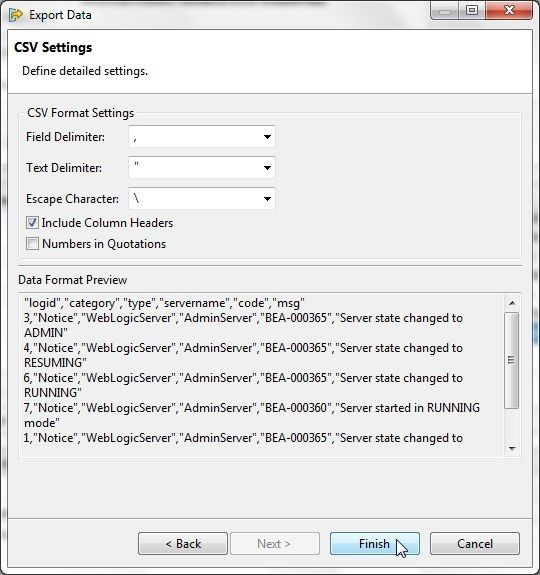
Figure 32. CSV Settings
The CSV file exported is shown in Figure 33.
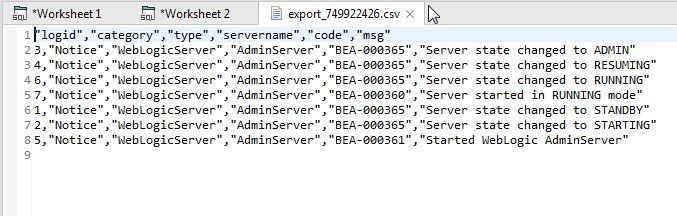
Figure 33. CSV File Exported
As another example of exporting the result set, select a single row and right-click and select Export Selection>HTML as shown in Figure 34.
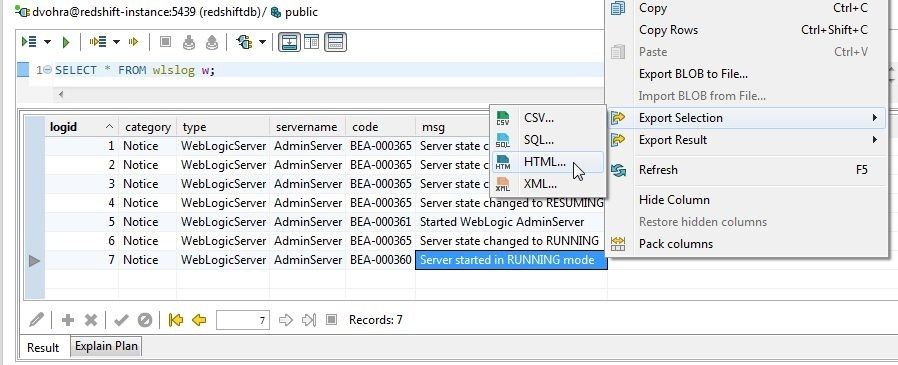
Figure 34. Exporting Single Row to HTML
In the Save As dialog specify a File name to save to and click on Save. The HTML file exported is shown in Figure 35.
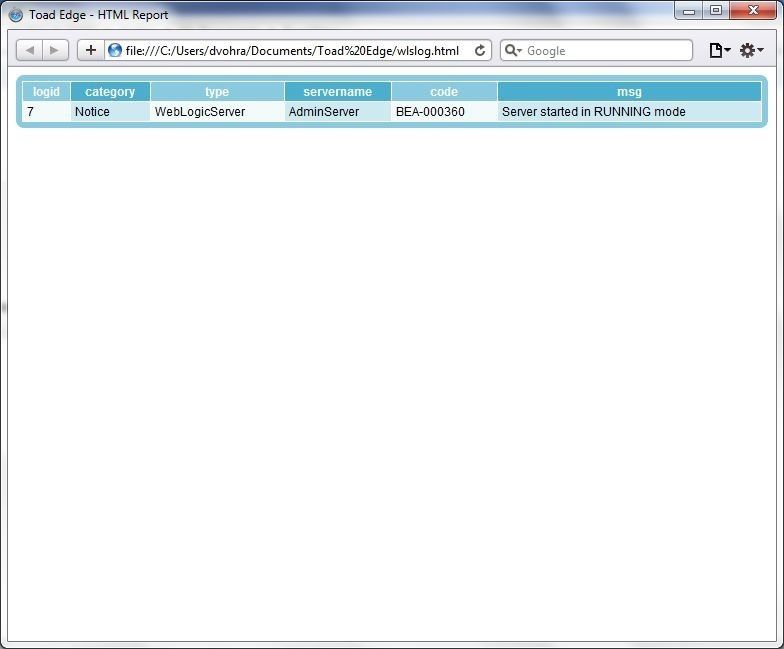
Figure 35. HTML File Exported
To select the complete result select all the rows with Shift+Row. Right-click and select Export Selection>HTML as shown in Figure 36.
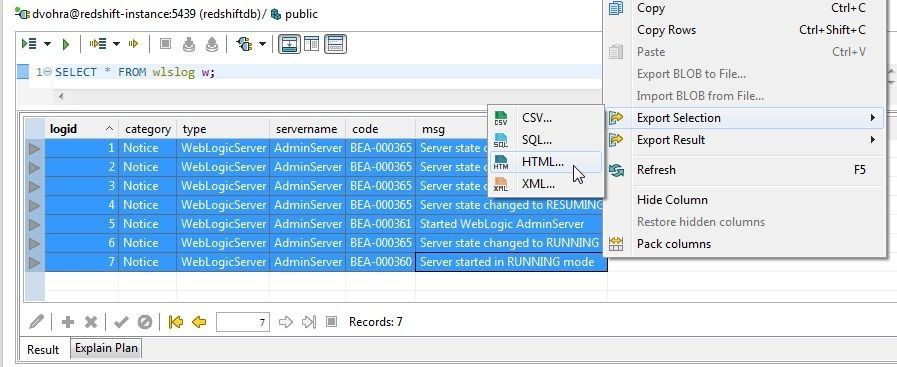
Figure 36. Exporting All Rows to HTML
Specify File name to save to as before. The exported HTML is shown in Figure 37.
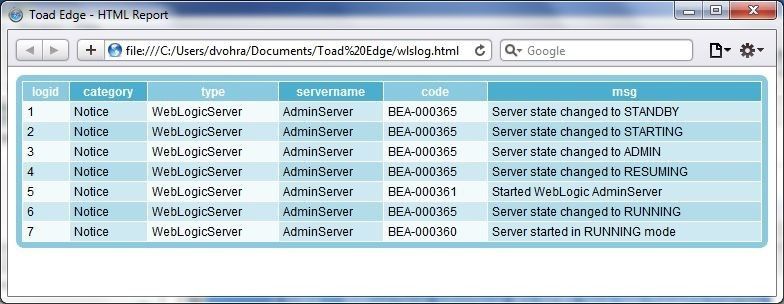
Figure 37. Exported HTML
Creating Multiple Connections
In this section we shall discuss using multiple connections to the same or a different Redshift cluster. Multiple connections may be created with New Connection or a connection may be copied. To copy a connection right-click on the connection and select Copy Connection as shown in Figure 38.
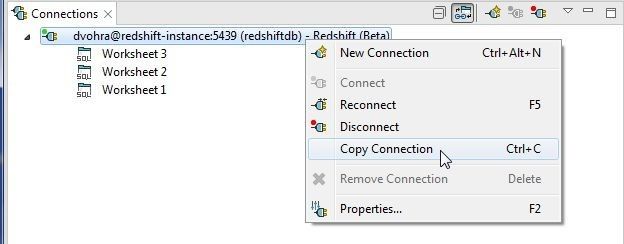
Figure 38. Copy Connection
The Copy Connection dialog has all the connection settings copied over from the connection being copied, as shown in Figure 39. Click on Test Connection to test the connection. If the connection gets established the message Connection is OK is displayed. Click on Finish.
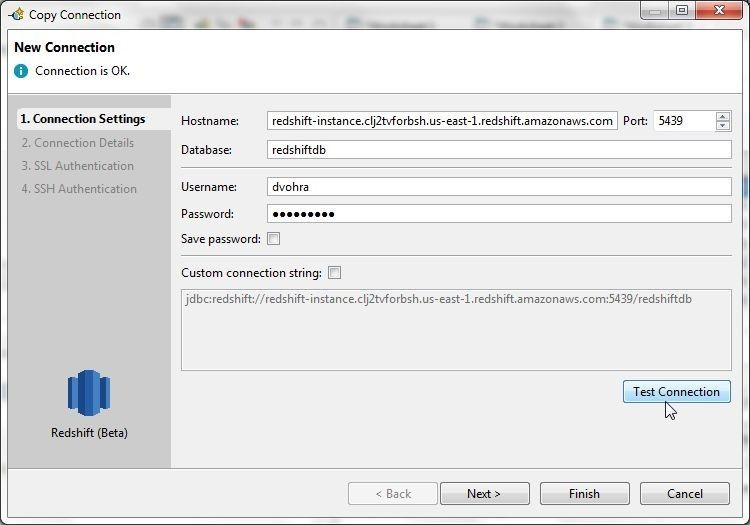
Figure 39. Copy Connection
The copied connection is shown in the Connections view in Figure 40, with a SQL Worksheet associated with it. The tables also get copied to the new connection. Thewlslog table is listed for the copied connection.
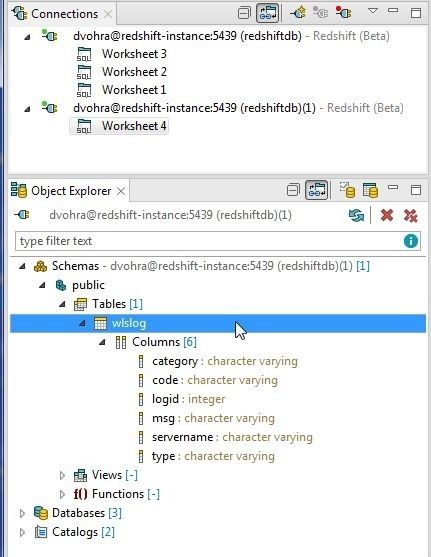
Figure 40. Copied Connection
The table data also gets copied. Thewlslog table data is shown in Figure 41.
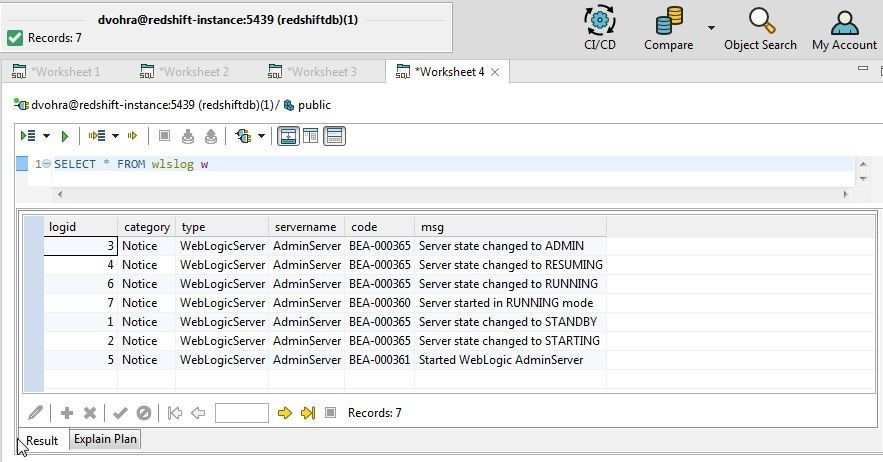
Figure 41. Table Data is also copied
The Connect in the tool bar displays both the copied and the copied-from connection, as shown in Figure 42.
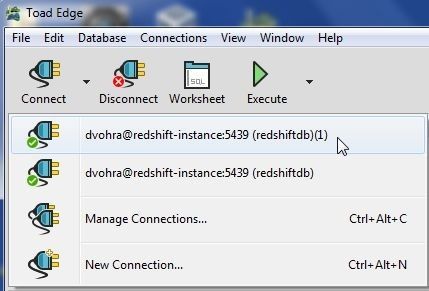
Figure 42. Copied and Copied-from Connections
Disconnecting, Reconnecting, and Removing a Connection
To disconnect a connection either select Disconnect in the toolbar or right-click on the connection in Connections and select Disconnect as shown in Figure 43.
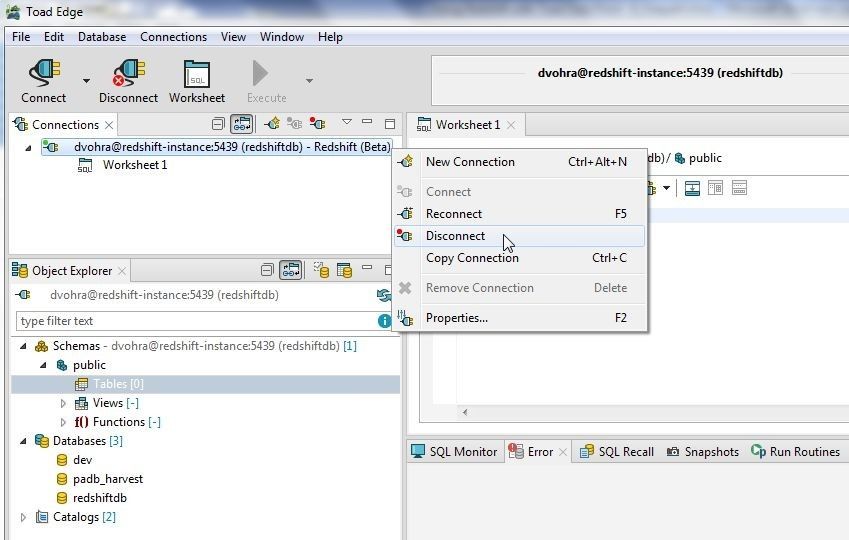
Figure 43. Disconnect
To connect again right-click on the connection and select Connect as shown in Figure 44.
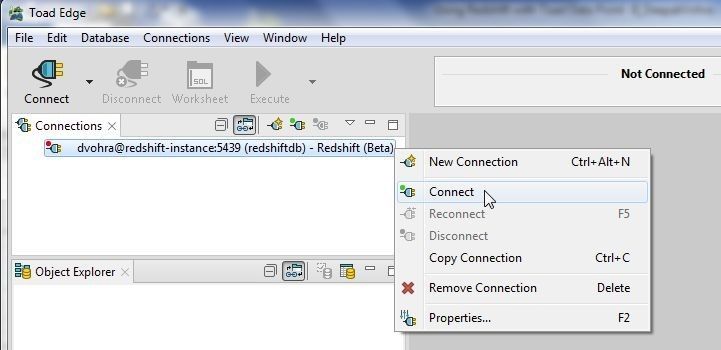
Figure 44. Connecting Again
In the Enter Password dialog specify Password and click on OK as shown in Figure 45.
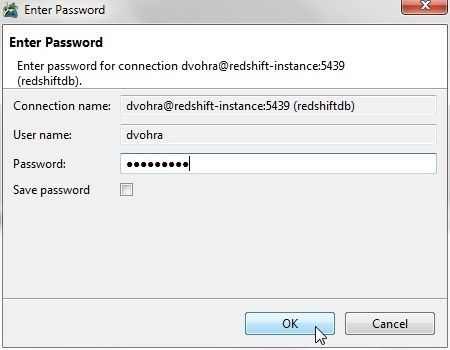
Figure 45. Enter Password
A connection may also be connected and disconnected from the Connections drop-down, as shown in Figure 46.
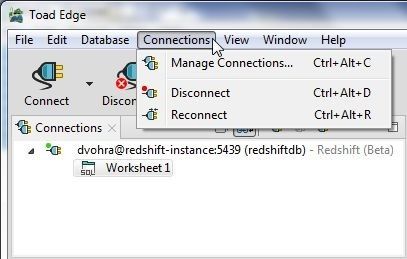
Figure 46. Connections
Disconnect Selectedconnection may also be selected from the Connectionsview, as shown in Figure 47.
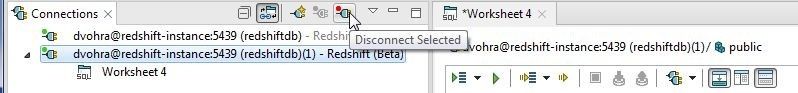
Figure 47. Selecting Disconnect Selected in Connections View
To remove a connection right-click on the connection and select Remove Connection as shown in Figure 48. Only a connection that has first been disconnected may be removed.
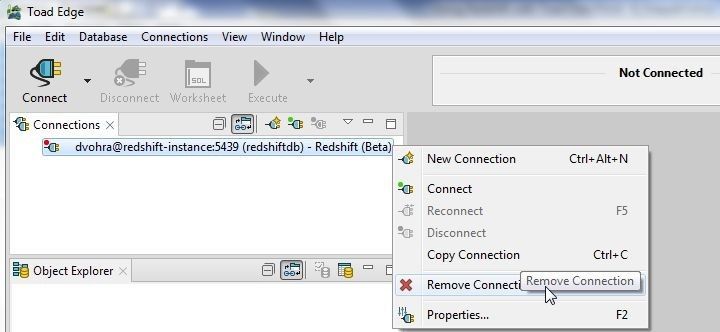
Figure 48. Removing a Connection
Dropping Table
To drop a table right-click on the table in Object Explorer and select Drop as shown in Figure 49.
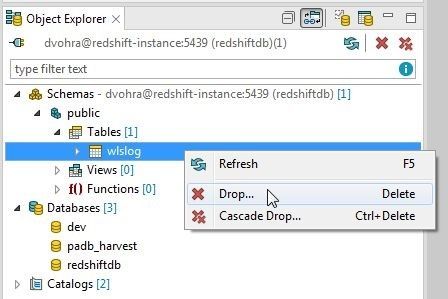
Figure 49. Dropping Table
Click on OK in Confirm dialog as shown in Figure 50.
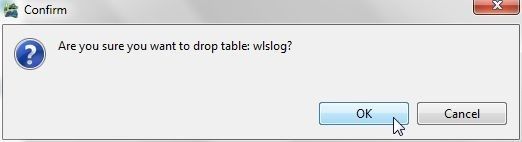
Figure 50. Confirm>OK
The table gets dropped, as indicated by absence of tables in Figure 51.
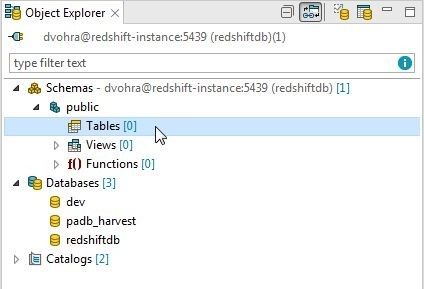
Figure 51. Table Dropped
Deleting a Cluster
To delete a Redshift cluster select the cluster in the console and select Cluster>Delete Cluster as shown in Figure 52.
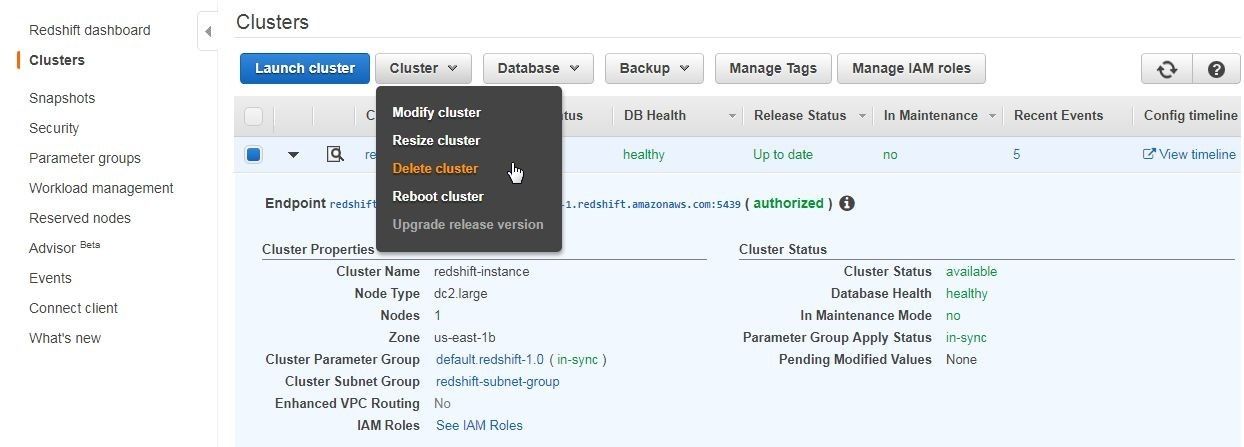
Figure 52. Cluster>Delete Cluster
In the Delete Cluster dialog an option create a snapshot is provided, as shown in Figure 53. To not create a snapshot select No for Create Snapshot and click on Delete.
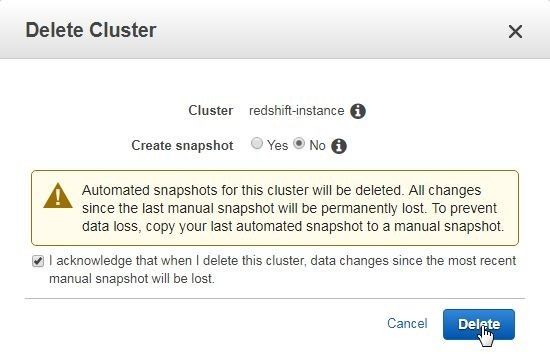
Figure 53. Delete Cluster
The cluster starts to get deleted as shown by the Cluster Status as deleting in Figure 54.
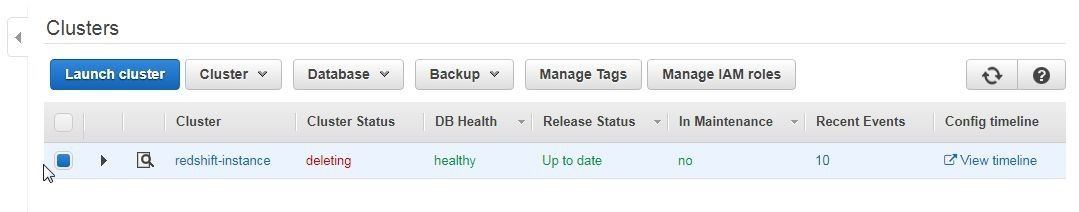
Figure 54. Cluster getting Deleted
If a snapshot is to be made select Yes for Create Snapshot and specify a snapshot name, and click on Delete as shown in Figure 55.
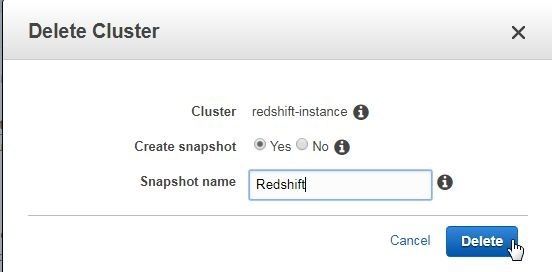
Figure 55. Creating Snapshot before Deleting
A snapshot gets created, as shown in Figure 56.
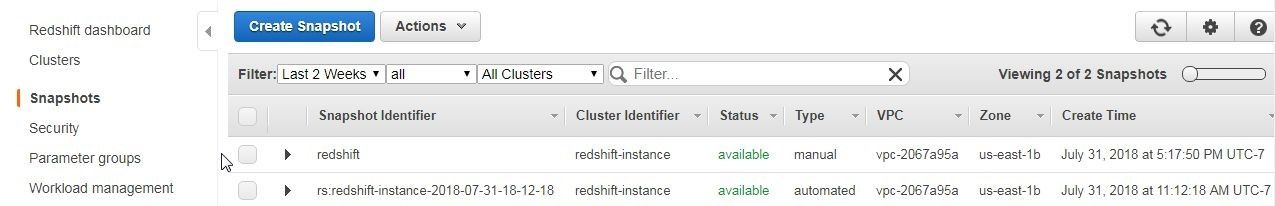
Figure 56. Snapshot Created
Only after the snapshot has been created does the cluster start to get deleted, as shown in Figure 57.
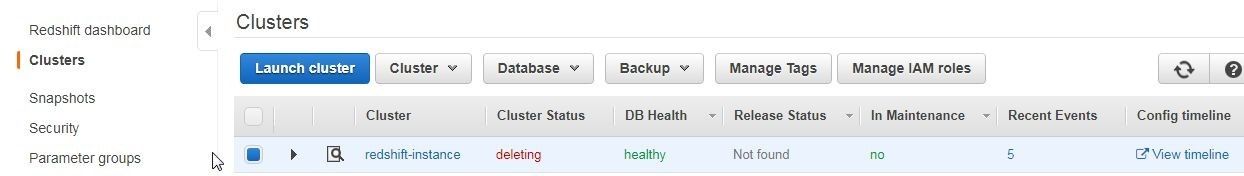
Figure 57. Cluster Deleting
A cluster that has been deleted may be restored by selecting Actions>Restore from Snapshot as shown in Figure 58.
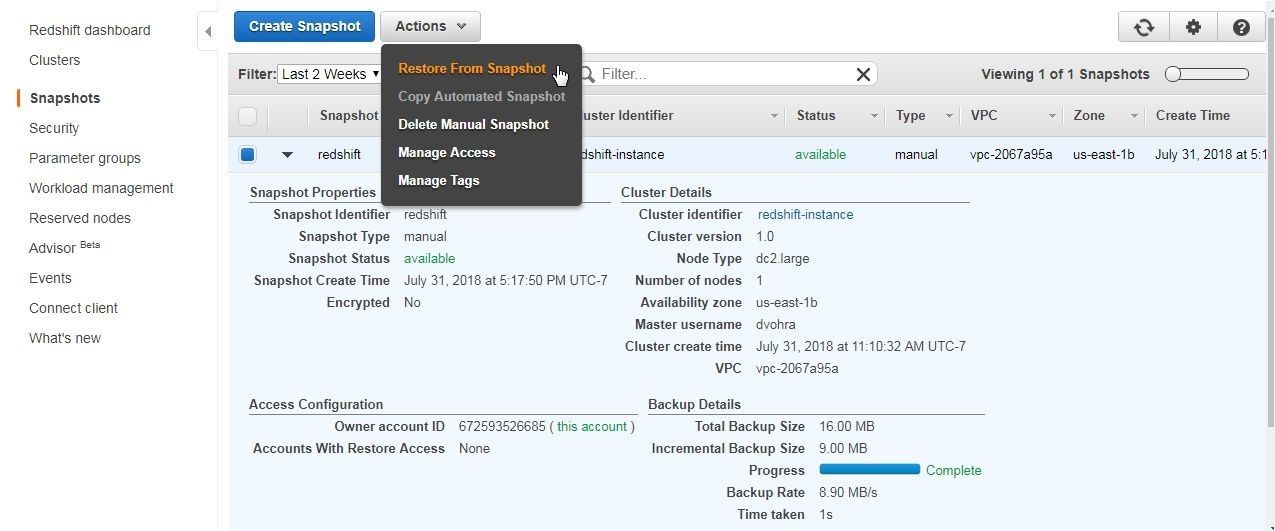
Figure 58. Actions>Restore from Snapshot
In the Restore Cluster from Snapshot dialog select the default settings as shown in Figure 59 or modify as needed. Scroll down and click on Restore.
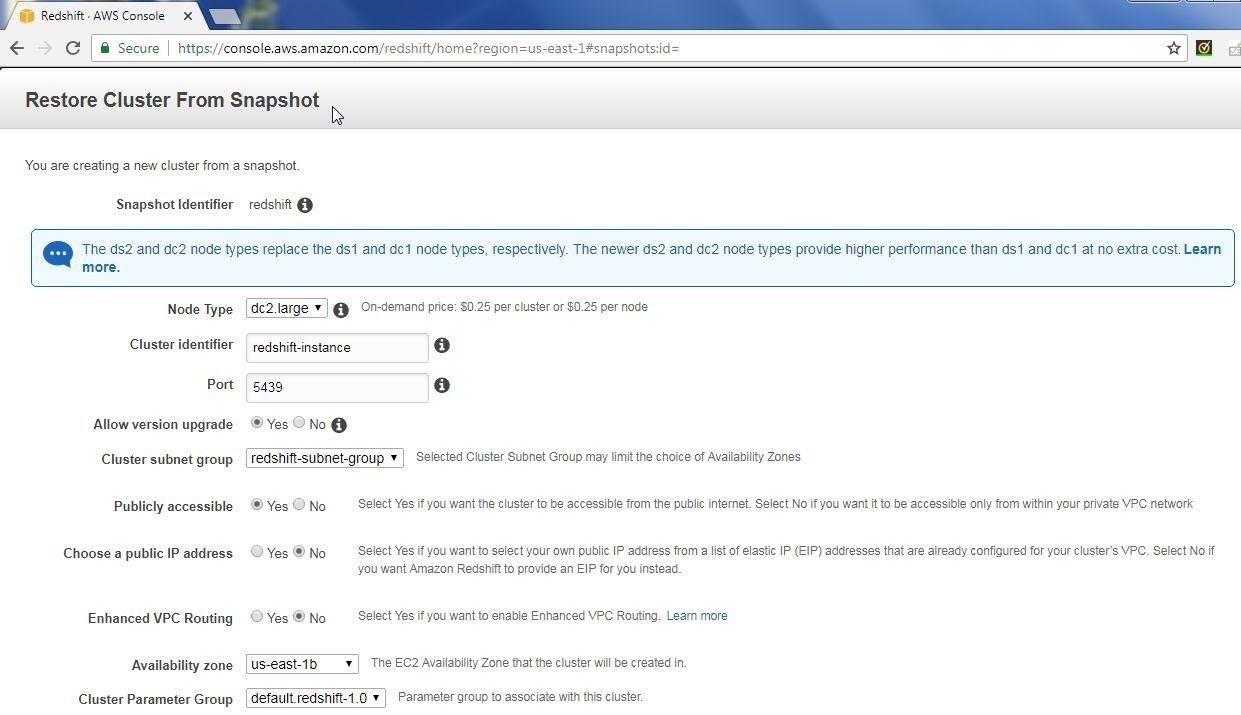
Figure 59. Restore Cluster from Snapshot
The cluster starts to get restored, as shown in Figure 60.
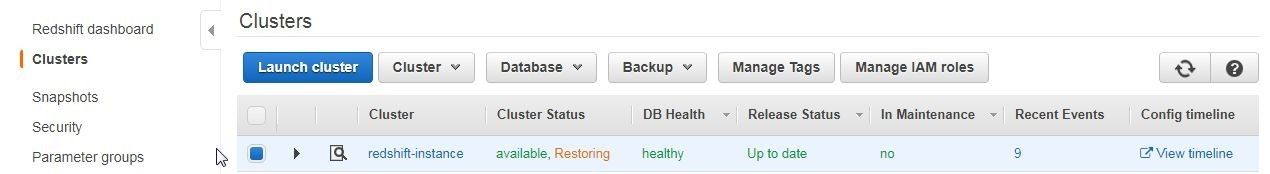
Figure 60. Cluster getting restored
Conclusion
In two articles we have discussed using the Amazon Redshift data warehouse with Toad Edge 2.0.2. Toad Edge is one of the very few client IDEs for Redshift and provides all the features for Redshift that are available for the open source databases MySQL and PostgreSQL.
Start the discussion at forums.toadworld.com