During my presentation about “Spark with Python”, I told that I would share example codes (with detailed explanations). So this is my first example code. In this code, I read data from a CSV file to create a Spark RDD (Resilient Distributed Dataset). RDDs are the core data structures of Spark. I explained the features of RDDs in my presentation, so in this blog post, I will only focus on the example code.
For this sample code, I use the “u.user” file file of MovieLens 100K Dataset. I renamed it to “users.csv” but you can use it with current name if you want.
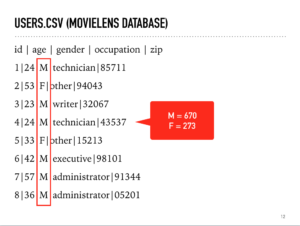
Using this simple data, I will group users based on genders and find the number of men and women in the users data. As you can see, the 3rd element indicates the gender of a user and the columns are separated with a pipe (|) symbol instead of comma. So I write the below script:
from pyspark import SparkContext
sc = SparkContext.getOrCreate()
print sc.textFile( "users.csv" )
    .map(lambda x: (x.split('|')[2],1) )
    .reduceByKey( lambda x,y:x+y )
    .collect()
sc.stop()
Here are the step by step explanation of the code:
Line 1) Each Spark application needs a Spark Context object to access Spark APIs. So we start with importing SparkContext library.
Line 3) Then I create a Spark Context object (as “sc”) – If you will run this code in PySpark client or in a notebook such as Zeppelin, you should ignore first two steps (importing SparkContext and creating sc object), because the SparkContext is already defined. You should also ignore the last line because you don’t need to stop the Spark context.
Line 5) sc.TextFile method reads from a file and returns the content as RDD (when we call an action because RDDs are lazy evaluated). The print command will write out the result.
Line 6) I use “map” to apply a function to all rows of RDD. Instead of defining a regular function, I use “lambda” function. The lambda functions have no name, and defined inline where they are used. My function accepts a string parameter (called X), and parses the X string to a list, and returns the combination of 3rd element of the list with “1”. So we get Key-Value pairs like (‘M’,1) and (‘F’,1). By the way, the index of the first element is 0.
Line 7) reduceByKey method is used to aggregate each key using the given reduce function. The previous “map” function produced an RDD which contains (‘M’,1) and (‘F’,1) elements. So the reduceByKey will group ‘M’ and ‘F’ keys, and the lambda function will add these 1’s to find the number of elements in each group. The result will be a Python list object: [(u’M’, 670), (u’F’, 273)]
Line 8) Collect is an action to retrieve all returned rows (as a list), so Spark will process all RDD transformations and calculate the result.
Line 10) sc.stop will stop the context – as I said it’s not necessary for pyspark client or notebooks such as Zeppelin.
If you’re not familiar with the lambda functions, let me share the same script with regular functions:
from pyspark import SparkContext
sc = SparkContext.getOrCreate()

def parsethecsv( x ):
    return (x.split('|')[2],1)

def aggregatevalues( x, y ):
    return x + y

print sc.textFile( "users.csv" )
    .map(parsethecsv)
    .reduceByKey(aggregatevalues)
    .collect()

sc.stop()
It produces the same result with same performance. Now let me write another one, this time, I will group the users based on their occupations:
from pyspark import SparkContext
sc = SparkContext.getOrCreate()

result = sc.textFile( "users.csv" )
    .map(lambda x: (x.split('|')[3],1) )
    .filter( lambda x: x[0] != 'other' )
    .reduceByKey( lambda x,y:x+y )
    .sortBy( lambda x: -x[1] ).collect()

for line in result:
    print line

sc.stop()
Line 1,3,14) I already explained them in previous code.
Line 5) Instead of writing the output directly, I will store the result of the RDD in a variable called “result”. sc.textFile opens the text file and returns an RDD.
Line 6) I parse the columns and get the occupation information (4th column)
Line 7) I filter out the users whose occupation information is “other”
Line 8) Calculating the counts of each groups
Line 9) I sort the data based on “counts” (x[0] holds the occupation info, x[1] holds the counts), and retrieve the result.
Lined 11) Instead of print, I use “for loop” so the output of the result looks better.
That’s all for now. I’ll write similar code in my next blog post but this time I’ll use DataFrame instead of RDDs. If you have Oracle Cloud account, you can download and import example #1 notebook to test the scripts.
Start the discussion at forums.toadworld.com