Recently I was talking to some SalesForce developers. I had to admit, I did not know what that meant. What do you develop for SalesForce?
They took the time to explain what they do: write reports on the data, perform analysis of the data, and pass data to end users for reporting.
As they were explaining this to me it became clear that Toad Data Point would be a good fit. They seemed frustrated with the limitations of the tools SalesForce provides and whatever other tools they may have been using to get their job done.
I explained to them how Toad Data Point allows you to connect to multiple data sources, relational and non-relational data sources, and how you can connect to multiple data sources at once and join tables across data sources for querying and reporting.
You could see the light bulbs go on, and excitement increased in the room. They started discussing amongst themselves how they could use something like this to do x, y, z. Again, I have to admit I did not understand the jargon but I caught the gist of the conversation.
There was more than one “I could have used this last week” comment.
So I took them through the process of connecting to SalesForce:
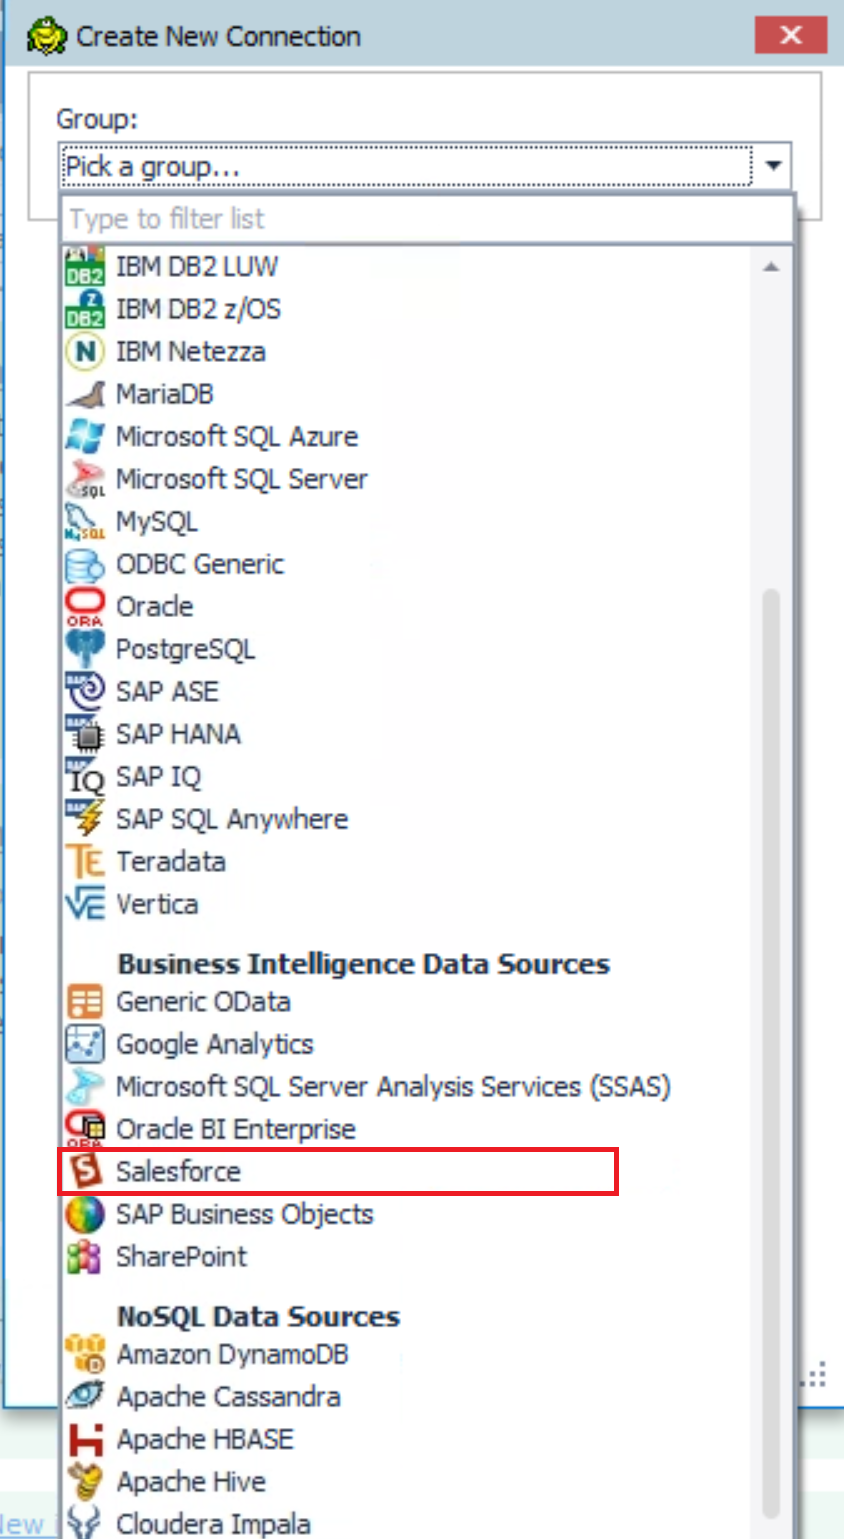
Choose Salesforce from the dropdown list shown above.
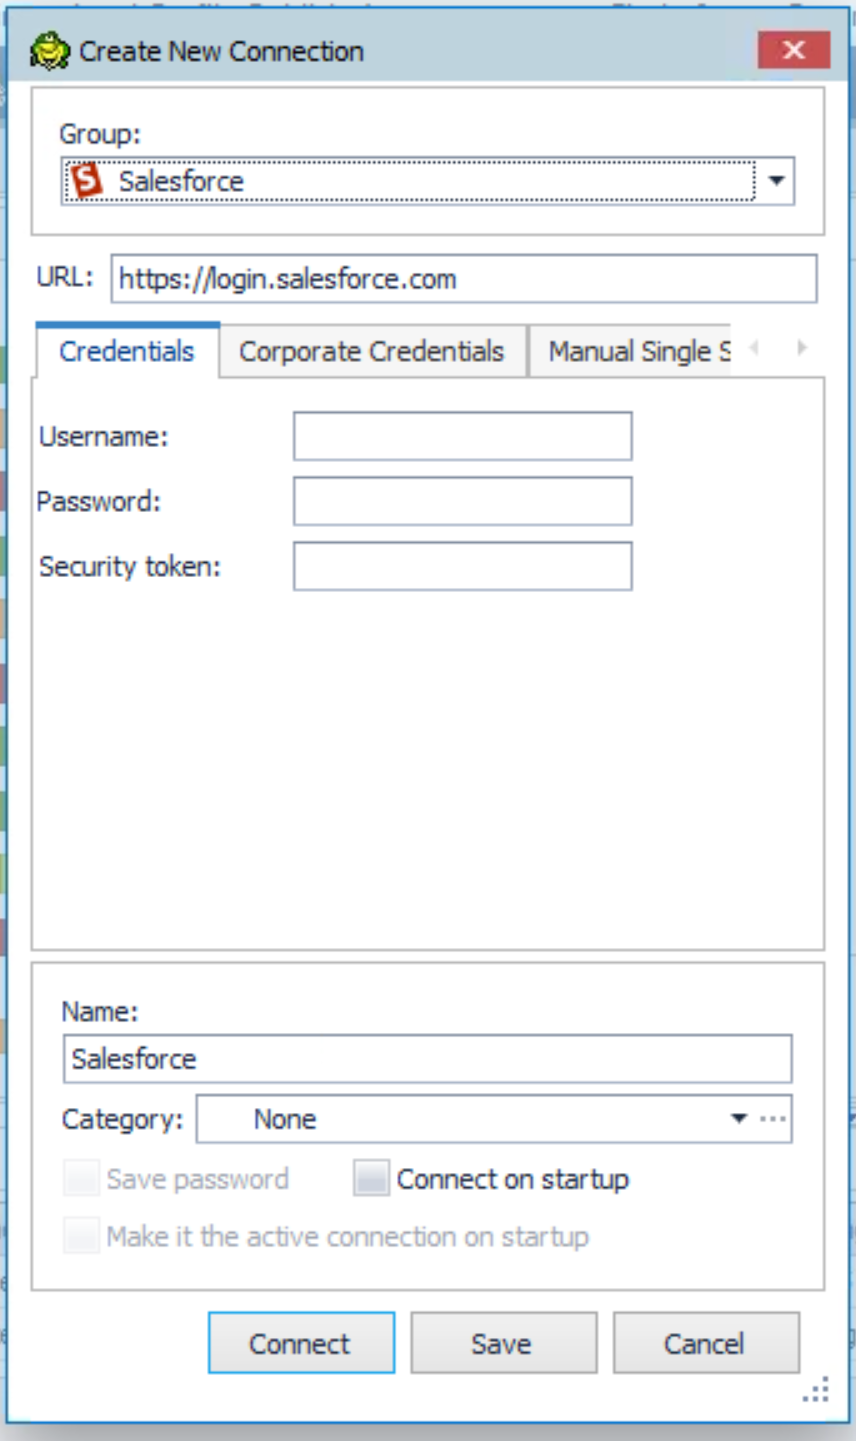
Then enter your credentials in the connection dialog box:
Then you will see a connection listed in the Navigation Manager window:
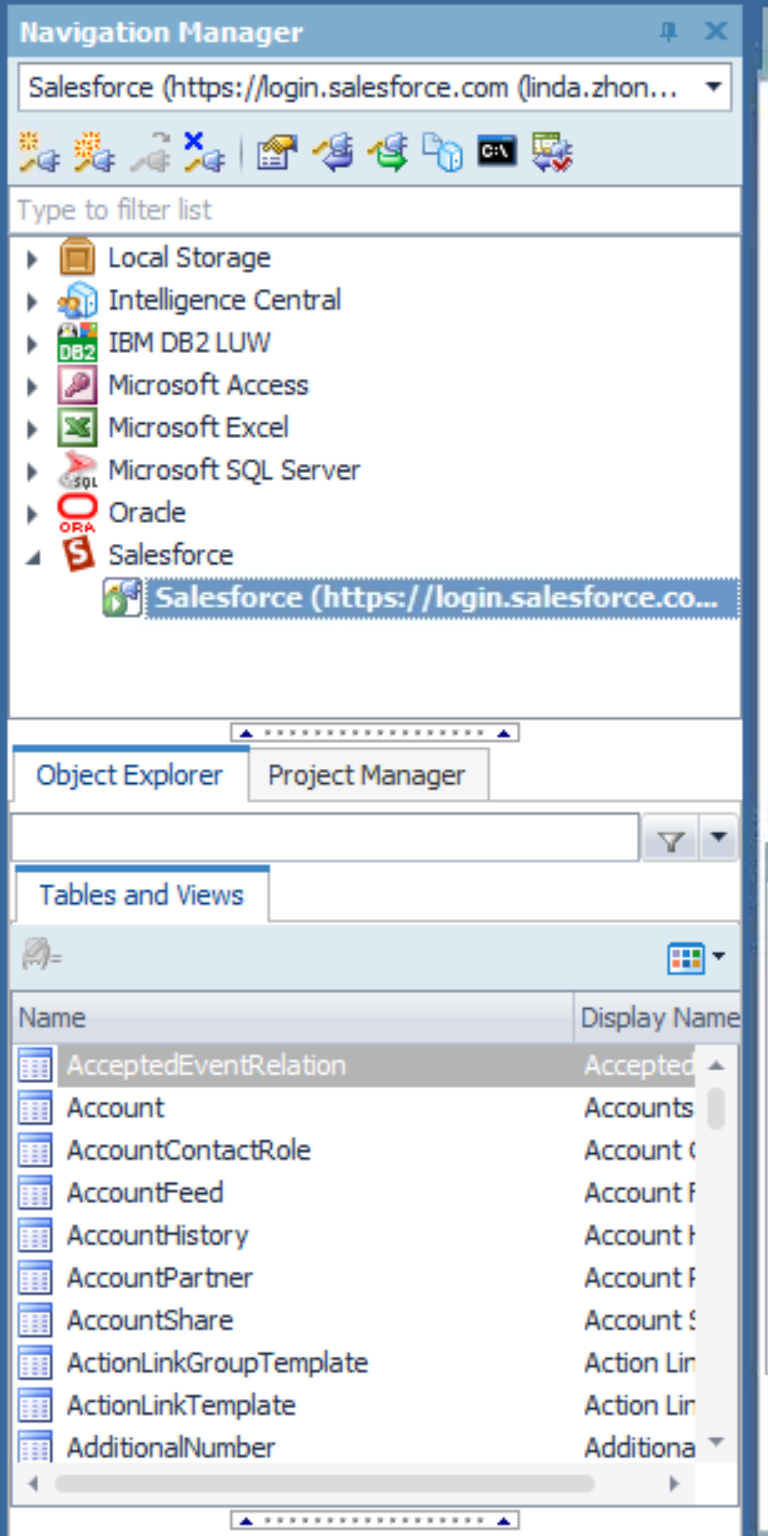
You will also see a list of ‘Tables and Views’ in the Object Explorer tab. From here you can double-click on a table and see the table details:
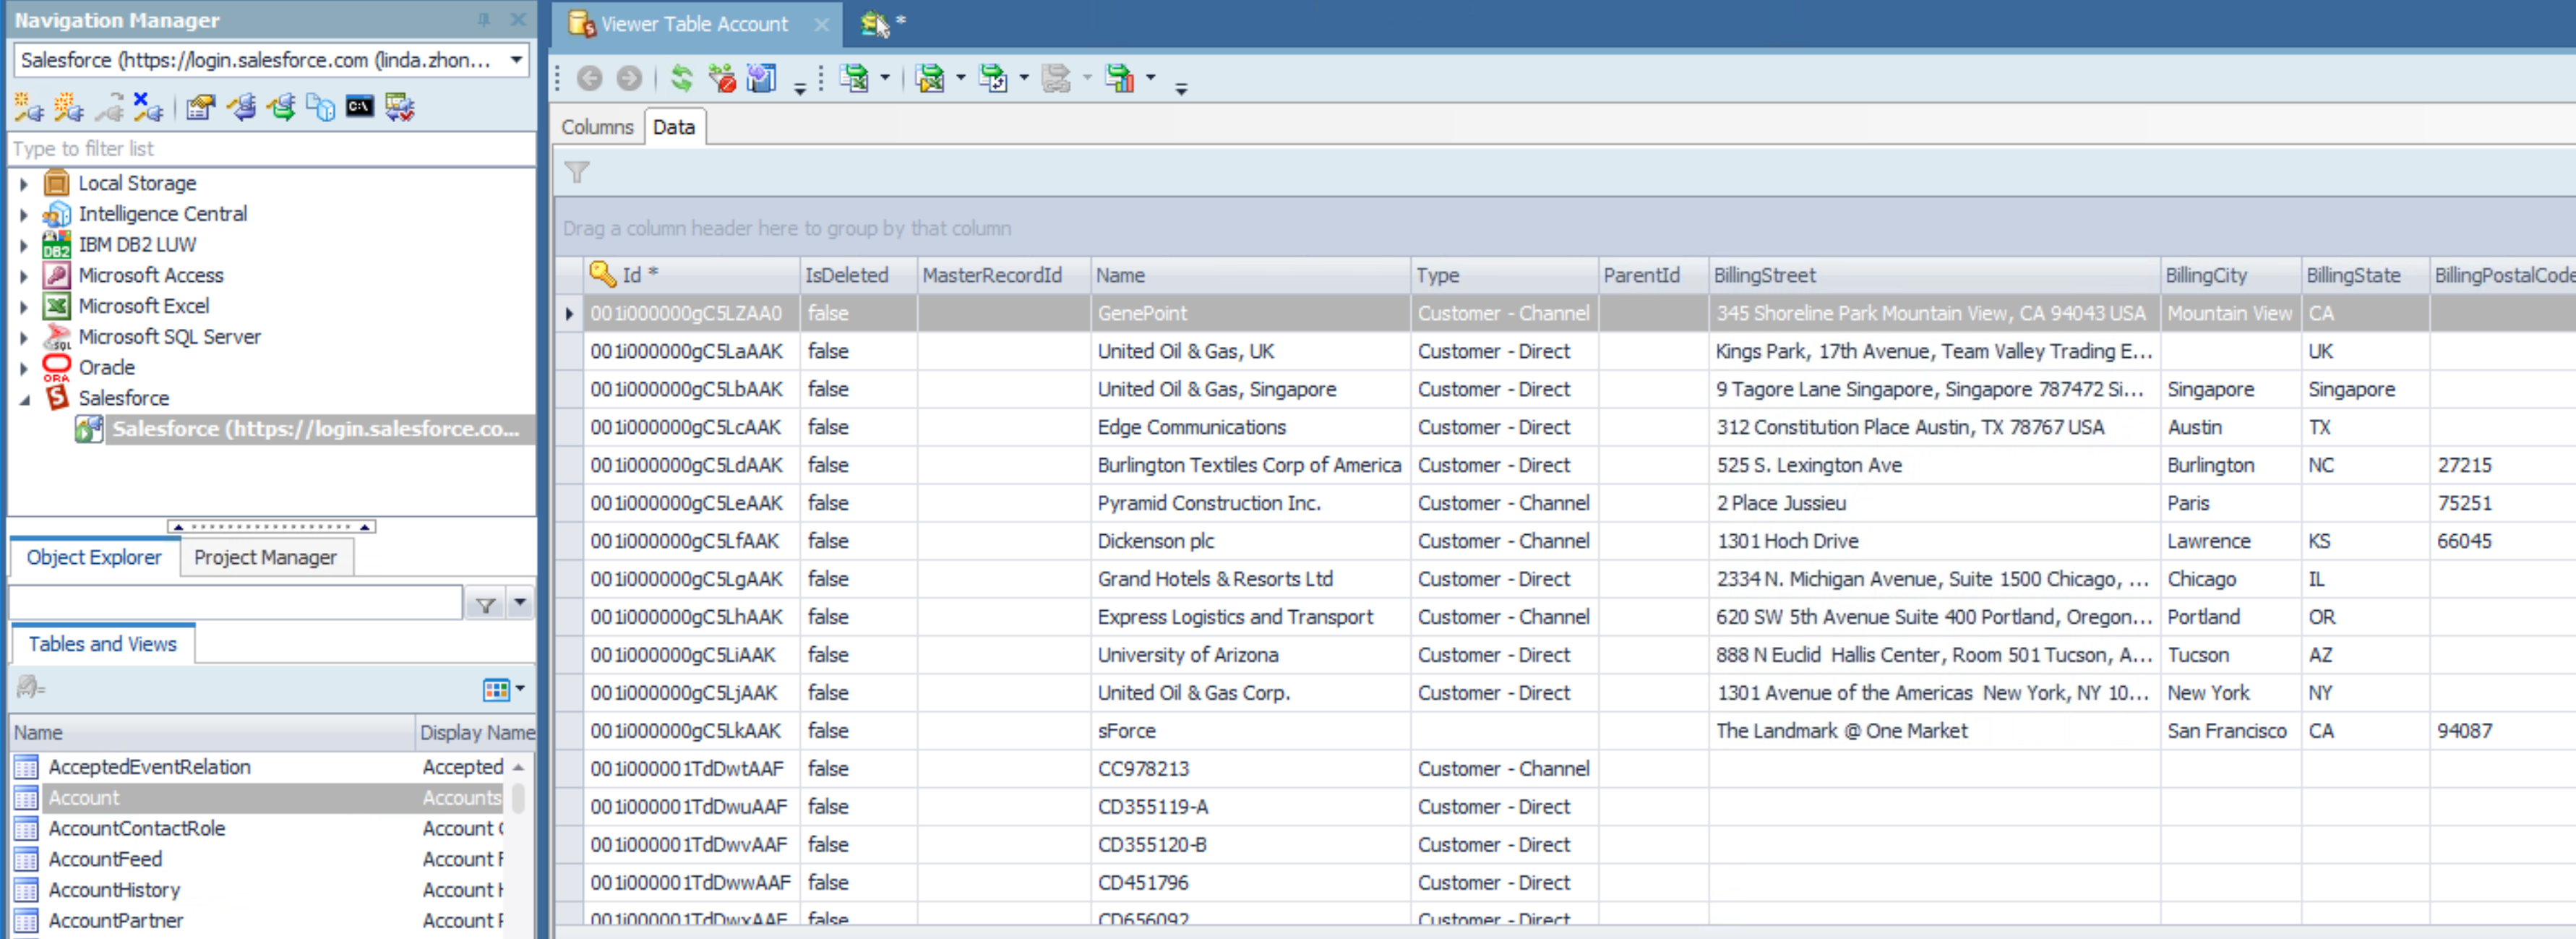
The Data tab will show you the data in this table. Right-clicking on a table will present a pop-up menu that gives you choices of what you can do with the data:
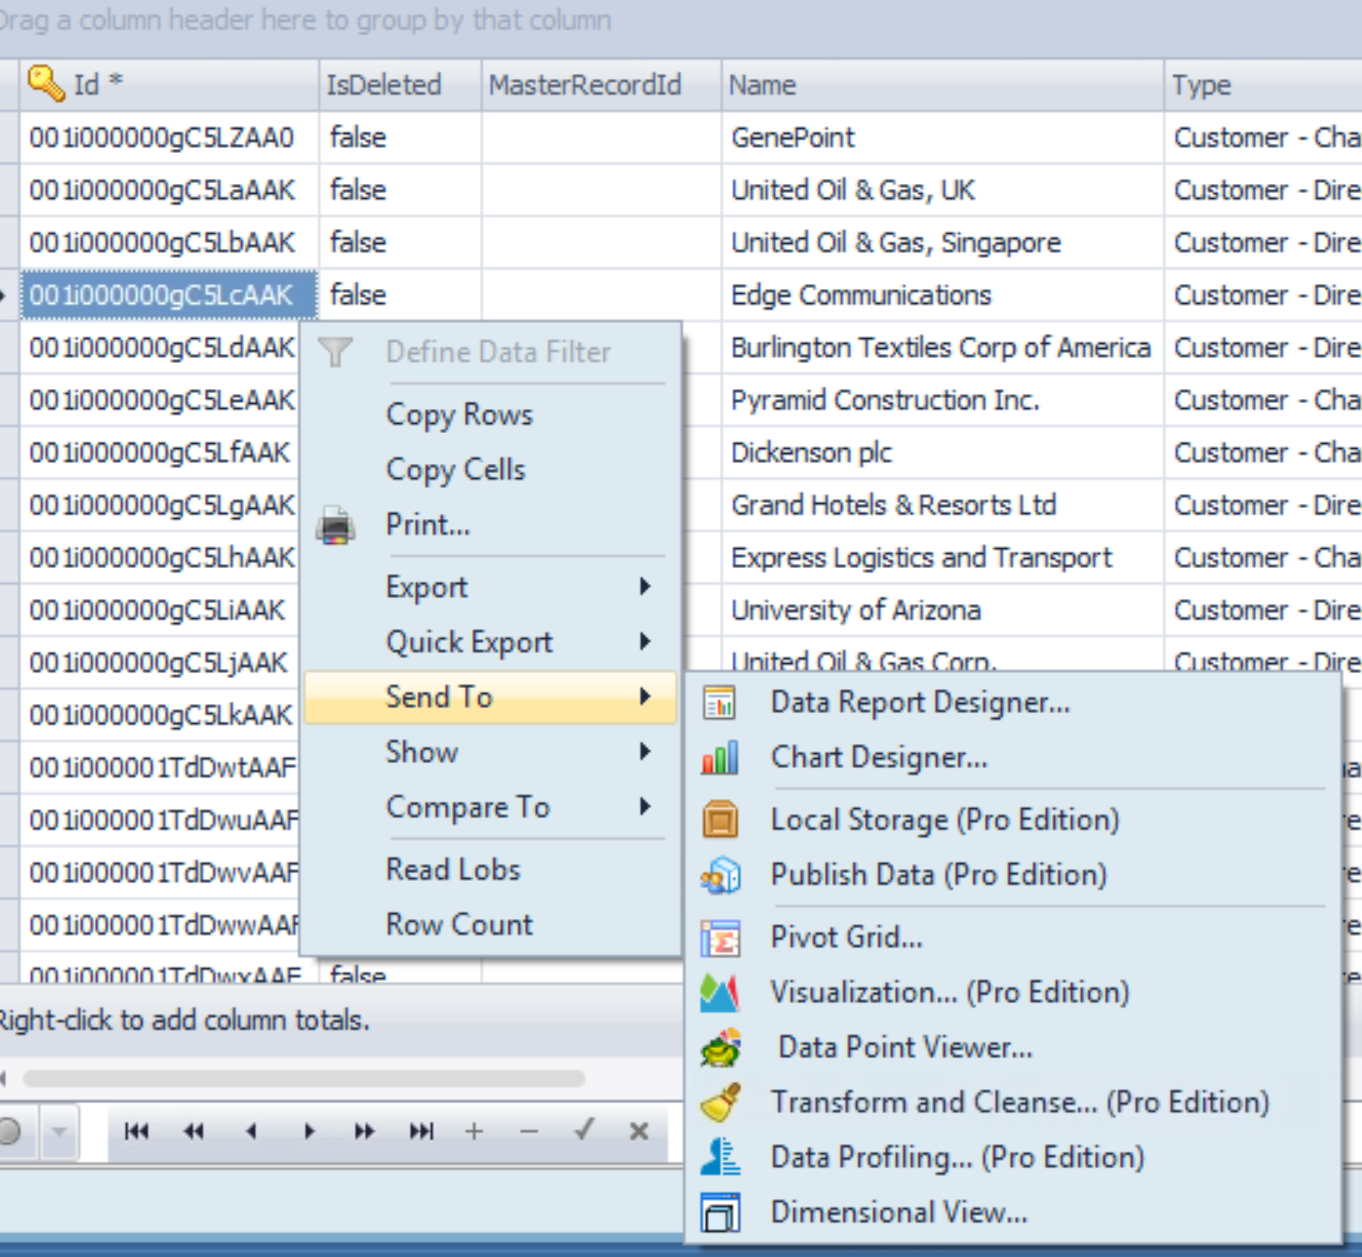
You can Export the data, compare the data, copy the data, etc.
Probably the most powerful options are under the ‘Send To’ option. From here you can design reports, save the data to ‘Local Storage’ (which allows you to work with a copy of the data offline), ‘Publish Data’ so that you can share it with others on the team, create a pivot grid, visual the data, etc.
Below is an example of data profiling:
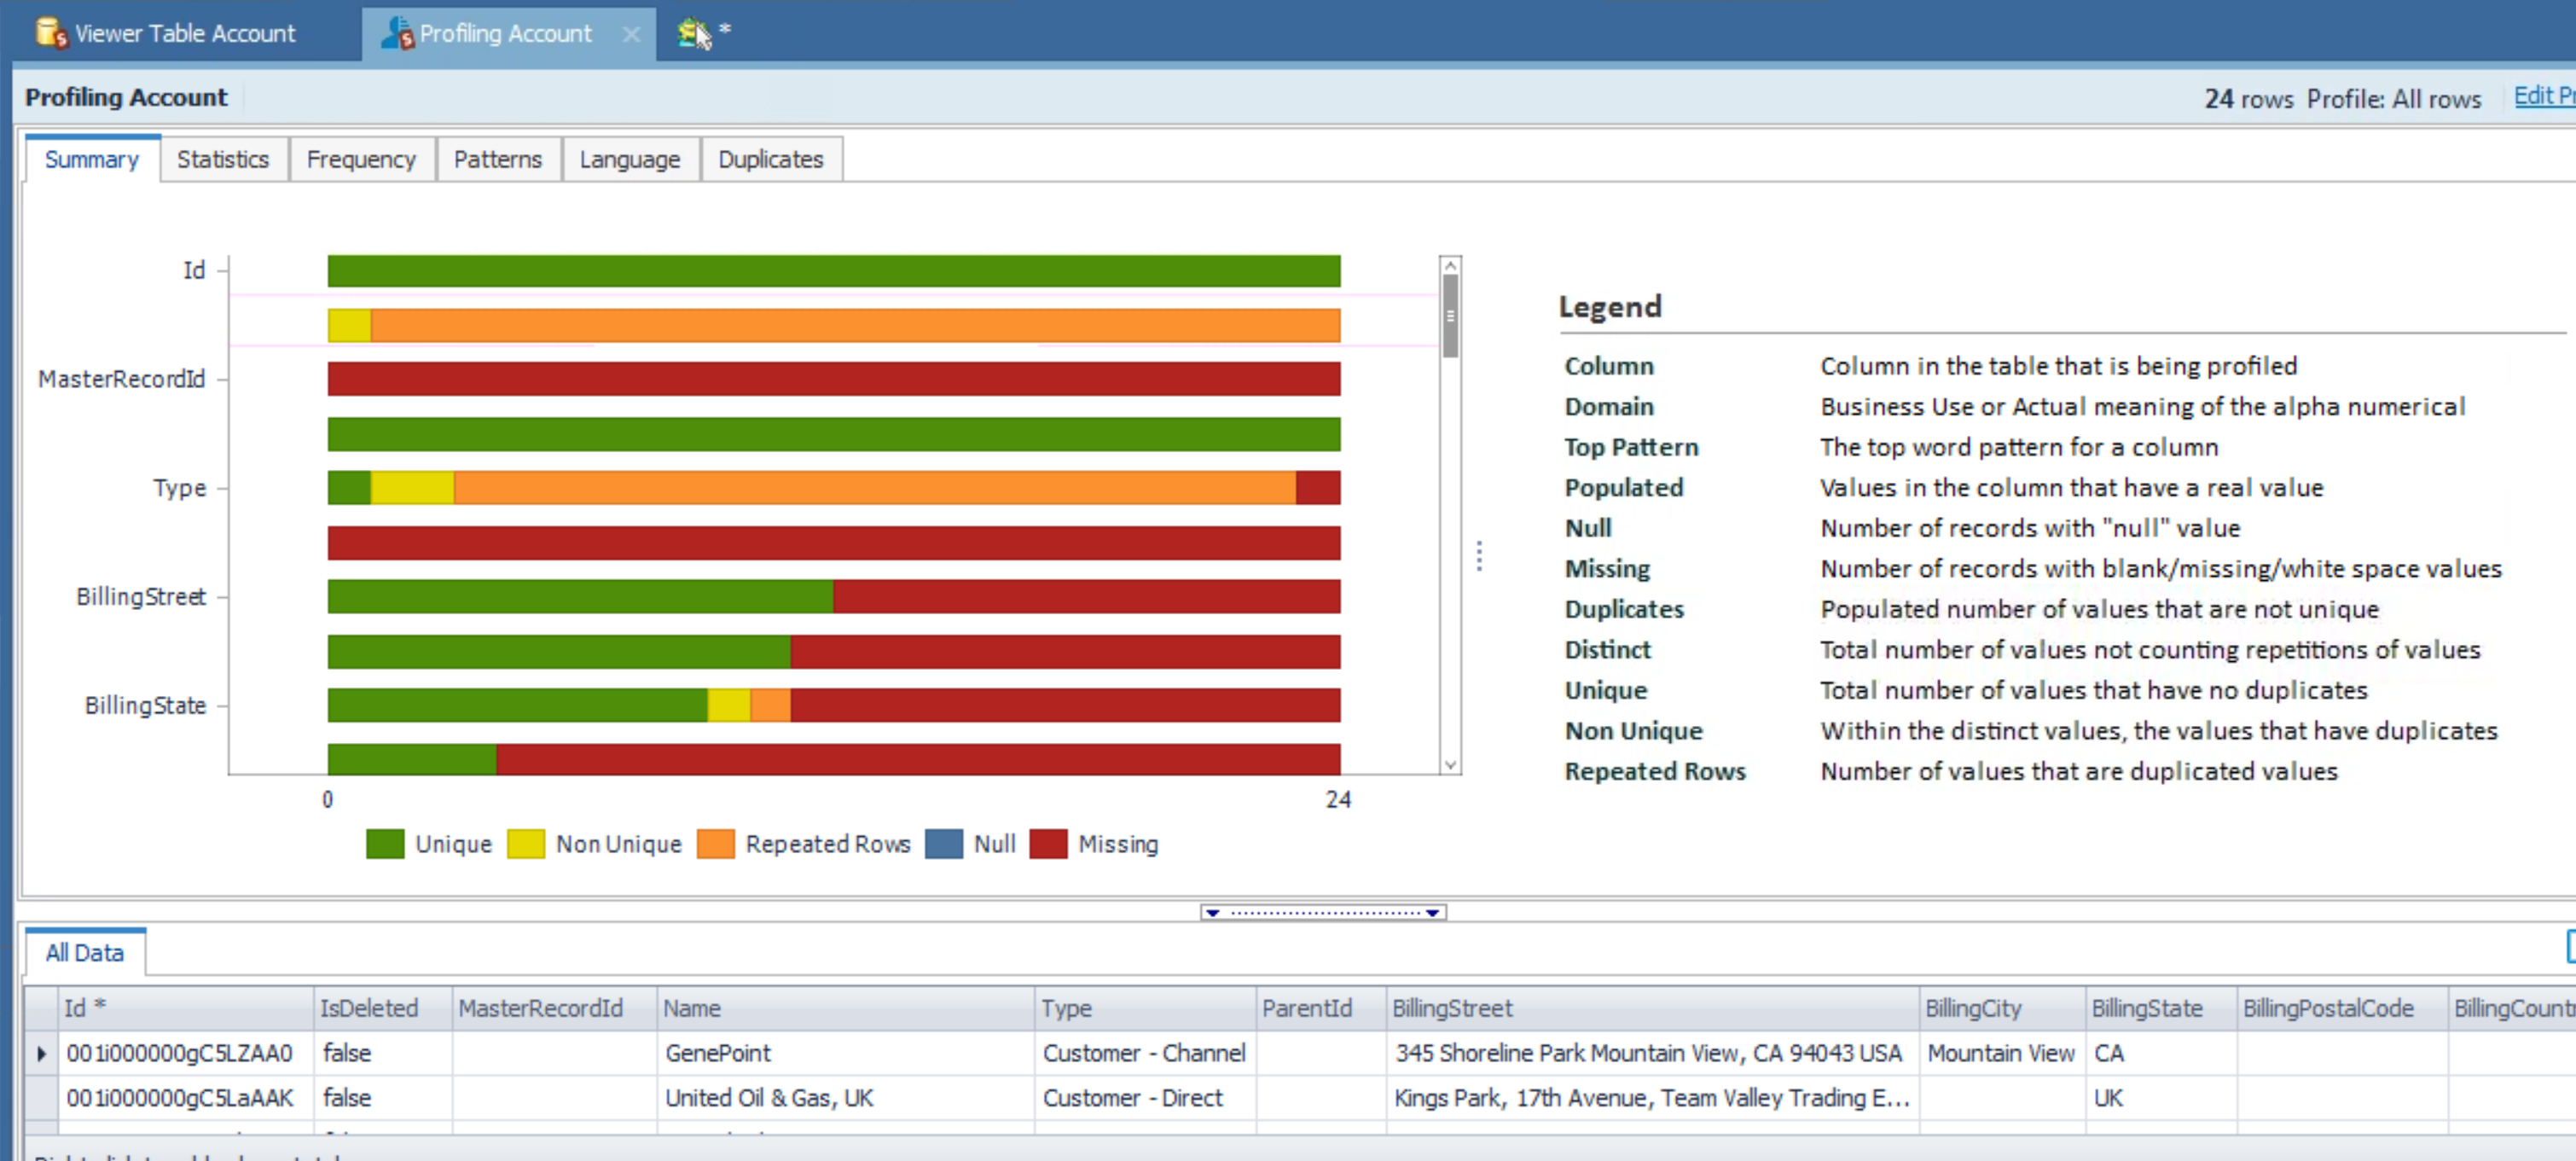
You can see there are several options/tabs for data profiling, so you can drive down into the data and get a better view of what it says.
Back to the folks I was talking to. When they saw this, they just about fell out of their chairs. They could see the value of having access to this level of detail without having to spend time writing their own reports, and then, the fact that they could share this data with others in the company by simply publishing the data was very exciting to them.
Remember, these features are not restricted to SalesForce but are available to any data source you can connect to with Toad Data Point.
If you are working with data from one or more data sources and need to do reporting and analysis of the data, then Toad Data Point is the tool for you.
You can get more information about Toad Data Point, and all of the tools in
Quest’s Toad family by visiting us at http://www.toadworld.com/products
-Mark
Start the discussion at forums.toadworld.com