
Taking the Flame out of Flame-Throwing
“She’s like a flame-thrower on legs.” With that one short sentence, Naomi had just scripted a vivid scene for my mind to visualize.
Backdrop.
Rewind life back about a year and a half. I’m about to give a demo of our Toad Data Point product (try it!) to Naomi (not her real name), a Senior Data Analyst for a large Financials organization. Before most of my demos, I usually ask a few questions to understand where customers are coming from. I often find that the depth of detail customers are willing to share seems directly proportional to the depth of pain they experience. Today, Naomi is happily sharing. Like, very happily-ever-after happily sharing.
It’s routine for Naomi to export many datasets from different places—Oracle, Sybase and mainframe DB2, among others—and import that data to what she calls her database “clipboard”. In her case, Naomi’s “clipboard” is an Oracle database that she uses as a “staging” area to prepare data for herself, or for use by other teams. That Oracle database is the one place where she knows how to perform her queries to join up the imported data. Sometimes, joins won’t work until she transforms some of the join fields to match how the data looks in the other tables. It typically takes multiple attempts to get all this right.
Once her query shenanigans are done, she often exports the blended query results from her Oracle “clipboard” to Excel, where she does sophisticated number crunching and charting. If someone else is doing the number-scrunching, Naomi has to export—yet again!—her final results into another database so that data scientists on another team can apply their statistical models. On average, Naomi has to import/export to and from the staging server two to four data sources per analysis, and on occasion combine as many as six data sets from various platforms. All these steps define the process for just one report or analysis. Naomi and team get an average of 20-30 of these assignments per week. They are not keeping up, and their backlog of requests has been growing steadily. It’s causing tension.
And… Action!
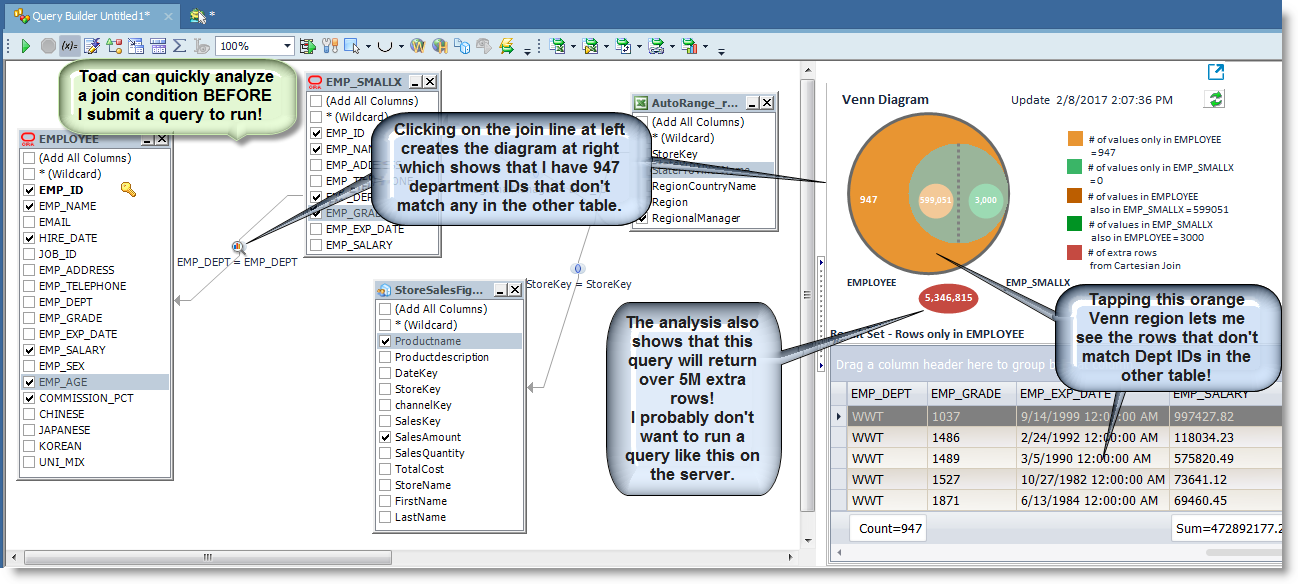
So during the demo, I quickly get to the point that I am sure Naomi will love: cross-connecting—in one shot!—three different data “sets” at their source, without any data migration or import/export. Naomi is already excited about how easily I dragged sources to build the query. Now, she’s anxious to see the data. I purposely don’t execute the query yet, however, because I want her to see a cool value proposition that we recently added to the product at the time. I would soon find out that “cool” is “life-changing” for Naomi. I tap on one of the join lines between two of my tables in the query diagram. In Toad this action analyzes the quality of the matchup between the joinable columns. A Venn diagram appears, similar to the one in the screen capture below.
Cut!
I briefly explain to Naomi how to understand the Venn diagram. But in the minute that follows, I no longer hear her excitations, and I get the funny feeling that Naomi is not on the line. I pause, and ask if she has any questions, but Naomi doesn’t respond. As a presales engineer, one tries to be ready for unusual encounters as customers play out their role on the stage of work life. But on this day, Naomi catches me off guard. My first thought is that my line is disconnected (does happen), and I ask if anyone can hear me. My sales account manager, also on the call, pipes up that he can hear me loud and clear. We can hear background office noise, so we know that Naomi’s line didn’t drop, and that she’s not put us on mute. A minute passes. Two. Did Naomi get called to a pressing meeting? Break for the bathroom? Fire drill? After about five minutes, my sales rep and I agree to end the call. And we are puzzled.
The sales rep calls me directly right away to discuss the situation. As we are speaking, he gets interrupted by another incoming call. The sales rep puts me on hold, then returns after about 15 seconds. The other caller is Naomi. Naomi wants to continue the demo. We all hop back on to the conference bridge and I share my desktop again.
Naomi explains herself. She had become so excited at seeing the cross-connection and query join analysis that she forgot to excuse herself. Now, she apologetically explains that she had gone to fetch two other coworkers to join the demo.
Take It From the Top.
After a brief introduction to her teammates, Naomi asks us to “do what you just did again” so that her co-workers can see.
I repeat the same steps to create a cross-connect query that blends three disparate data sources. I make it a point to analyze the joins before the query runs. I hear Naomi discussing this particular feature excitedly with her coworkers in the background. Then she pipes up.
“You have no idea what this means for us!” Naomi exclaims in a voice that’s trying to come back down to earth from a mountain-top experience. She goes on to explain that she and her teammates routinely get visits or calls from the performance DBA because they often launch analytical queries (including any corrective “re-takes”) that consume resources on a few of the database servers, and affect other database users/applications. But when executive management teams need their analyses and reports, “ya gotta do what ya gotta do”. There’s much gotta-do stuff happening these days, it seems.
“We get hammered by the Senior DBA all the time. It’s at the point where we’re nervous about hitting Enter to kick off a query. I tense up when I hear the DBA coming down the aisle toward our cubes. She’s like a flame-thrower on legs.”
Naomi recounts an incident just the other week where she ran a “routine” query, but didn’t specify the correct join logic. Unknowingly, her query was performing a Cartesian product involving billions of rows that caused the database to crawl. A half-hour later, the performance DBA was escorting Naomi to a meeting with Naomi’s manager and the DBA team to discuss the situation. It was an ugly scene that could have been avoided by Toad Data Point’s join analysis. That one little feature.
Long story short, Naomi’s company bought the product, and after a Tips and Tricks workshop conducted a few months later, Naomi is enamored with Toad Data Point. It’s not just because she can access multiple data sources with the product, or that she has the agility of joining these sources without time-consuming and expensive import/export steps. It’s not just the Join Analysis feature that lets her know if her join conditions are correct before she runs her queries. For Naomi, all these things come together in Toad to make her more productive.
But there’s more (there’s always more.) The backlog of requests? Much smaller. And, yes, there’s less third-degree burns from the walking flame-thrower.
Curtain Call.
Coincidentally, just a few weeks ago, I am showing the same product, Toad Data Point, to “Nathan”, a Database Technology Architect for a Fortune 50 U.S. retailer. His responsibilities in defining his company’s information management platform include recommendations about effective database query, BI, and administrative tools. They are already a Quest Software customer. The DBA/developer groups in Nate’s company use Toad flavors for Oracle, DB2, and Sybase, but the financial analysts also use these flavors of Toad to manage and move data on these databases. However, they do not have Toad Data Point.
Nate is loving the value proposition that analysts would be able to use just one Toad product to access all their disparate data sources. But when we get to the point in my demo where I analyze one of the joins in my query—that one little feature—it only takes Nate a few seconds to understand the Venn diagram without my help. At that point, Nate hollers a couple of OMGs in my ears, and I almost lose my hearing.
“Do you know what this means?!” Hmmm. Deja vú.
Turns out that Nate’s company has the same issues as Naomi’s. As an architect, Nate explains that he has a corporate view of the “churn” (his word) that plagues his company. He sees the grinding churn of bad queries that grate databases to a halt. And he sees the antagonistic churn between DBA and Developer/Analyst Teams as they engage in battle over whose conflicting objective holds sway. It’s all ironic because the efforts to get executives the info they need to make business decisions often cause slowdowns on the very systems that run the business. And that, Nate philosophizes, is why he was hired as an architect: to mitigate the negative effect of this irony on the organization by recommending the right tools.
Toad Data Point won’t solve all his challenges, Nate concludes at the end of my demo, “but it will certainly be an important part of our info management portfolio.”
Start the discussion at forums.toadworld.com