In Toad for Oracle 12.12 and prior, the Trace File Browser's "Statement Details" tab shows statements:
- In the order in which they appear in the trace file
- With recursive statements listed under parents
- With a row for each cursor, (not grouped if multiple cursors exist for the same SQL Text)
That last point is the main focus of this blog and the recent changes. Take a look at the screen shot below, and notice that the same statement is repeated several times.
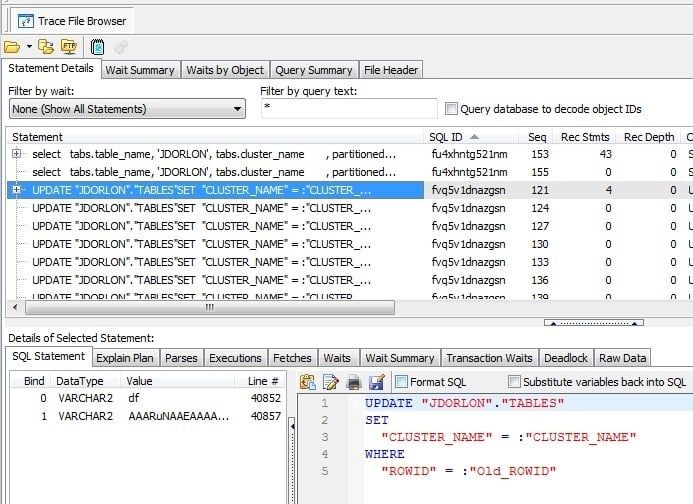
The current display is nice in that, going from top down, you can see what happened, in the order it happened, in a session. But if these identical statements weren't right next to each other, you might not notice that the statement was repeated. Sometimes repeated statements will appear as the same cursor executed multiple times and sometimes they will be separate cursors, each executed one time. It would be nice to be able to see a summary of these identical statements, regardless of if they were the same cursor or separate cursors. So that's what's done for Toad 13 – beginning with 13.0.0.7.
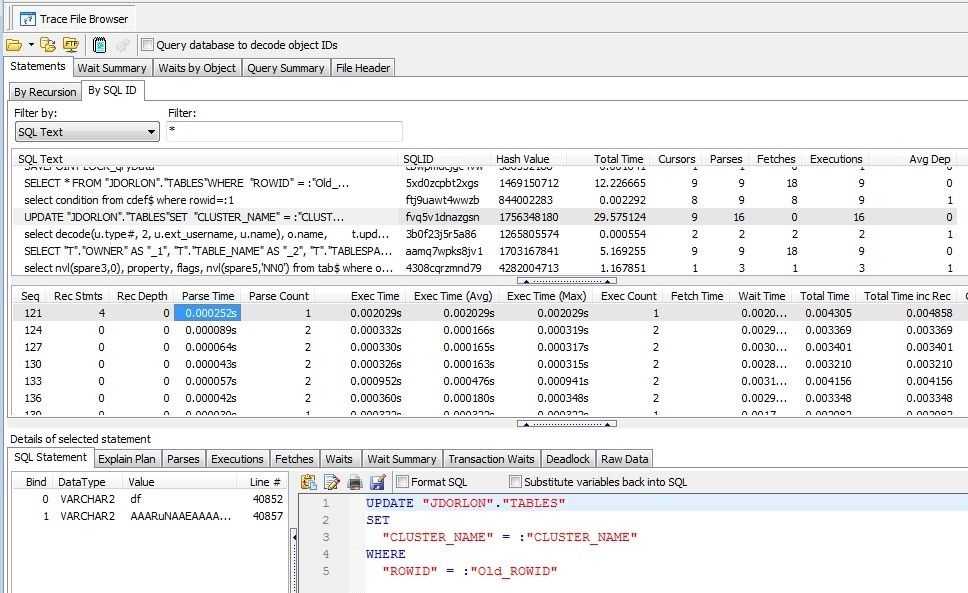
In Toad 13, I've renamed "Statement Details" tab is to just "Statements", and I broke it out into two sub-tabs. The first tab is labeled "By Recursion". The "By Recursion" tab is what you've always seen in the Trace File Browser. The second tab "By SQL ID", adds an additional section at the top which summarizes each unique SQL Statement in the trace file. There are just a few columns in the top section. They are:
- SQL Text – the text of the sql statement (duh)
- SQL ID – the SQLID (a hash that Oracle assigns to each statement, starting in Oracle 11)
- Hash Value – (A different hash that Oracle assigns to each statement, but this one existed in 10gR2 and prior)
- Total Time – the total time spent on all cursors and recursion of this statement
- Cursors – the number of cursors for this statement
- Parses – the total number of parses over all of this statement's cursors
- Fetches – the total number of fetches over all of this statement's cursors
- Executions – the total number of executions over all of this statement's cursors
- Avg Dep – the average recursive depth of this statement's cursors (it's helpful to sort by this column if you just care about top-level statements).
Of course, you can click the column header to sort by any of these columns.
Once you select a statement, the cursors for that statement are shown in the middle section (which has the same columns as the listing of the "By Recursion" tab, the same columns that you are used to in the Trace File Browser, except with the "SQL Text" column no longer visible by default, since it is just a repeat of whatever you've selected on top. The bottom section is what you are used to seeing at the bottom of Trace File Browser (SQL Statement, Explain Plan, Parses, Executions etc)
OK, enough talk. Here's the same file opened in the new Trace File Browser, with the same statement selected. See how it's listed only once in the top? The numbers you see in that row are totals over all of that statement's cursors. Each cursor for that statement is in the middle section, and whatever cursor you select in the middle is detailed in the bottom.
So it's not a huge change in terms of the look of the Trace File Browser, but hopefully it will give you a better understanding of your trace files.
Some other minor changes:
- I moved the "Query database to decode object ID's" to the top, so you don't have to come back to the Statements tab to turn that on.
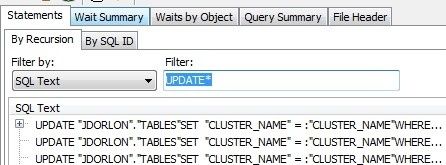
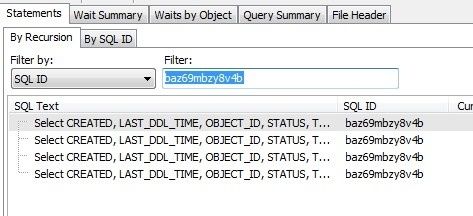
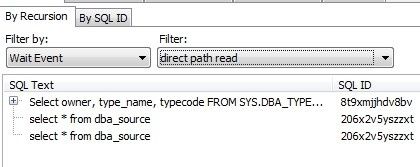
- I added "SQL ID" as a filter option, and changed the filter controls so I didn't have to keep adding controls every time we add a new filter possibility. So now you can specify what to filter by (SQL Text, SQL ID, or Wait Event) and the filter value. Screenshots below.
That's it for now. Let me know what you think!
Start the discussion at forums.toadworld.com