Hi!
This article will cover some useful tips in finding the root cause of your application performance issues. Some of these suggestions might be useful to enhance your help-desk solutions; others might be useful in determining whether the performance issue is the computing environment or the Oracle RDBMS. You might think this is a ‘reactive’ approach but I feel if you monitor and collect the right information, you can solve most application performance issues quickly and easily.
My goal here is to enlighten you with a systematic approach to problem solution, not to make network administrators out of us all.
Have a monitoring solution in place! Oracle Enterprise Manager is easy to configure and alert on a variety of database and operating system issues. This tool also tracks history so when you go into diagnostics mode, there is a host of information available that will aid you in both the random type issues and the repeating type issues.
If you don’t have the diagnostics pack purchased, at least setup and run Stats Pack on your production application databases. Stats Pack can be helpful at finding the problem sql, not as gracefully as Enterprise Manager but can still shed some useful information.
Where do I start tuning? The rest of this article is useful information on what kind of information will be useful for various kinds of application issues I’ve encountered over the years.
At a very high level, you have to follow these steps: collect and analyze the symptoms, determine the problem, investigate solutions including server and database parameters, make changes, and monitor to make sure you really solved the problem.
Analyze the Symptoms.
The toughest problems to solve are those that happen randomly, or rather, that appear to happen randomly. I’ve had a few of these over the years.
Does the problem happen at a certain time of the day? These kinds of issues are easy to monitor and generally solve. They are easy to solve because you can monitor/run scripts/collect additional information (such as SQL Trace perhaps) in and around this problematic time period.
***True Story***: Oracle8 and UNIX… while working at Platinum Technology, we had a monitoring sales opportunity and Platinum sent in their best technicians (i.e., me). The problem would occur about 3 pm each day, as the shift of people changed. This also was a time of day when they started running some batch update jobs against their Oracle database. We were told they would buy our software if we could show what was causing the issue. The systems group was convinced we were wasting our time. They had used Flame and other UNIX monitoring and could not find the issue.
ServerVision and DB Vision took less than an hour to install. We arrived in the morning and installed the monitoring software. About 2 pm, some of the batch jobs started. Some alarms started to go off with ServerVision…the UNIX box had run out of physical memory.
Around 2:30 pm, right about on time, the Oracle app problem showed up… Sometimes people could do work and sometimes they couldn’t do anything for about a minute…the performance issue would be off and on like this for hours… ServerVision alarmed of the processes that were being swapped. The Oracle Listener was being swapped out!
This was the problem. When the listener swapped out of memory, the users couldn’t communicate with the Oracle RDBMS…and the database was able to continue doing its regular processing, so no alerts there. The problem was which process was being swapped out. Usually the Oracle background processes are locked in memory; I did not review WHY the listener was swapping but it was indeed swapping and this was indeed their problem at 2:30 in the afternoon.
We won. I discovered the problem. I don’t remember if we sold them the software but was an interesting problem. The UNIX server did not have enough real memory to run both the apps used during the day and the apps used when the next shift of employees came in. You can free up memory from Oracle and other databases perhaps, juggling configuration parameters, or simply purchase more real memory!
Can you get the problem to recur? These kinds of problems can be rather easy to figure out. You now have Automated Workload Repository (if licensed to use it) and can always start with StatsPack…tracing wait events back to problem SQL (click here to see my blog on finding problem SQL). Running a SQL Trace is always good if you can get the problem to occur in a test environment or at a regular time of the day (after ruling out hardware/computing environment issues).
SQL Trace is rather intrusive on the database environment and can generate a large trace file quickly…that may be difficult to find the problem SQL if you cannot limit the trace to the time period of the performance problem.
Is the problem affecting only a group of users, only a particular application, or everyone on the computing environment? This is actually a good place to start. The answer here points to maybe a network problem in part of your building, a locking/contention issue in your application, or quite possibly the above-mentioned ‘out of memory’ type issues on the computing environment hosting your database.
Let’s ask some more questions. How are the users being affected? Is everyone on the same host computer having the same issue? Is the issue just to the users of a particular Oracle instance? The solution to the first question here is found at the server level, the second question can be discovered using database monitoring/tracing techniques.
Is the issue only certain applications? One of my favorite questions is,“Have you recently installed some new software?” Sometimes the new software steps on the older software. Sometimes a new release of application software wasn’t thoroughly tested and the part not tested is now showing up as a problem. If the problem is only showing up on certain transactions or certain tables, then you could quite possibly have a locking or contention issue. I use Toad Session Viewer to monitor for locking and contention. It has tabs that shows the SQL waiting for resources and most importantly, it shows the SQL that is blocking others. Tune these SQL statements. It’s amazing how just getting some SQL to run a bit faster solves a whole bunch of contention issues.
On, to the host computer and network issues!
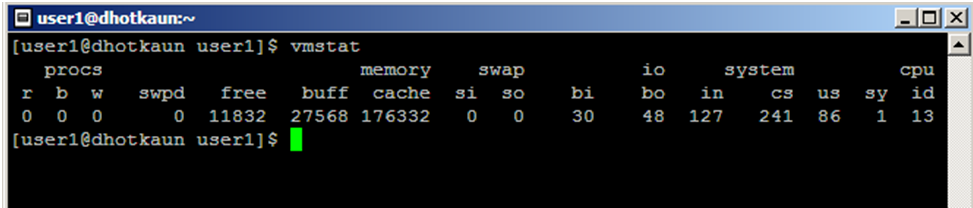
VMStat Data
I like to start with vmstat on UNIX/Linux. This app shows useful information about the hardware and how well UNIX/Linux is handling the processing load. Basically, how busy is the computing system. I pay particular attention to the SWAP area. If the computer is swapping, you really do have to solve this first before you can fix anything else. A swapping system will do unpredictable things, as in the ‘true story’ I mentioned above. You either add more memory or reduce the Oracle footprint. I like this script in Oracle. It shows the size of the library cache and how much of it is being actively used. This used to be way small, but starting in Oracle10, it has been initially set up to be way too big. The free memory shown by this script is just wasted. It is allocated to the library cache but is not available to be used by anything else. Ask me for the Share_Pool_Info.sql script.
SELECT to_number(p.value) psize, s.bytes fspace, (s.bytes/p.value) * 100 pfree
FROM v$parameter p, v$sgastat s
WHERE p.name = 'shared_pool_size'
AND   s.name = 'free memory'
/
Shared Pool Size          Free Space     % Free
----------------          ------------   ------
      11,534,336          10,077,648     87
This script shows the Shared pool is 11GB in size and over 10GB is still available.
***True Story***: I was onsite helping to diagnose a big ‘buffer busy wait’ wait event issue. This is caused when there isn’t room in the buffer cache for additional database blocks being requested. The requesting process sits and waits until space becomes available. We ran the above script and discovered that they had a 2GB library cache but were only using 25% of it. I suggested they take 1GB from this area and assign it to the buffer cache. 1GB of additional buffer cache is quite a bit and I was willing to bet that the ‘buffer busy waits’ would simply go away. They had to schedule down time/recycle type for their databases far in advance (changing the parameter settings in Oracle9 required a restart of the database). I’m not sure when they were able to resolve this particular issue and I’m also not sure if they reconfigured Oracle some to free memory and give it to the buffer cache, or if they were able to purchase more real memory and assign the additional space to the buffer cache.
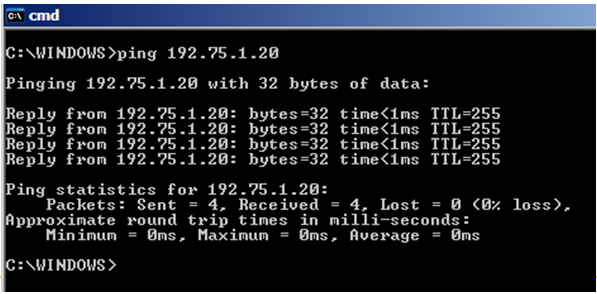
Ping Information
The application Ping can be your friend if just one user is having a general performance issue. Here, I ping the IP address of the server from the user’s work station. I look for the number of lost packets. I have seen broken connection cords hanging out of the wall. I also have experienced laptop network cards that don’t quit working but don’t work very well. Both can cause lost packets.
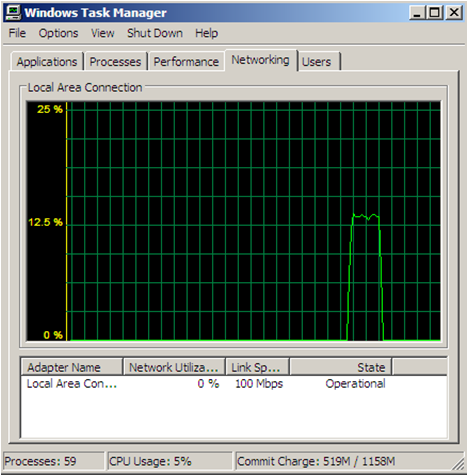
Network Activity
Using your local network monitor, you can see how busy your segment of the LAN is. If everyone is doing FTP-type downloads (downloading lots of items from the Internet perhaps), be aware that each FTP session takes 20% of the network. Get three of these going at the same time and everyone on that segment of the company LAN will be slow.
*** True Story *** A network administrator was about to upgrade the slow network LAN. He looked to see just what the traffic was and it was 60+ PCs downloading a 1MB jpeg about every minute. Turns out, everyone had the Weather Bug (a Windows app from a local TV station) running! He removed all the Weather Bugs and didn’t need the network upgrade.
One last item that might be helpful, maybe you can incorporate into your helpdesk offerings. The call “I can’t get connected to my Oracle database”. This typically is a result of the connect information not being in the SQL*Net configuration file TNSNAMES.ORA. When you install Oracle software, it has this nasty habit of wanting a new ‘Oracle Home’. The fine folks at Oracle have never really solved this. If this work station just had an Oracle tools upgrade or some new Oracle tool was added, check the TNSNAMES.ora file location. This is simple by running TNSPING from that workstation.
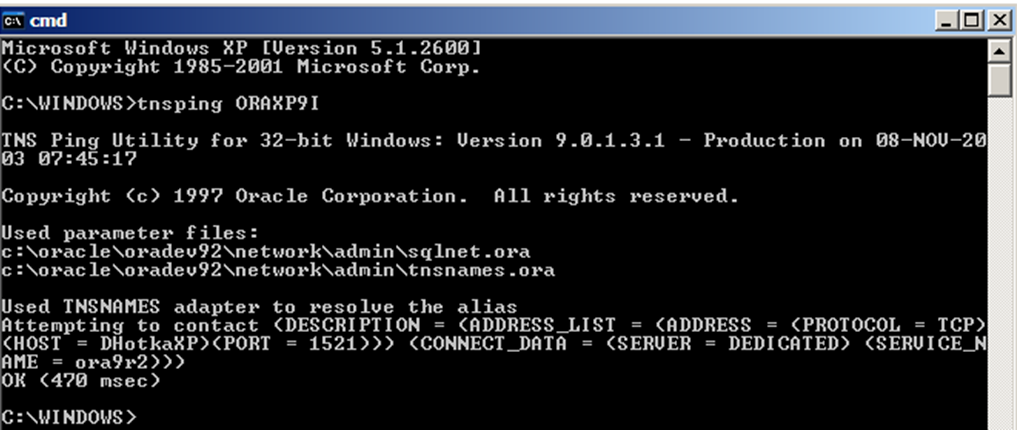
TNSPing Information
Notice the area in the middle: Used parameter files. Make sure this is pointing the correct SQL*Net files.
There are two ways to fix this but one is far better than the other. In UNIX/Linux, set the environment variable TNS_ADMIN to the path to these files. In Windows, this is an environment setting. This is the best way to solve this problem. The other way is to copy these two SQL*Net files to ALL of your Oracle Home paths…not an elegant solution, but it, too, works.
We scratched the surface in this article on finding performance problems. To easily solve most issues, you do need a monitoring system that catches both database and server events. Monitoring is the key to proactive database management and to quickly solve performance issues. My tips and experiences should give the novice a jump start on problem resolution and maybe there are some useful tips here for the experts at your site.
Dan Hotka
Author/Instructor/Oracle Expert
Start the discussion at forums.toadworld.com