Proactive database management is based on monitoring a database and taking pre-emptive measures to keep the database running at the required level of performance. AWS (Amazon Web Services) RDS (relational database service) is a reliable and scalable managed database service for six commonly used databases: Oracle, MySQL, Aurora, PostgreSQL, SQL Server, and MariaDB. Being a managed AWS service, RDS databases are monitored using the integrated AWS CloudWatch service, a monitoring service for cloud resources and applications on AWS that collects and monitors metrics and log files, and provides alarms to enable a user to take preventive measures. CloudWatch Dashboard includes graphs for selected metrics, and Events for a monitored resource or service.
A database in RDS provides the following proactive database management features:
- CloudWatch RDS Metrics
- CloudWatch Logs
- CloudWatch Alarms
- RDS Events Notification
- RDS Database Log files
- RDS Dashboard Monitoring
The various proactive database management features for Oracle database on RDS are shown in Figure1.
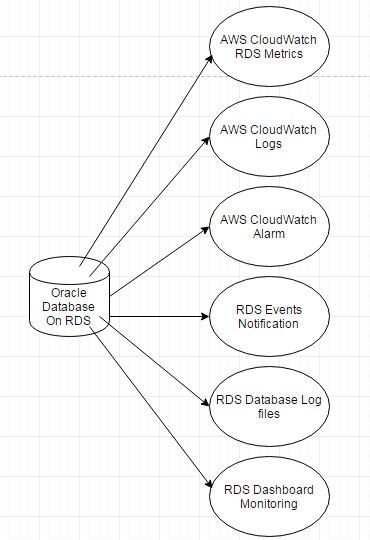
Figure 1. Proactive Database Management Features for a Database in RDS
This article has the following sections:
- Setting the Environment
- Creating a Role for Enhanced Monitoring
- Launching Oracle Database on AWS RDS
- Using RDS Dashboard Monitoring
- Monitoring CloudWatch RDS Metrics
- Monitoring CloudWatch Logs
- Adding a CloudWatch Alarm
- Configuring RDS Events Notification
- Accessing RDS Database Log files
- Monitoring RDS
Setting the Environment
The only prerequisite for using Oracle Database on RDS and the concomitant proactive features is an AWS account, which may be created at https://aws.amazon.com/resources/create-account/, if you don’t already have one.
Creating a Role for Enhanced Monitoring
The enhanced monitoring feature in RDS requires a special role, which we shall create next. Select the IAM service in the AWS Dashboard or open the URL https://console.aws.amazon.com/iam in a web browser. Select Roles and click on Create New Role to create a role for RDS Enhanced Monitoring, as shown in Figure 2.
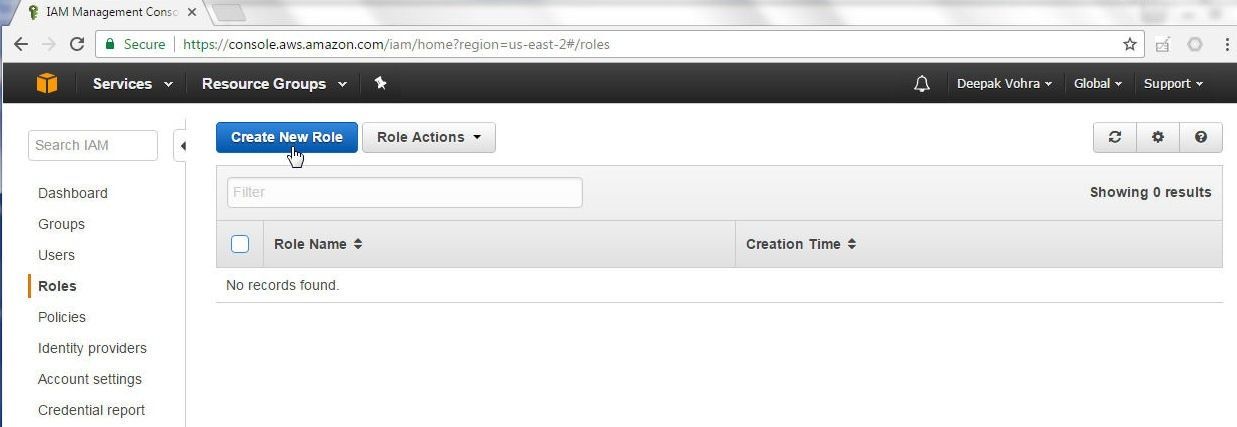
Figure 2. IAM>Roles>Create Role
In the Set Role Name page specify a Role Name (rds) as shown in Figure 3 and click on Next step.
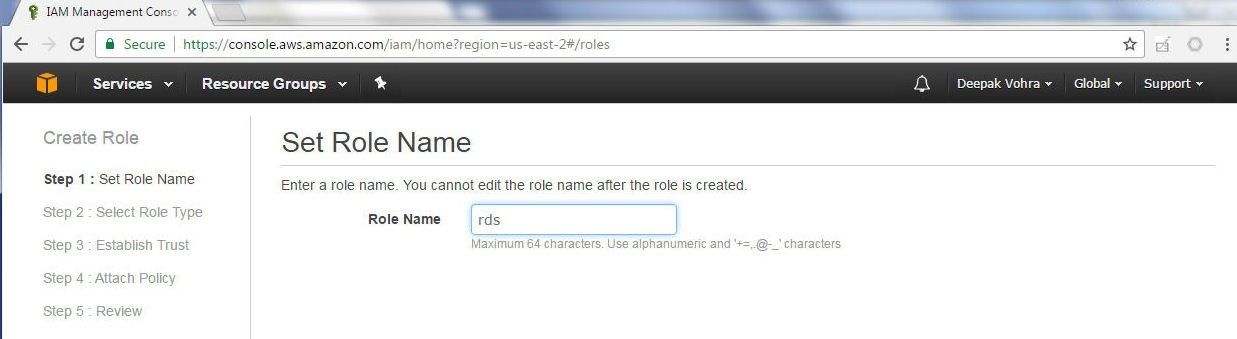
Figure 3. Specifying a Role Name
In Select Role Type click on Select the AWS Service Roles>Amazon RDS Role for Enhanced Monitoring as shown in Figure 4.
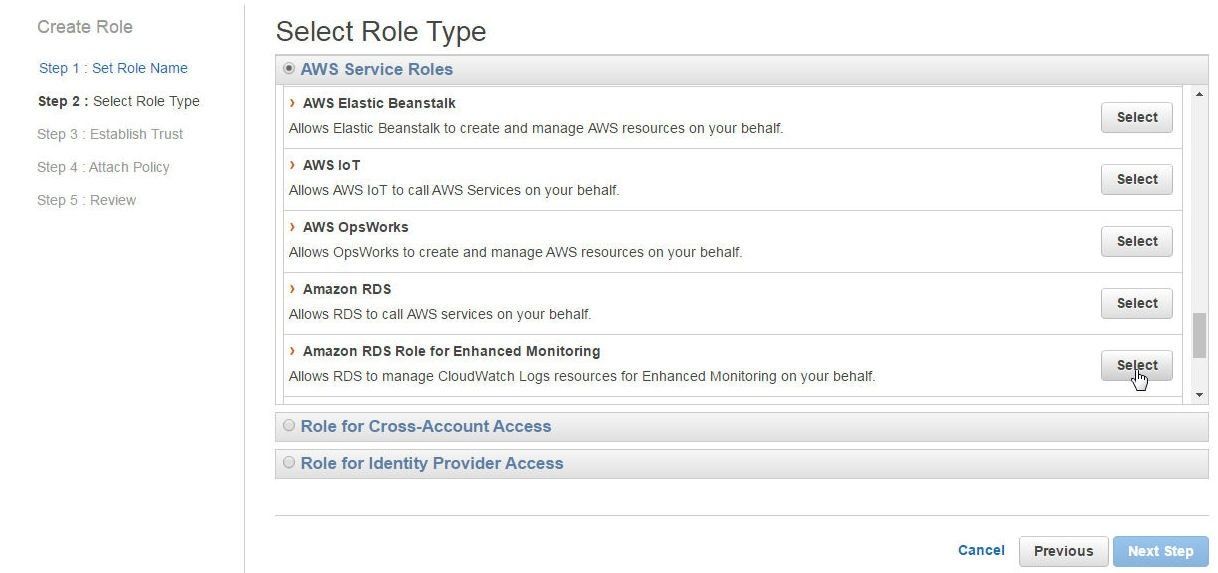
Figure 4. Selecting Amazon RDS Role for Enhanced Monitoring
In Attach Policy select the AmazonRDSEnhancedMonitoring policy as shown in Figure 5 and click on Next step.
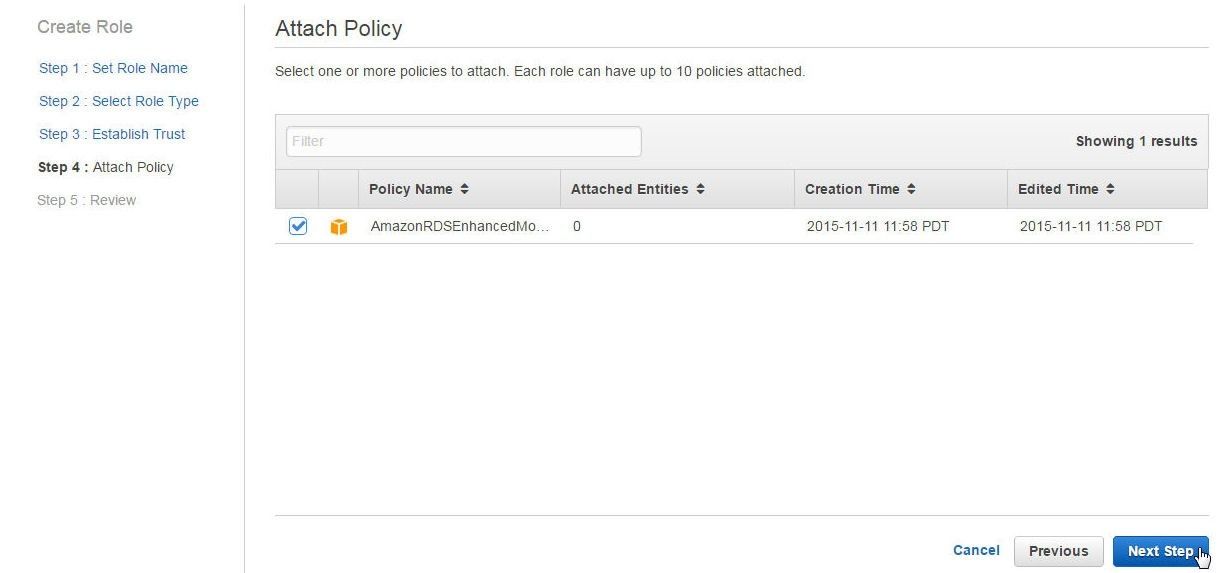
Figure 5. Selecting a policy for the Role
In Review click on Create Role to create the role as shown in Figure 6.
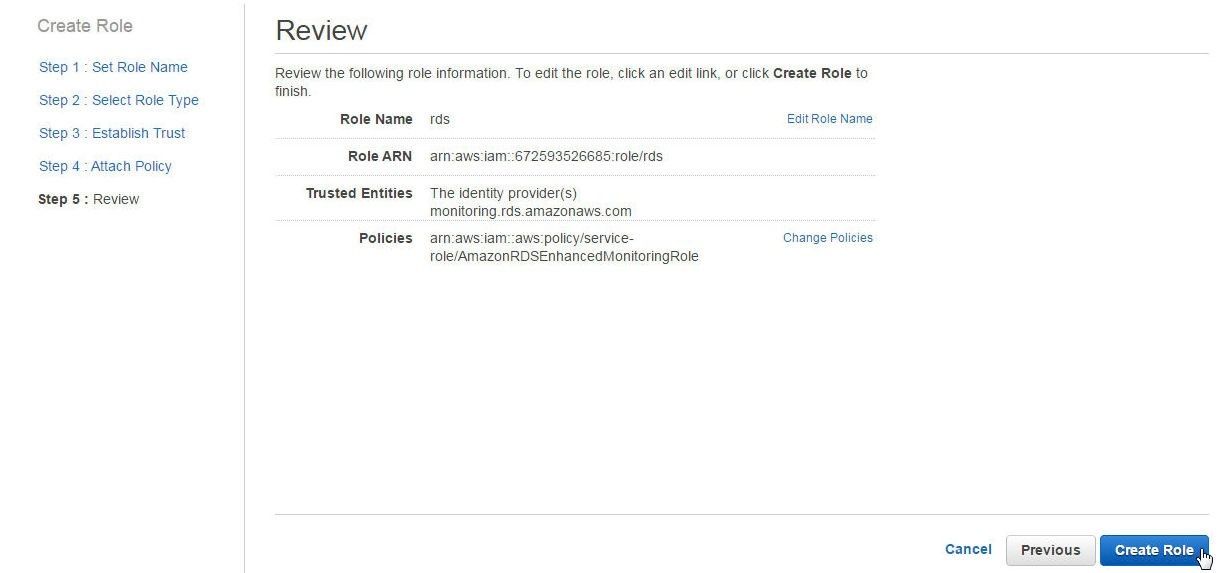
Figure 6. Creating a Role
A new role (rds) for RDS Enhanced Monitoring gets created, as shown in Figure 7.
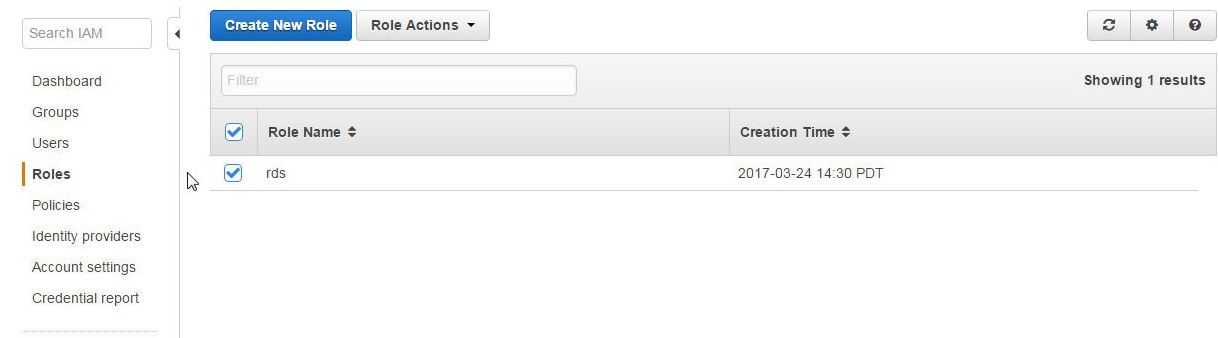
Figure 7. ADS Enhanced Monitoring Role
Launching Oracle Database on AWS RDS
For most of the proactive management features nothing special or extra needs to be configured and the RDS database automatically sends metrics and logs to CloudWatch. To create an Oracle database managed service on RDS select the RDS service in AWS Dashboard. Click on Get Started Now as shown in Figure 8.
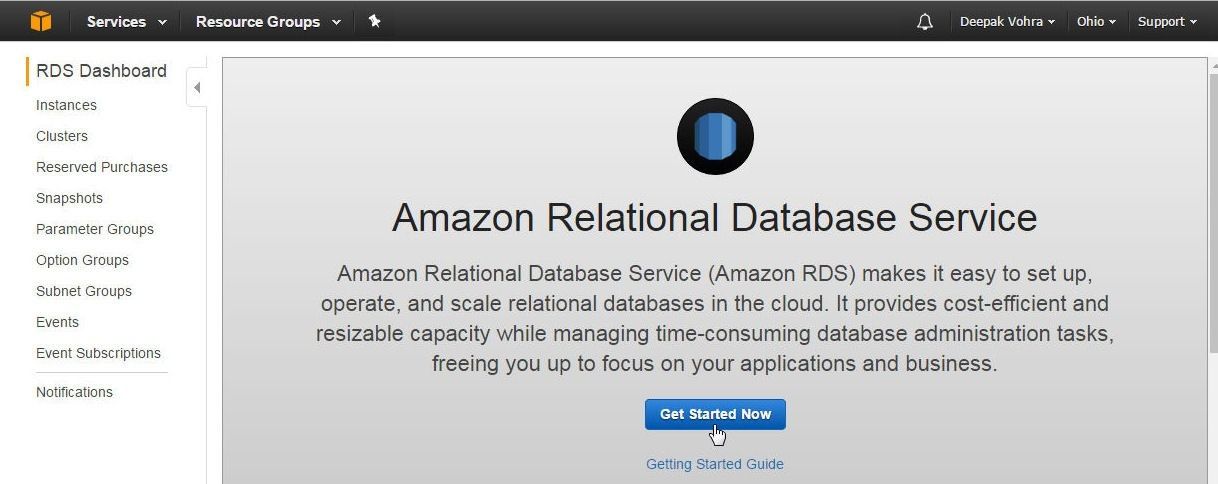
Figure 8. RDS>Get Started Now
In Select Engine select the Oracle EE engine as shown in Figure 9.
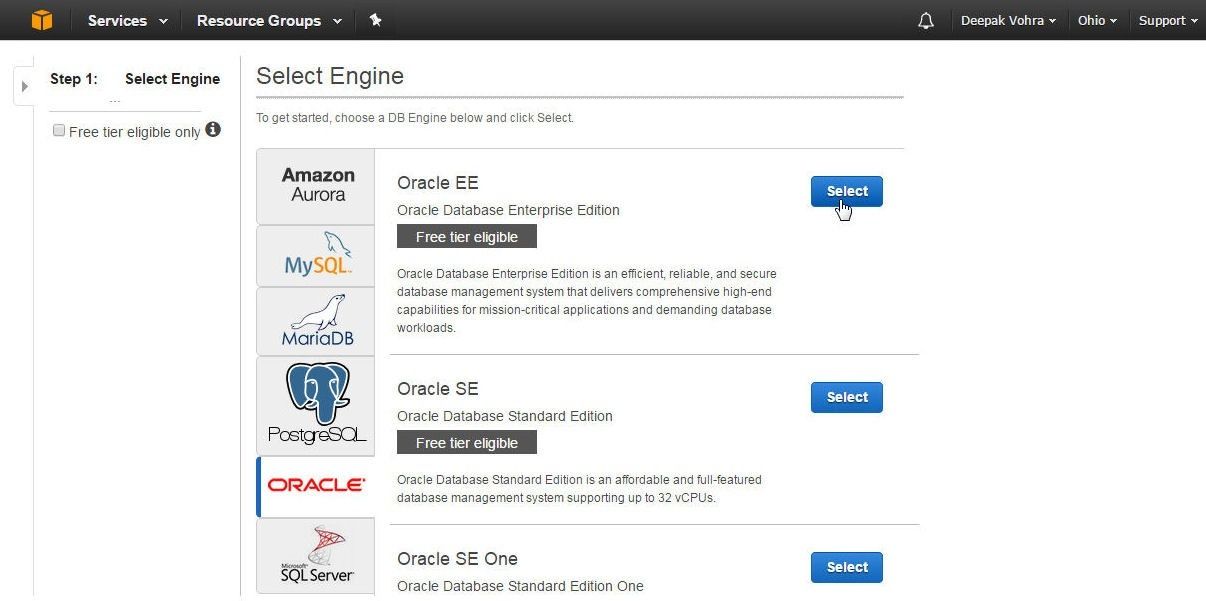
Figure 9. Selecting the Oracle EE engine
In "Do you plan to use this database for production purposes?" select one of the options: Production or Dev/Test; Dev/Test is selected for this article, as shown in Figure 10. Click on Next step.
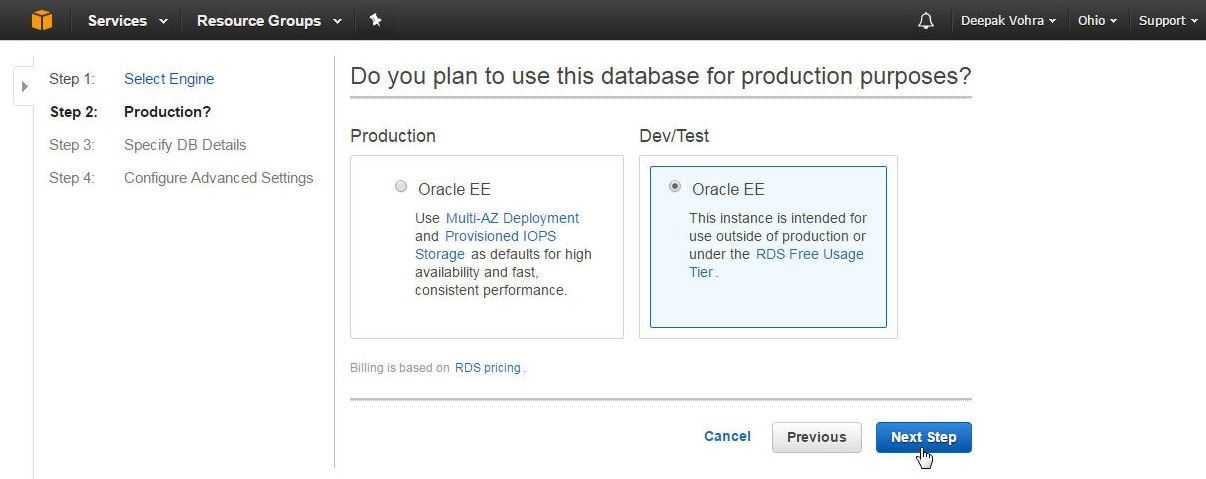
Figure 10. Selecting Dev/Test environment
In Specify DB Details, the DB Engine name is specified by default as oracle-ee. Select the default settings for License Model (bring-your-own-license), DB Engine Version (Oracle 12.1.0.2), DB Instance Class, Multi-AZ Deployment (available only in Production environment), Storage Type (General Purpose SSD), and Allocated Storage (10GB), as shown in Figure 11.
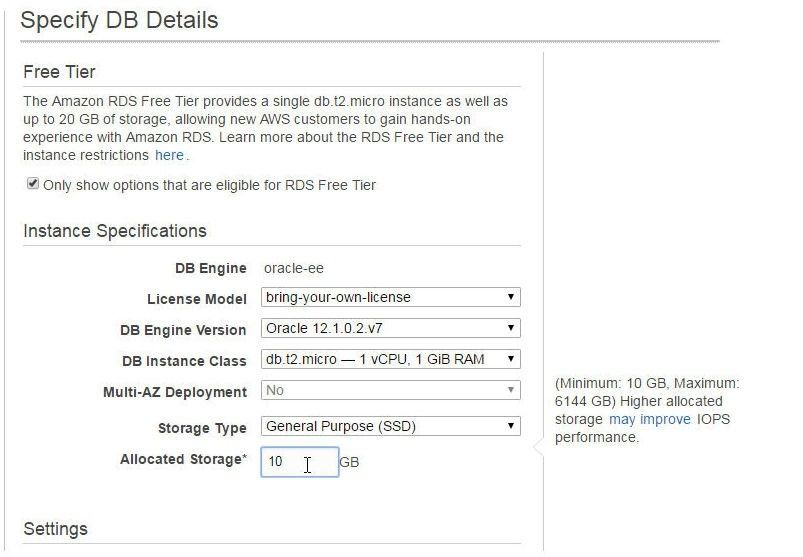
Figure 11. Specifying DB Details
Scroll for Settings and specify a DB Instance Identifier (orcl), which must be unique for all DB instances in an AWS account in an AWS Region. The DB instance identifier is case insensitive and stored as all lower case. Specify a Master Username and Master Password including Confirm Password and click on Next step as shown in Figure 12.
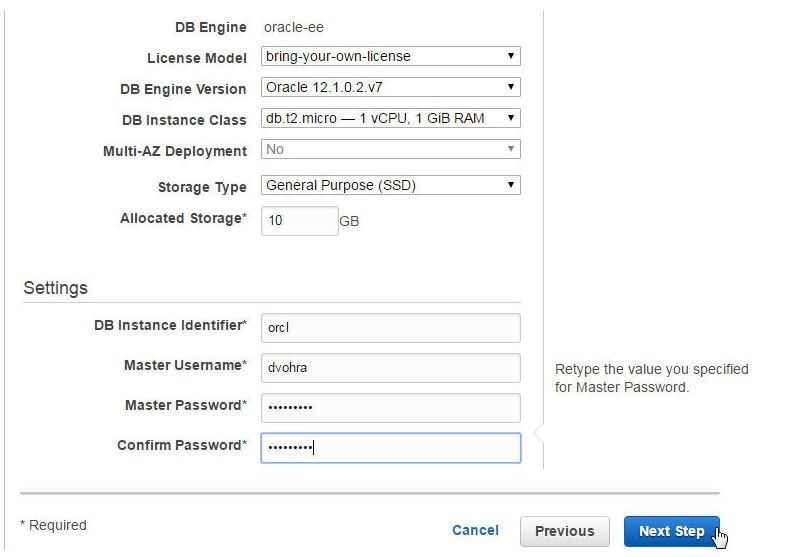
Figure 12. Specifying DB Instance settings
In Configure Advanced Settings (Figure 13) the VPC defines the Virtual Private Cloud for the virtual networking environment for the DB instance. Only VPCs with a DB Subnet are listed. Select a VPC. Select a Subnet Group. The DB Subnet group defines which subnets and IP ranges the DB instance may use in the VPC. Select Yes or No in Publicly Accessible. Selecting Yes makes RDS assign a public IP Address to the DB instance and one or more Security Groups must also be selected to configure which EC2 instances and devices may connect to the DB instance. Select an Availability Zone and select the option to create a new Security Group. In Database Options specify a Database Name (ORCL) and Database Port (1521), and select a DB Parameter Group and Option Group.
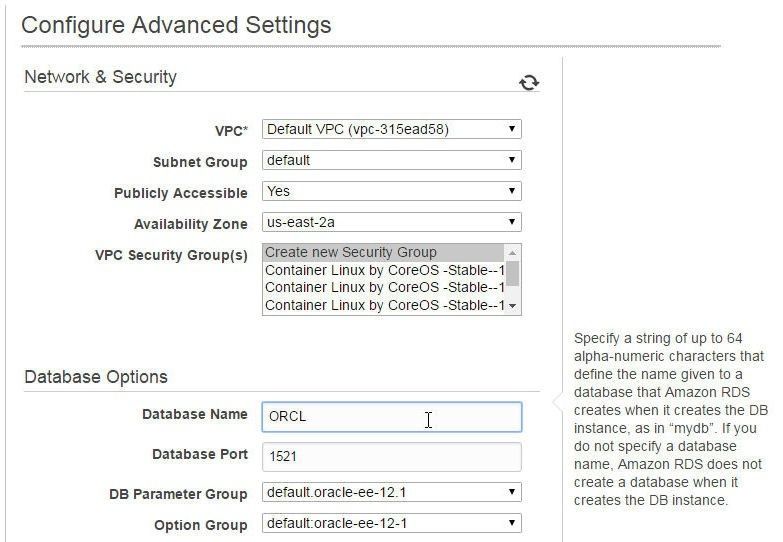
Figure 13. Advanced Settings
Select a Character Set Name and select No for Enable Encryption. Select a Backup Retention Period and a Backup Window. For Enhanced Monitoring select Enable Enhanced Monitoring option Yes as shown in Figure 14.
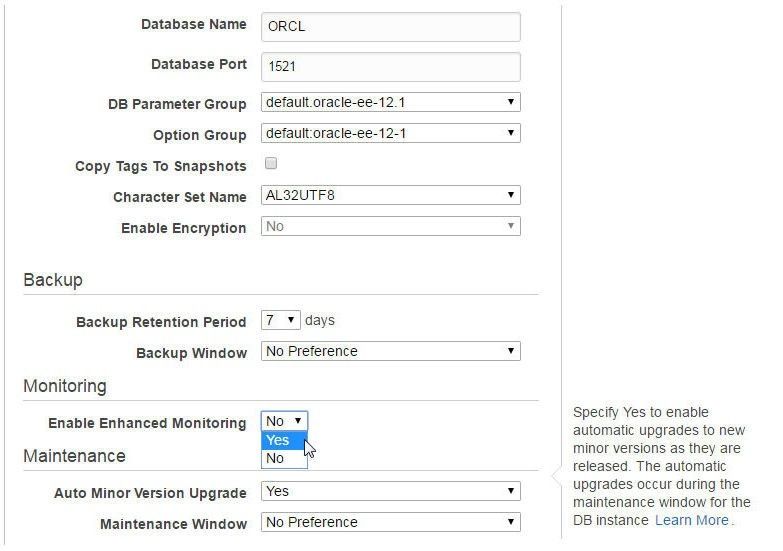
Figure 14. Selecting Enable Enhanced Monitoring option Yes
Select the Monitoring Role “rds” created earlier as shown in Figure 15.
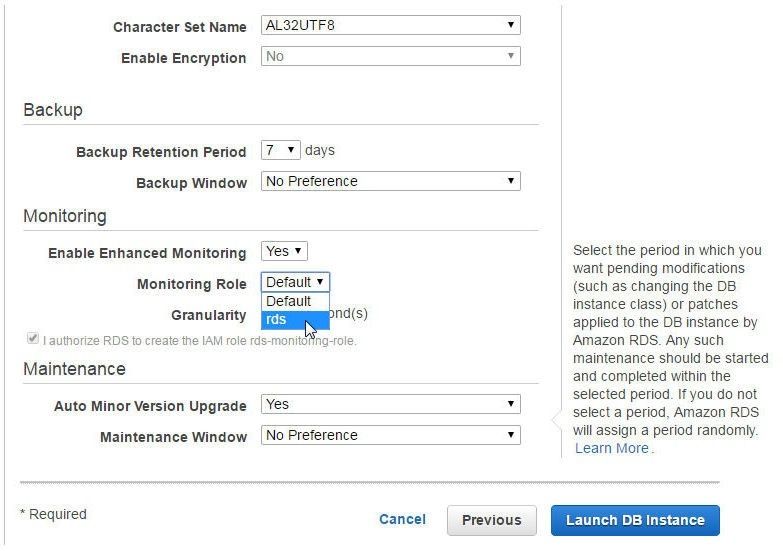
Figure 15. Selecting a Monitoring Role
Selecting the Default Monitoring Role could generate an error about lack of permissions for ENHANCED_MONITORING, as shown in Figure 16, and not launch a database instance.
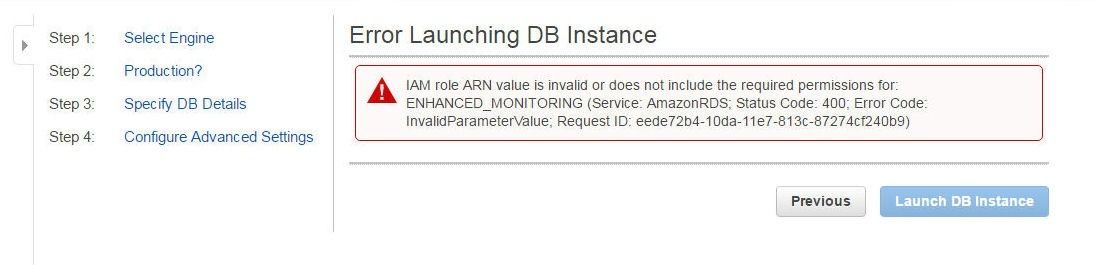
Figure 16. Error Launching DB Instance with Default Monitoring Role
Select a Granularity of 60 seconds and select the Maintenance settings for Auto Minor Version Upgrade and Maintenance Window and click on Launch DB Instance as shown in Figure 17.
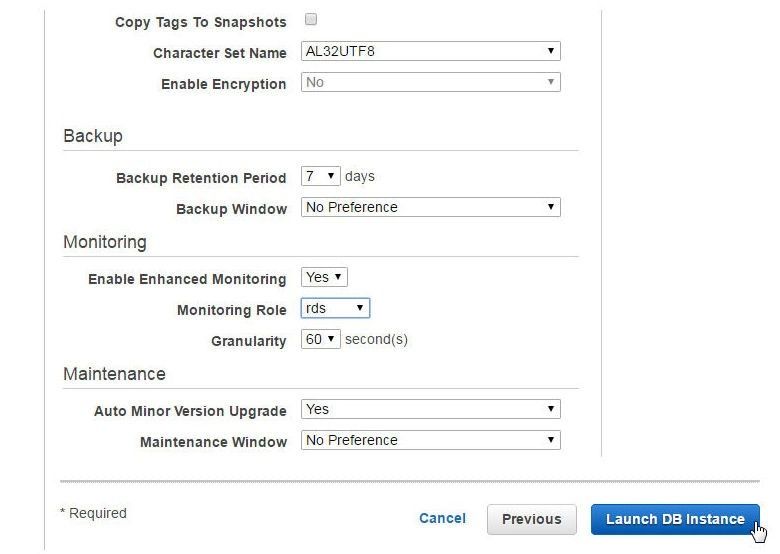
Figure 17. Launching DB Instance
A DB Instance gets created, as shown in the message in Figure 18. Click on View Your DB Instances to navigate to the DB Instances dashboard.
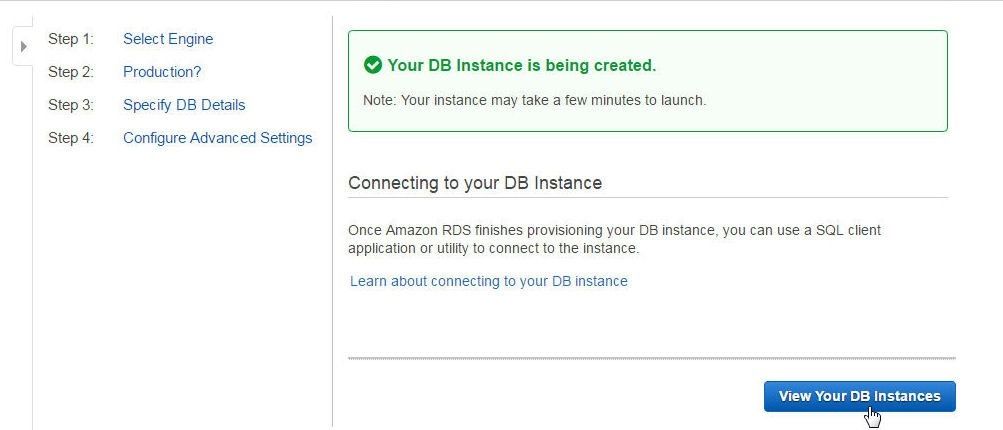
Figure 18. DB Instance created
The DB instance could take a few minutes to become available and in its Status is listed as “creating” or “backing up” till it becomes available.
Using RDS Dashboard Monitoring
Some of the proactive database management features are available in the RDS Dashboard itself, as shown in Figure 18. The Alarms and Recent Events list the CloudWatch Alarms and recent events, such as the DB Instance, being created or being backed up. The Monitoring section lists metrics for CPU, Memory, Storage, Read IOPS, Write IOPS, and Swap Usage, as shown in Figure 19 also.
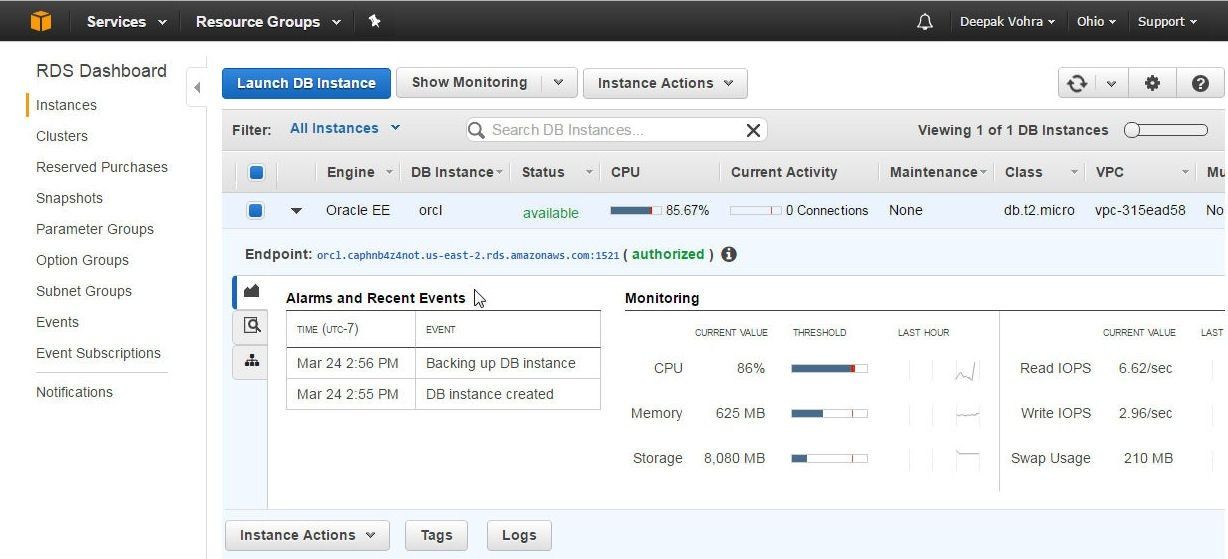
Figure 19. RDS Dashboard Proactive Management
Monitoring CloudWatch RDS Metrics
The AWS CloudWatch service is integrated with RDS and metrics and logs generated by RDS Database instances are automatically sent to CloudWatch. Select the CloudWatch service from the AWS Dashboard. Click on Browse Metrics as shown in Figure 20 to browse CloudWatch metrics.
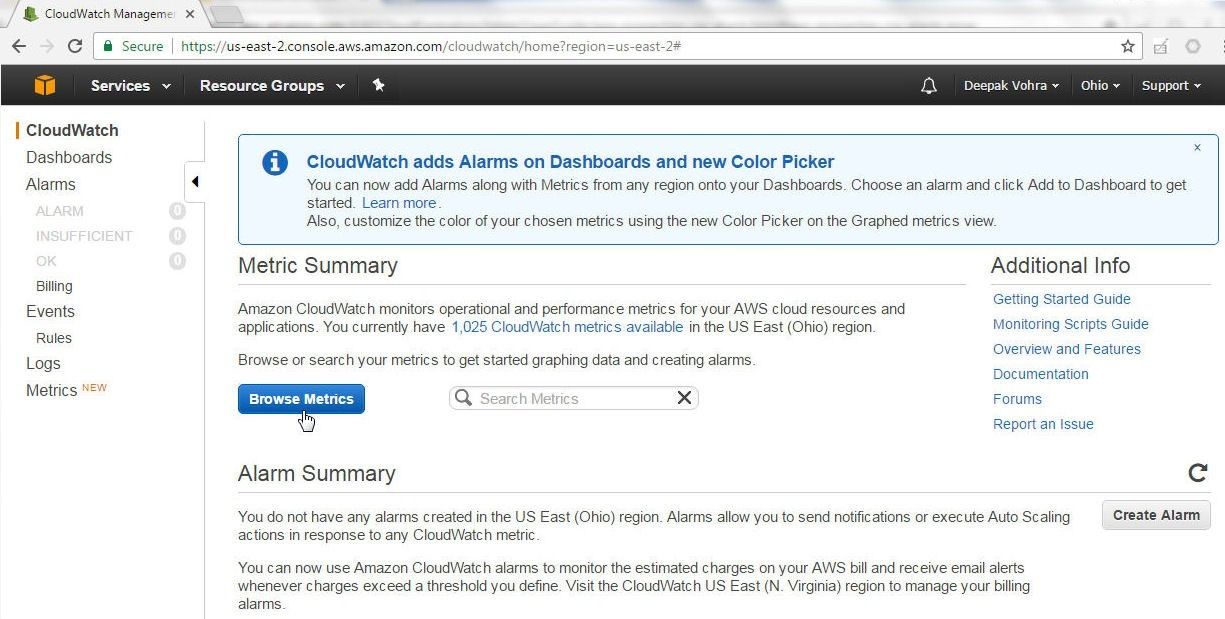
Figure 20. Selecting Browse Metrics in CloudWatch
CloudWatch collects metrics and logs for several AWS services and not just RDS. The All metrics tab lists all the metrics available in CloudWatch, as shown in Figure 21.
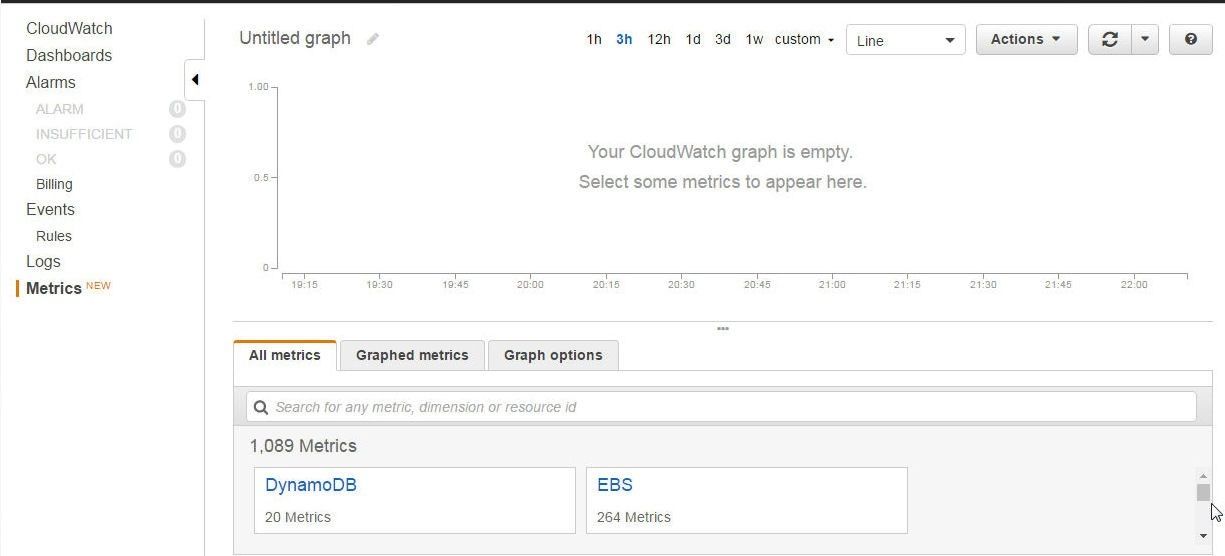
Figure 21. All metrics
Specify “RDS” in the Search field to list only the RDS-specific metrics, as shown in Figure 22. RDS metrics are grouped By Database Class, Across All Databases, Per-Database Metrics, and By Database Engine. Database Class is based on the EC2 Instance Type and, for the DB instance created, the Database Class is db.t2.micro.
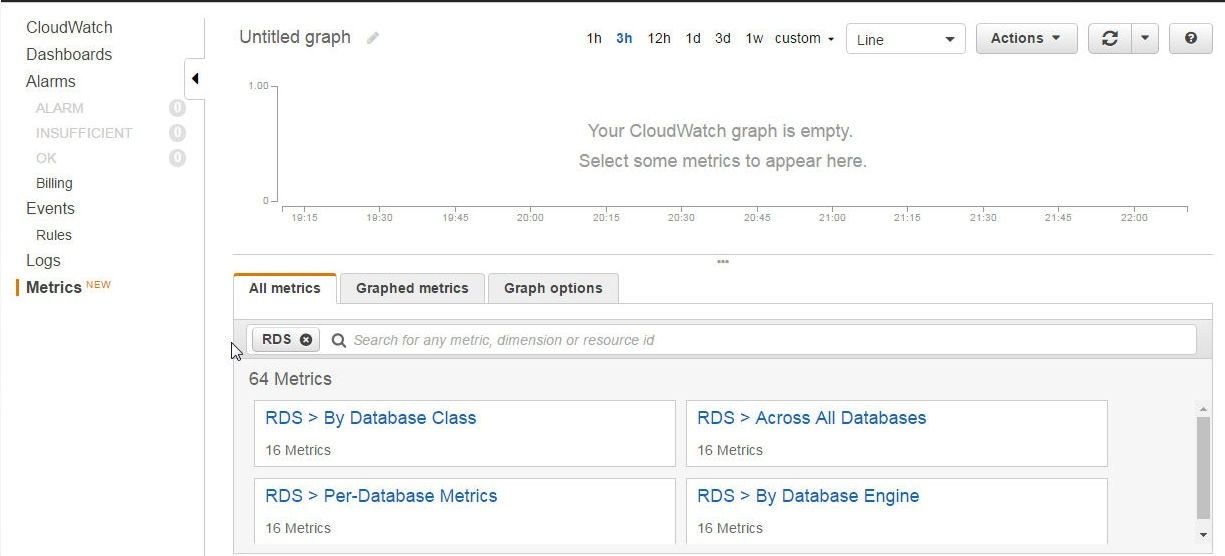
Figure 22. Filtering CloudWatch metrics for RDS metrics
As an example, select RDS>By Database Class, as shown in Figure 23.
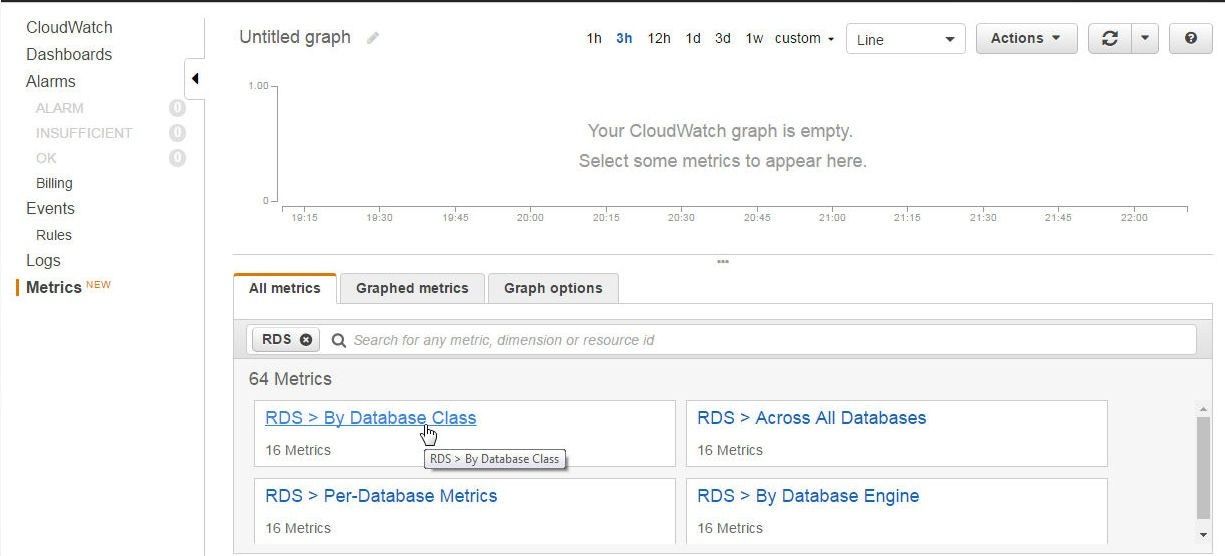
Figure 23. Selecting RDS Metrics>By Database Class
As an example, select SwapUsage for the db.t2.micro Database Class, and the graph for the metric gets displayed, as shown in Figure 24.
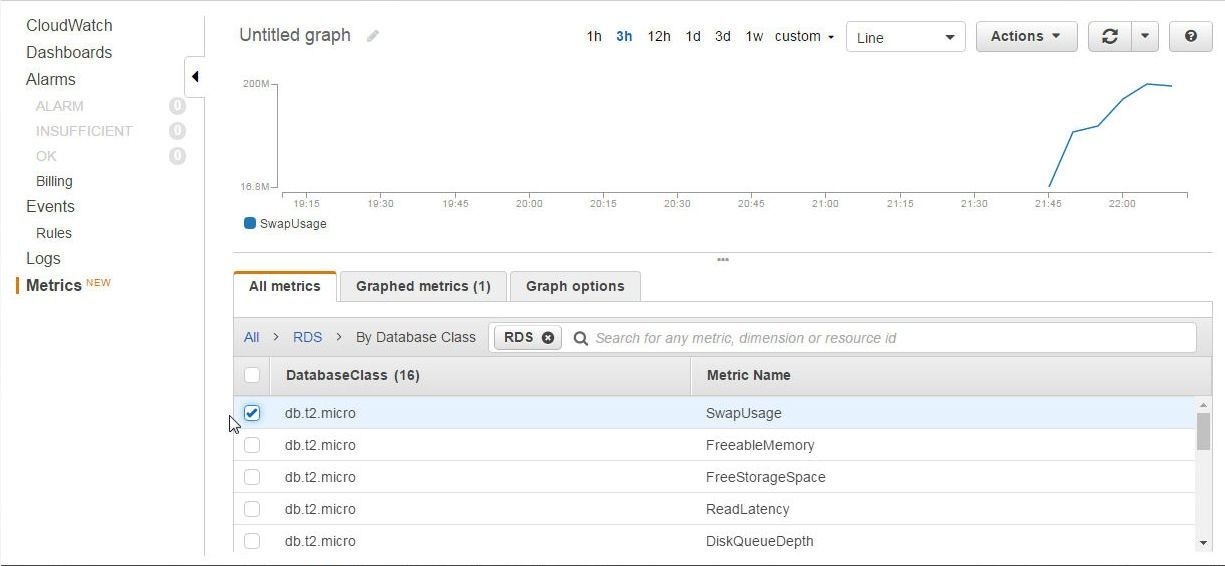
Figure 24. Displaying Graph for the Swap Usage Metric for the db.t2.micro Database Class
Similarly, to display metrics aggregated from all RDS Databases, click on RDS>Across All Databases as shown in Figure 25.
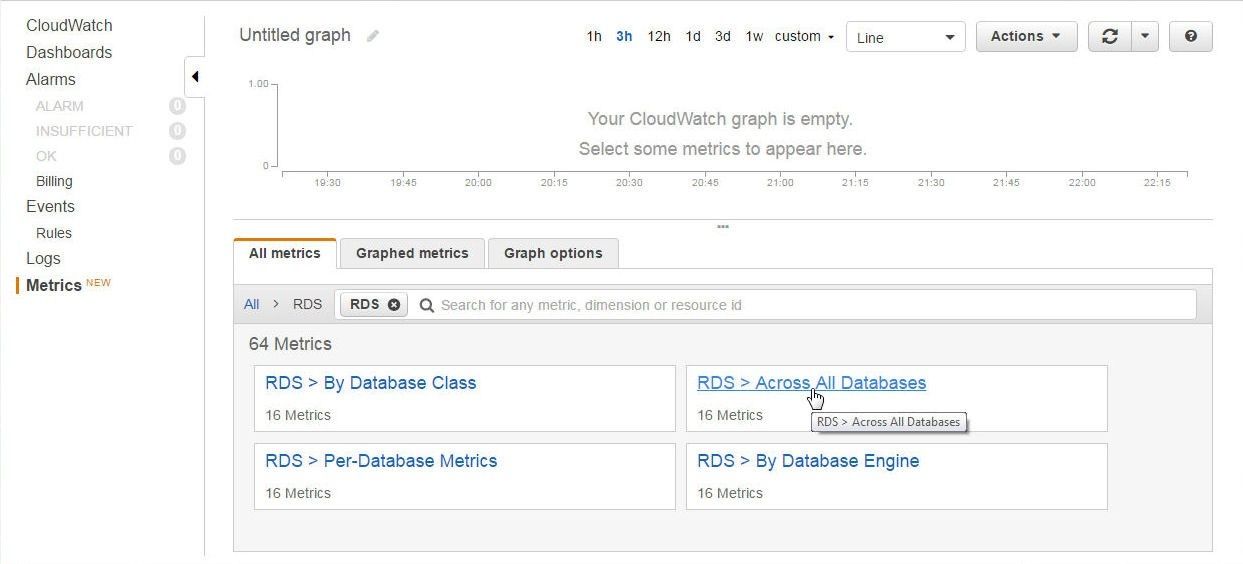
Figure 25. Selecting RDS>Across All Databases
For all RDS databases, 16 aggregated metrics get listed, as shown in Figure 26.
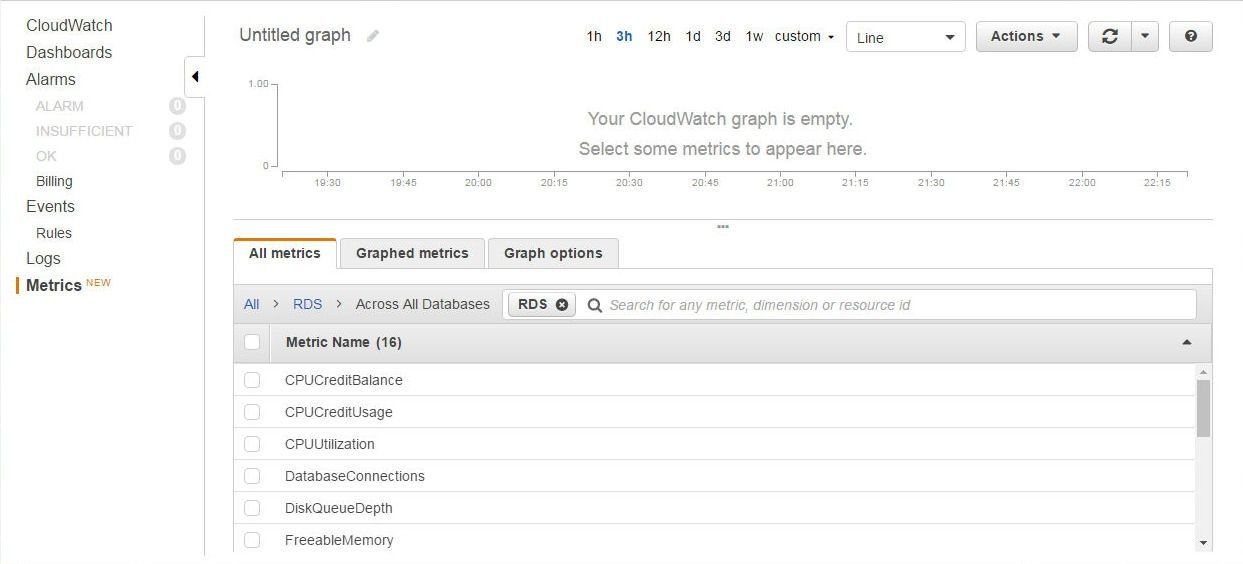
Figure 26. RDS Metrics aggregated across all Databases
The most useful set of metrics may be per database instance metrics; for which, select RDS>Per Database Metrics as shown in Figure 27.
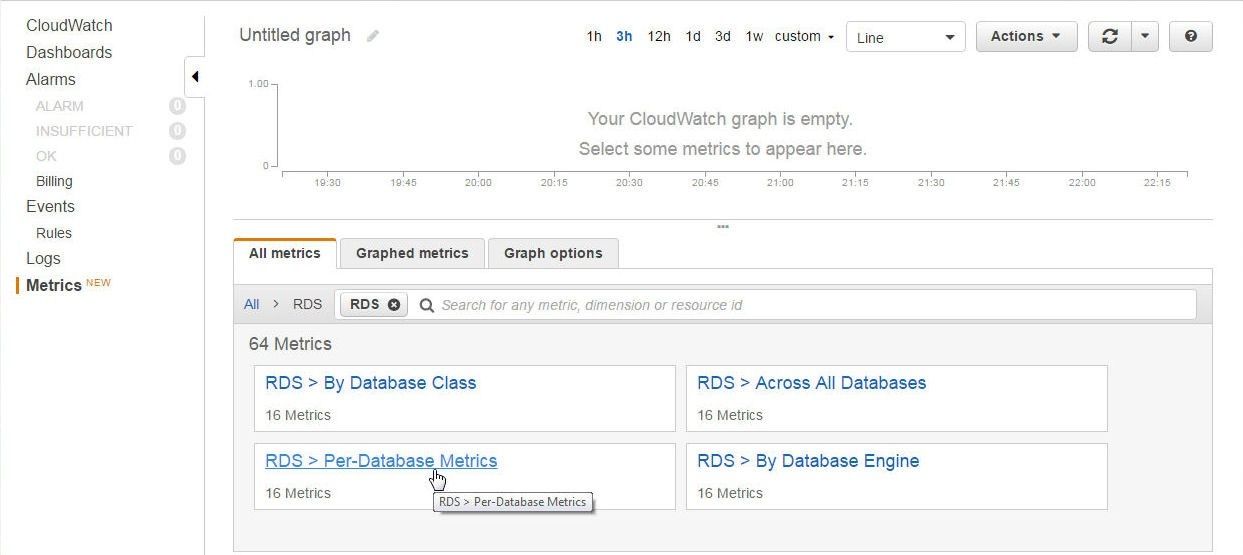
Figure 27. Selecting RDS>Per Database Metrics
Select a metric for the orcl database instance which we created earlier. As an example, select SwapUsage, and the graph for the metric gets displayed, as shown in Figure 28.
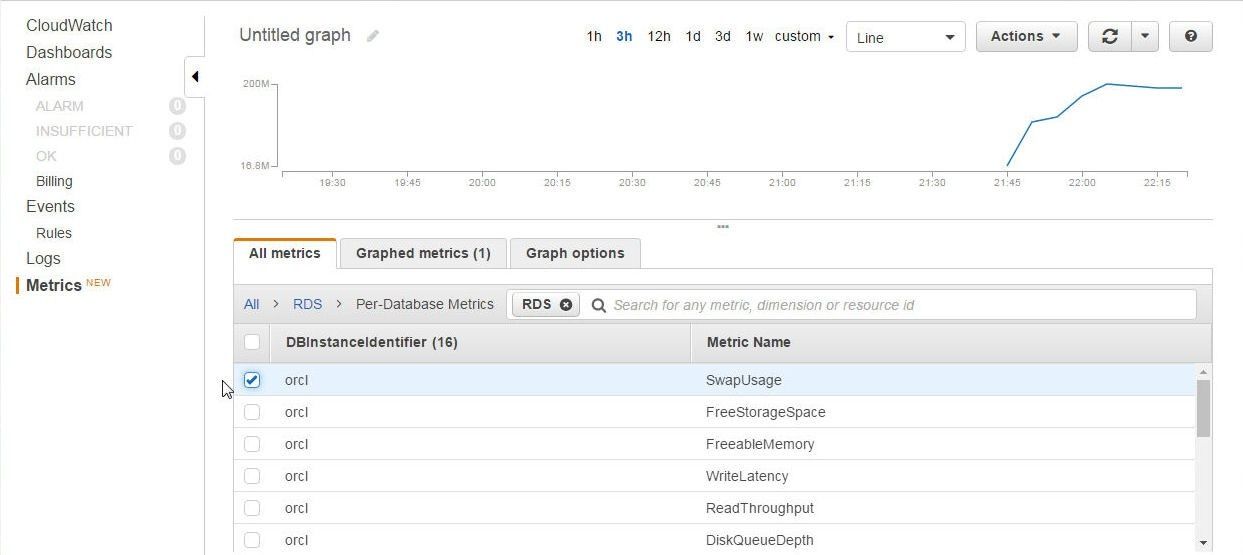
Figure 28. Displaying a Graph for the SwapUsage metric for orcl RDS Database
The Graphed metrics tab lists the graphed metrics; the color for a graph may be selected from a color palette, as shown in Figure 29.
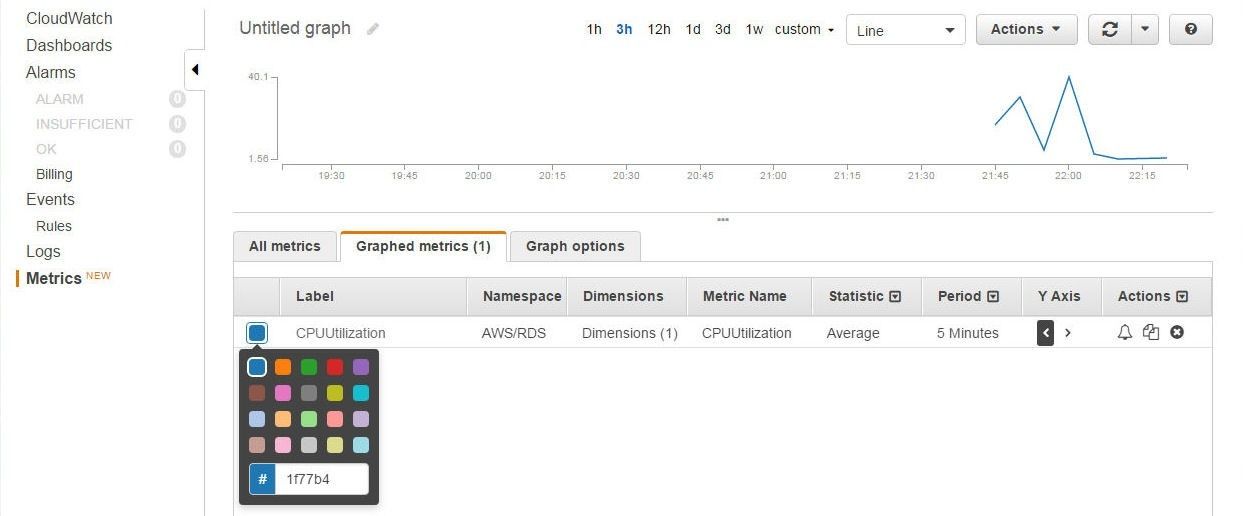
Figure 29. Selecting Graph Color
Multiple metrics may be selected to display graphs for multiple metrics, as shown in Figure 30.
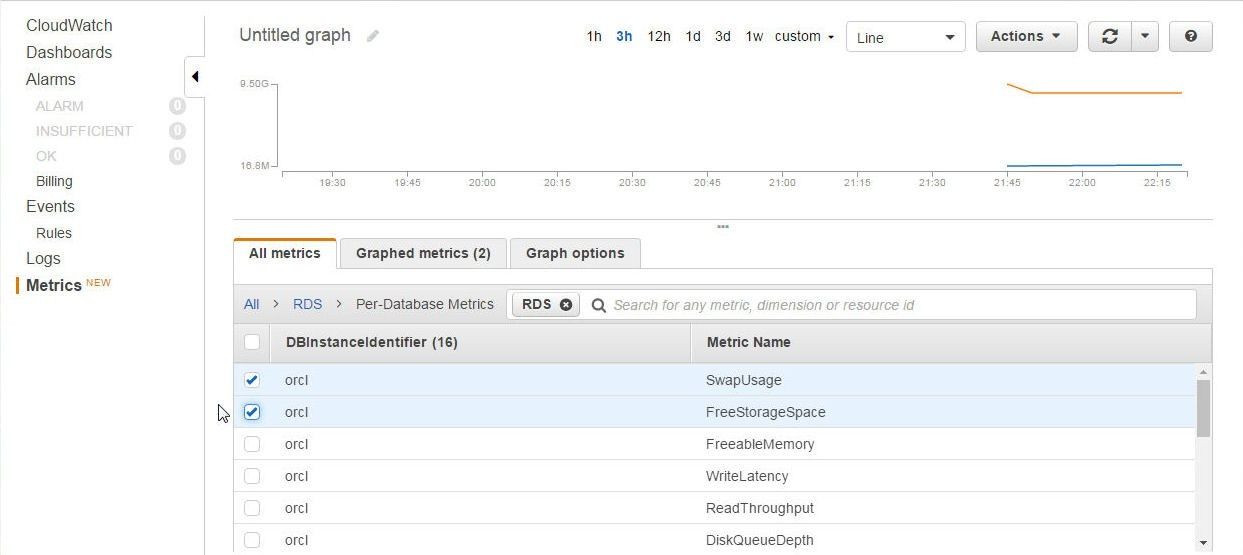
Figure 30. Displaying Graphs for Multiple Metrics
Monitoring CloudWatch Logs
CloudWatch logs for RDS database instances may be accessed by selecting Logs in the CloudWatch dashboard. Select the RDSOSMetrics log group in the CloudWatch>Log Groups as shown in Figure 31.
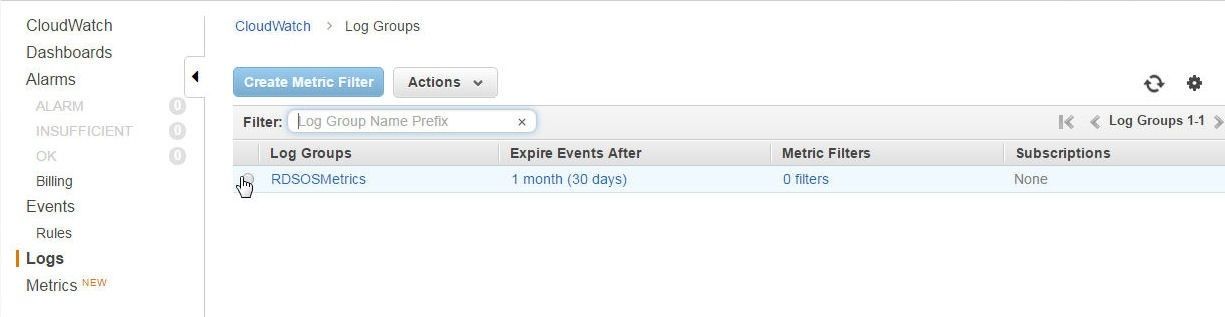
Figure 31. Selecting the RDSOSMetrics Log Group
From the CloudWatch>Log Groups>Stream for RDSOSMetrics select the log stream listed, as shown in Figure 32.
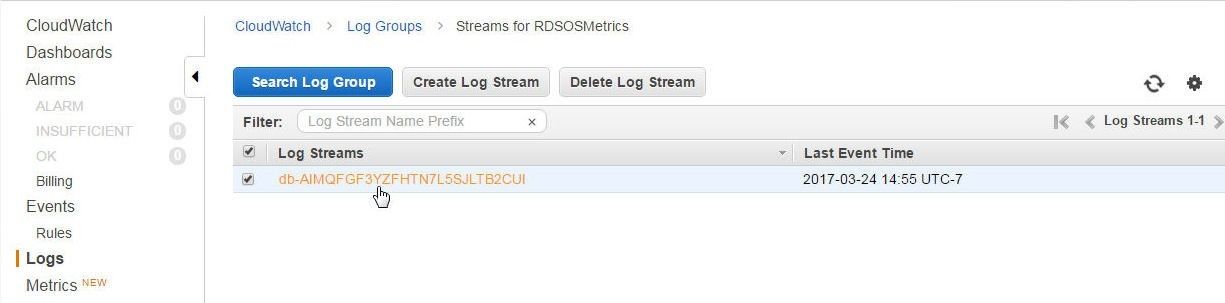
Figure 32. Selecting a Log Stream
The messages in the log stream get listed, as shown in Figure 33.
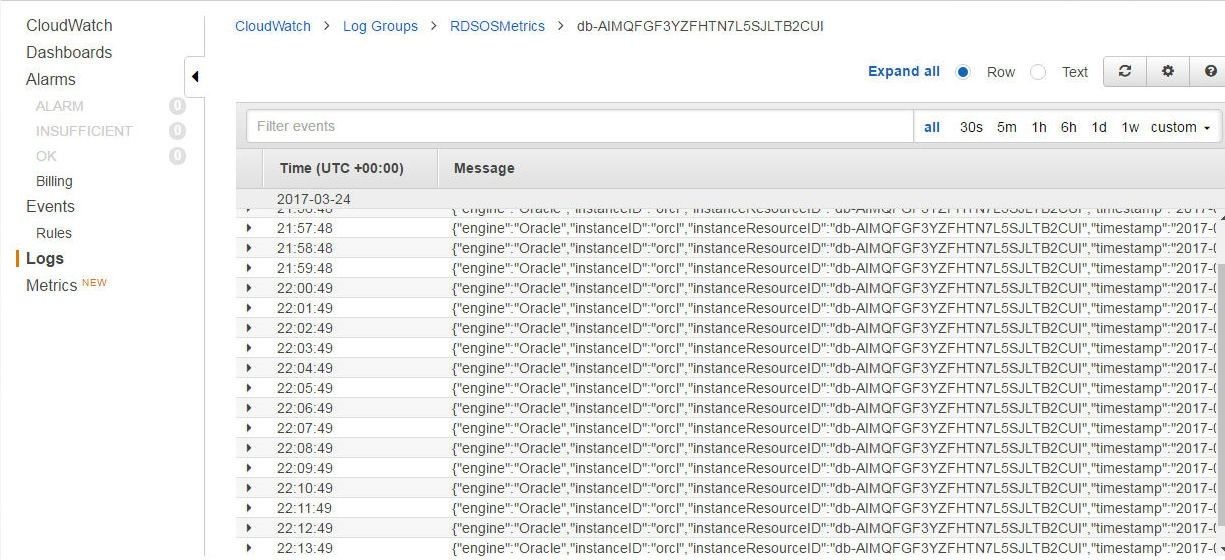
Figure 33. Log Stream Messages
By default all messages get listed. A single message be selected and displayed as JSON by selecting Row, as shown in Figure 34.
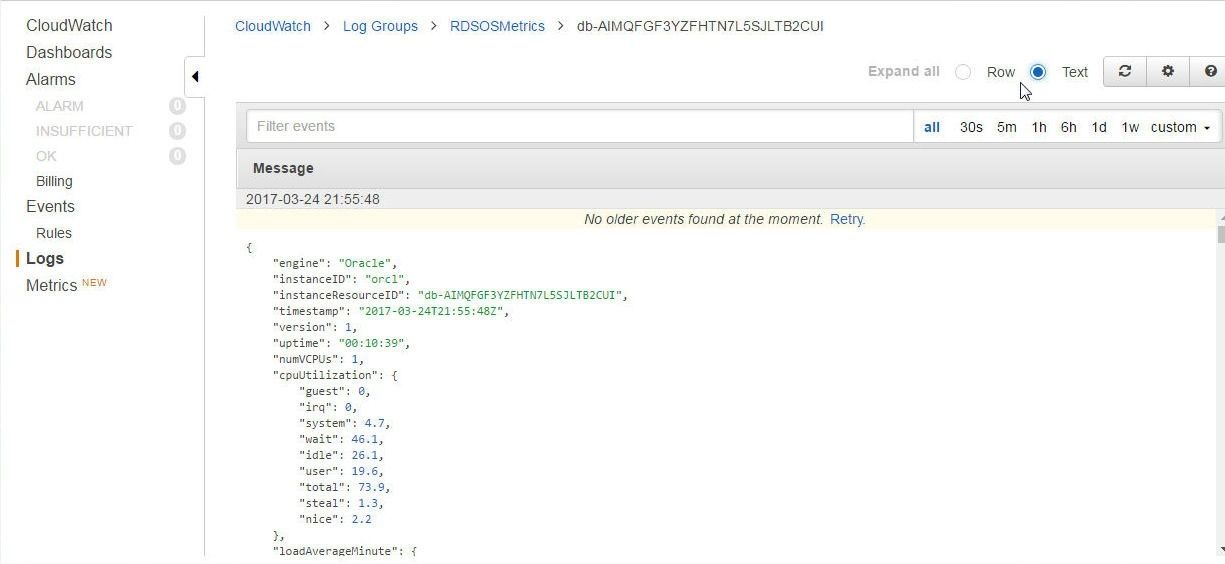
Figure 34. Displaying a Single Message
Adding a CloudWatch Alarm
One of the benefits of the CloudWatch service is that an “alarm” may be created to monitor individual metrics. As example, if a particular metric is not to exceed or fall below (or some other condition) a certain threshold value a CloudWatch alarm may be created for the same. To create a CloudWatch Alarm, click on Create Alarm as shown in Figure 35.
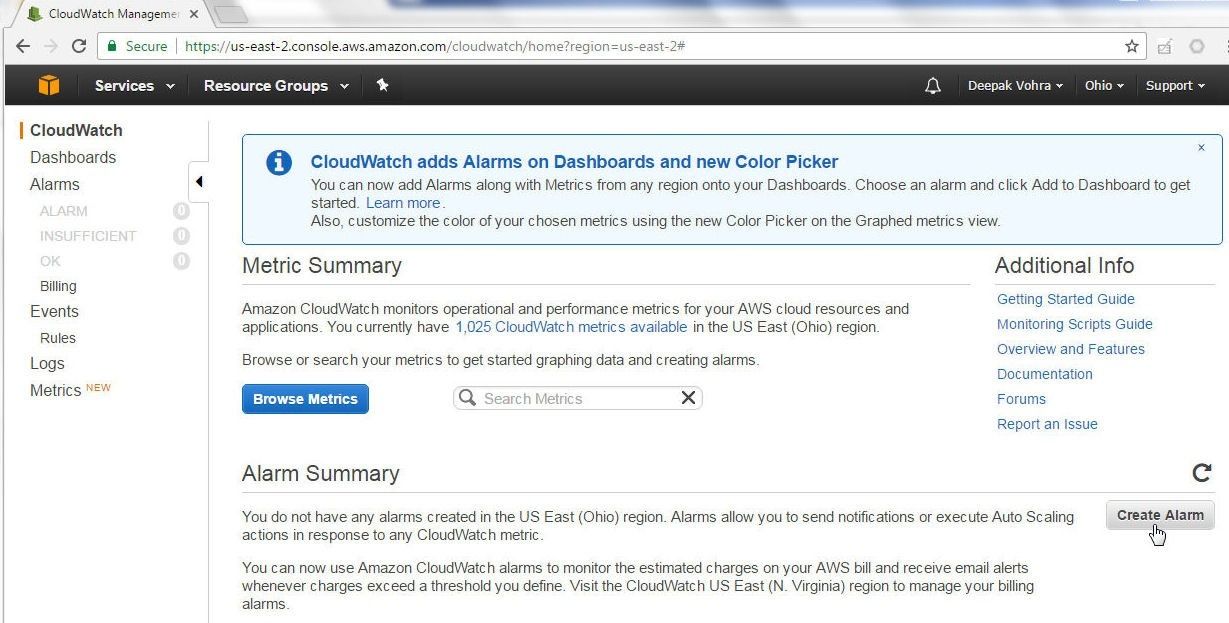
Figure 35. CloudWatch>Create Alarm
Alternatively, select Alarms in the CloudWatch Dashboard and click on Create Alarm as shown in Figure 36.
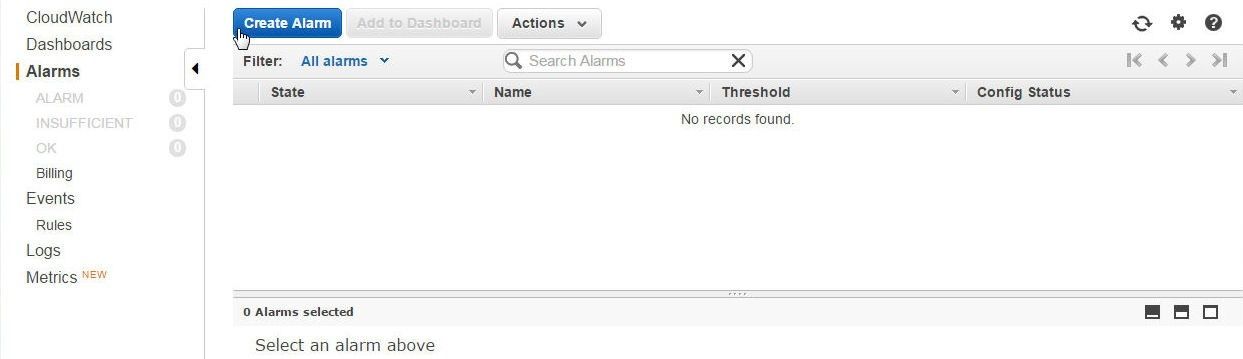
Figure 36. CloudWatch>Alarms>Create Alarm
The Create Alarm wizard gets started. In Select Metric, the CloudWatch Metrics are listed by category. Select from the RDS Metrics as shown in Figure 37. As an example, select Per-Database Metrics.
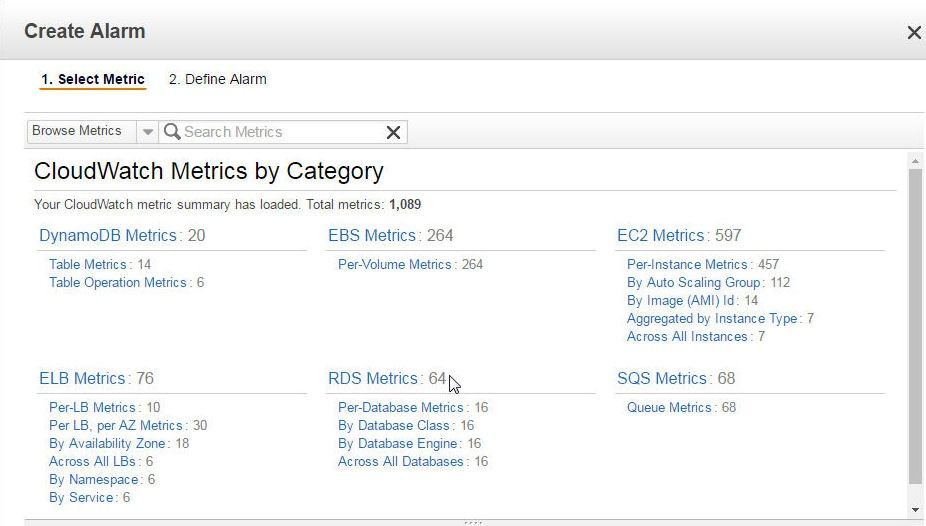
Figure 37. RDS Metrics
Select metric/s for which a CloudWatch Alarm is to be created. As an example, select the CPUUtilization metric for the orcl RDS Database as shown in Figure 38.
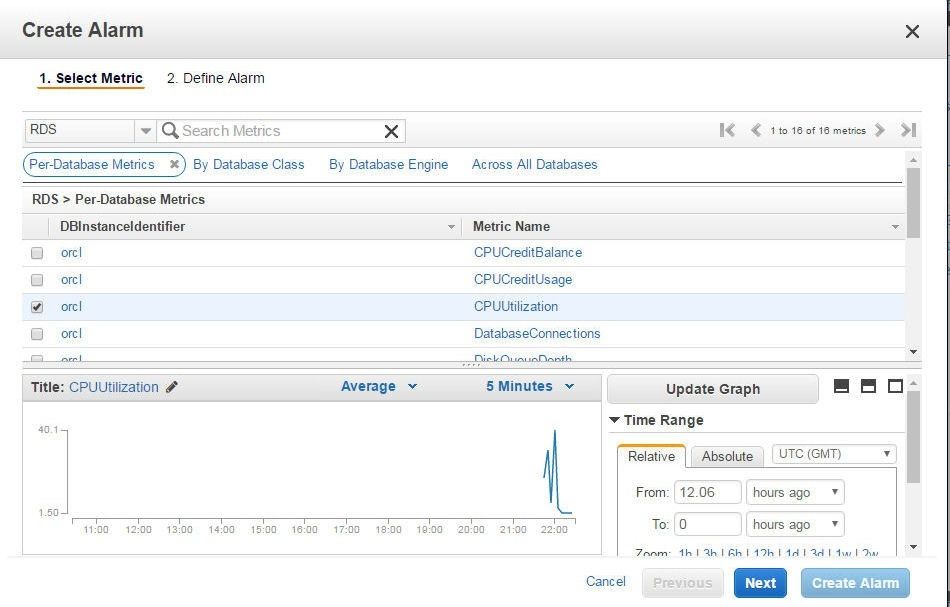
Figure 38. Selecting Metric/s
For Time Range a Relative range may be selected, as shown in Figure 36, or an Absolute range may selected as shown in Figure 39. Click on Next.
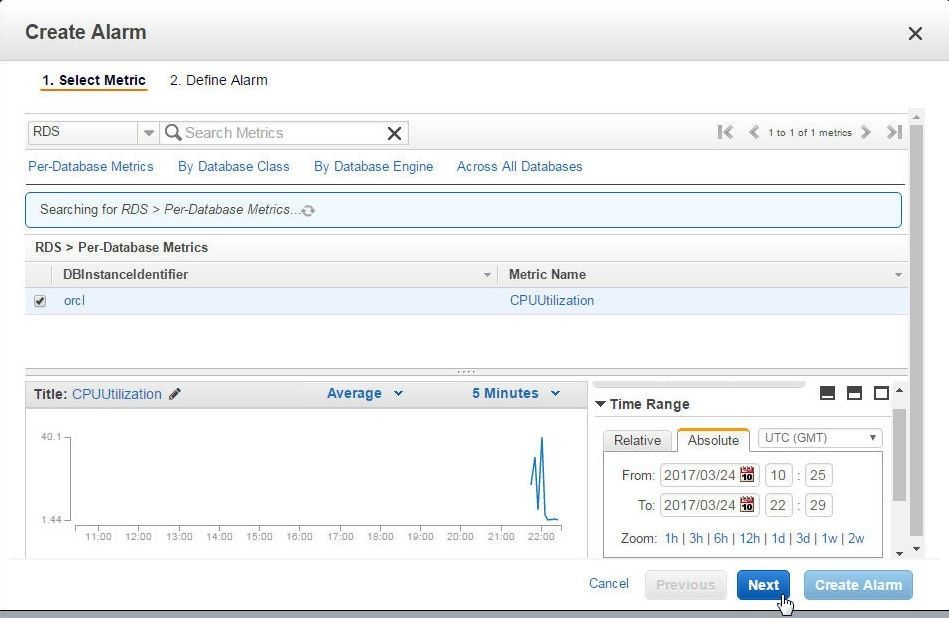
Figure 39. Selecting an Absolute Time Range
Having selected the metric, define the alarm, which consists of setting an alarm threshold in the Alarm Threshold section and specifying Notification actions in the Actions section as shown in Figure 40. Specify a Name for the alarm threshold. In Whenever, specify a condition. The condition specified is CPUUtilization>=50 for 2 consecutive period(s), the period being defined in the Alarm Preview section with a default of 5 minutes.
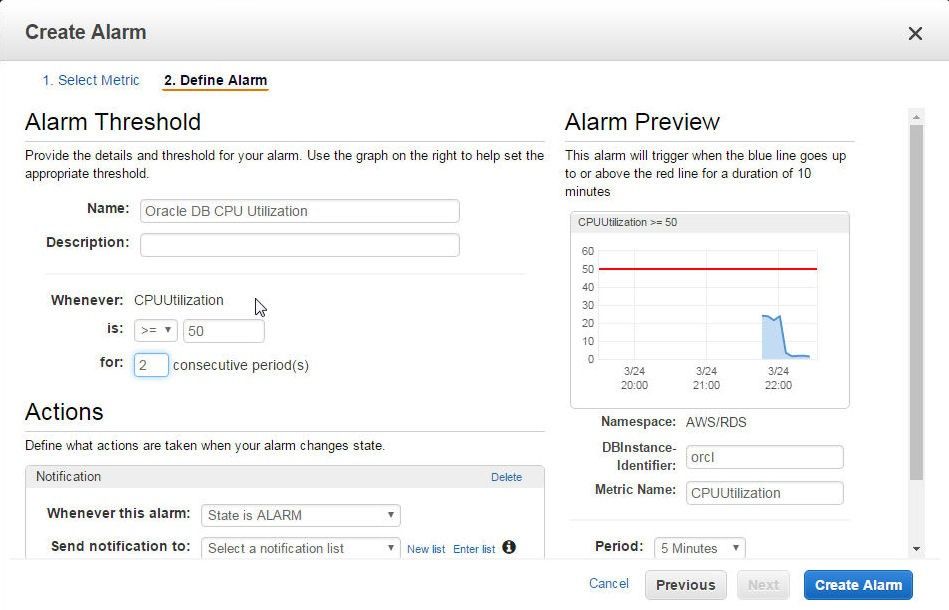
Figure 40. Defining the Alarm
A CloudWatch alarm has three settable states, as shown in Figure 41.
OK – The metric is OK and within the defined threshold
ALARM – The metric is not OK and outside the defined threshold
INSUFFICIENT_DATA – Sufficient data not is available to determine the alarm state, which could be because the alarm has just started.
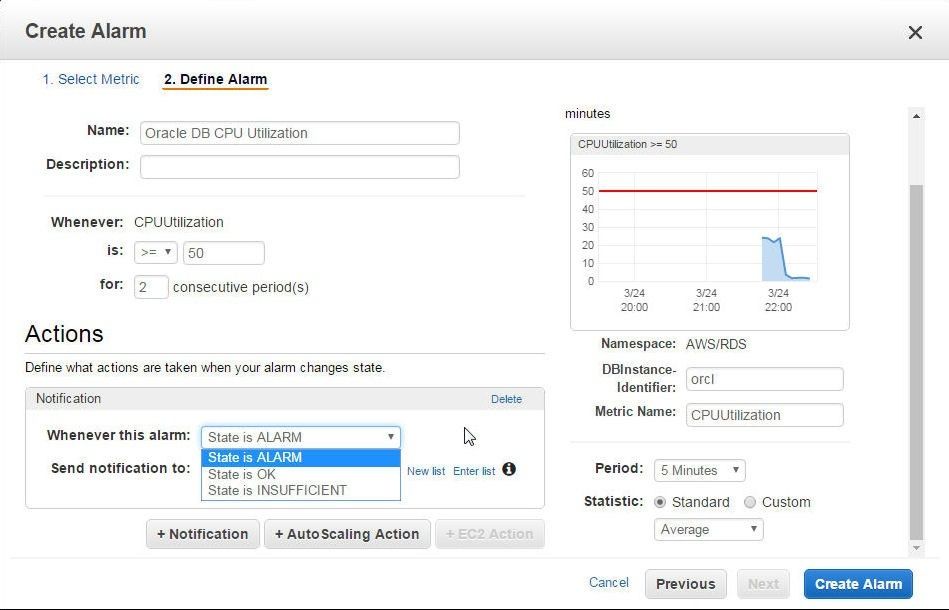
Figure 41. Selecting an Alarm Action for Notification
A CloudWatch Alarm makes use of AWS Simple Notification Service (SNS) to send a notification for which we need to create an SNS Topic, as indicated by the help message in Figure 42.
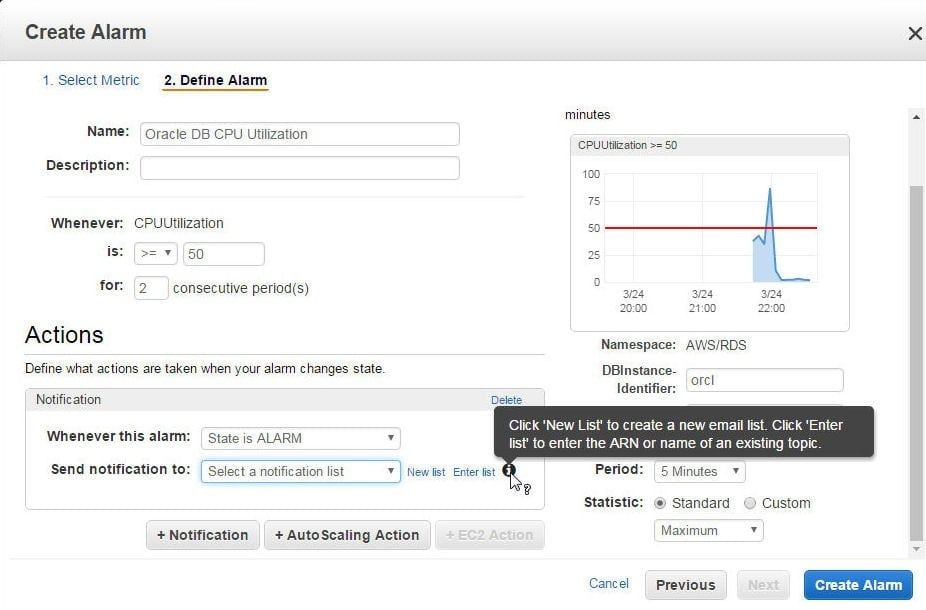
Figure 42. Sending Notification makes use a SNS Topic
To create a new SNS Topic navigate to the SNS Dashboard and Click on Create Topic as shown in Figure 43.
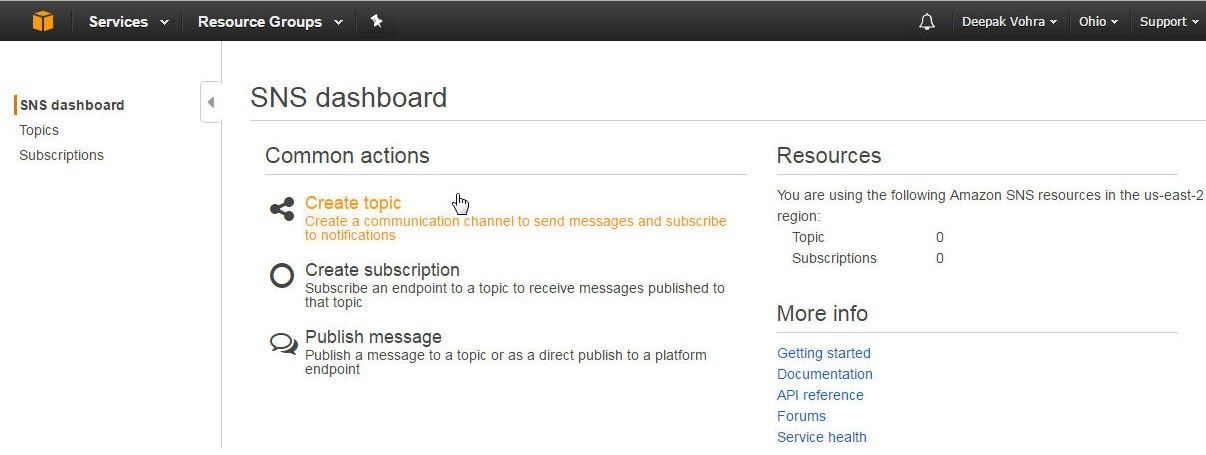
Figure 43. Selecting Create Topic in SNS Dashboard
In Create new topic specify a Topic name (RDSCloudWatch) and click on Create topic as shown in Figure 44.
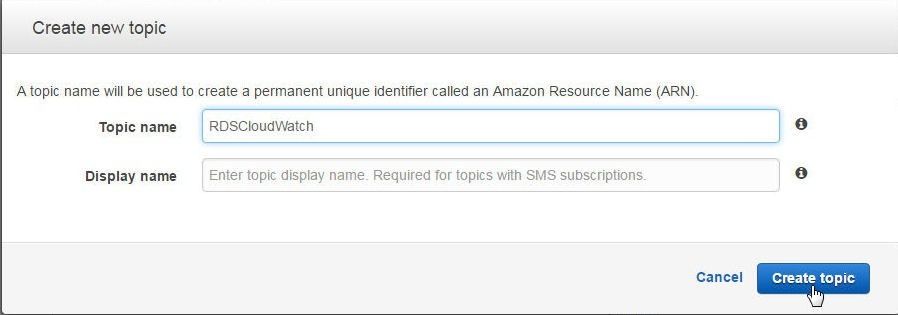
Figure 44. Create new topic
A new SNS Topic gets created, as shown in Figure 45. Copy the Topic ARN listed in the Topic Details.
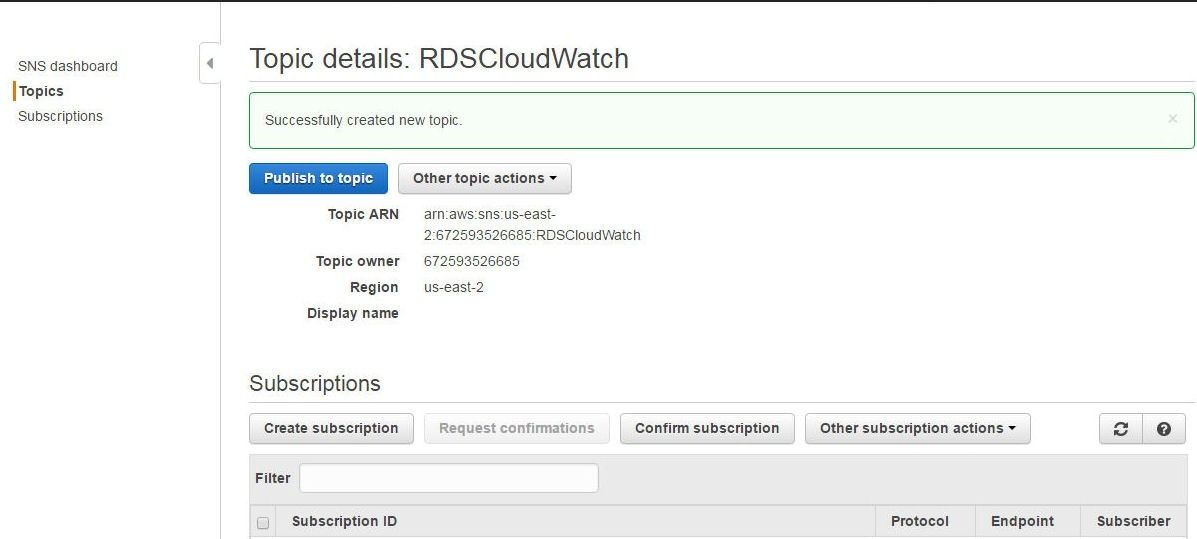
Figure 45. New SNS Topic RDSCloudWatch
The RDSCloudWatch SNS Topic gets listed in Topics, as shown in Figure 46, and the ARN may be copied from the Topics as well.
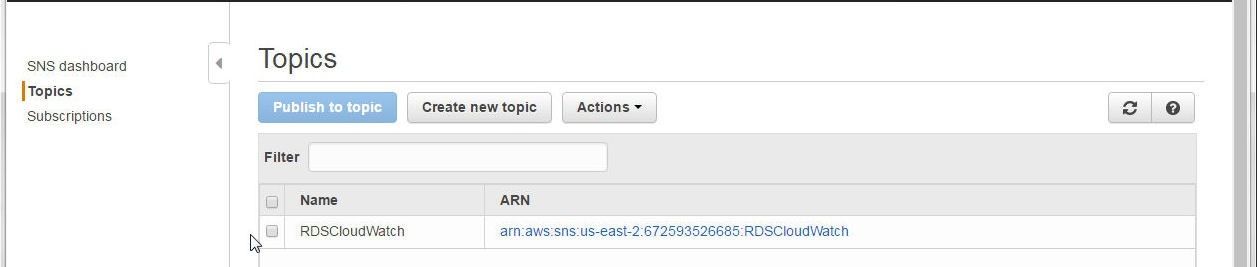
Figure 46. SNS Topics
In the Actions>Send notification to field, specify the ARN generated for the SNS Topic, as shown in Figure 47. Click on Create Alarm in the Alarm Preview section.
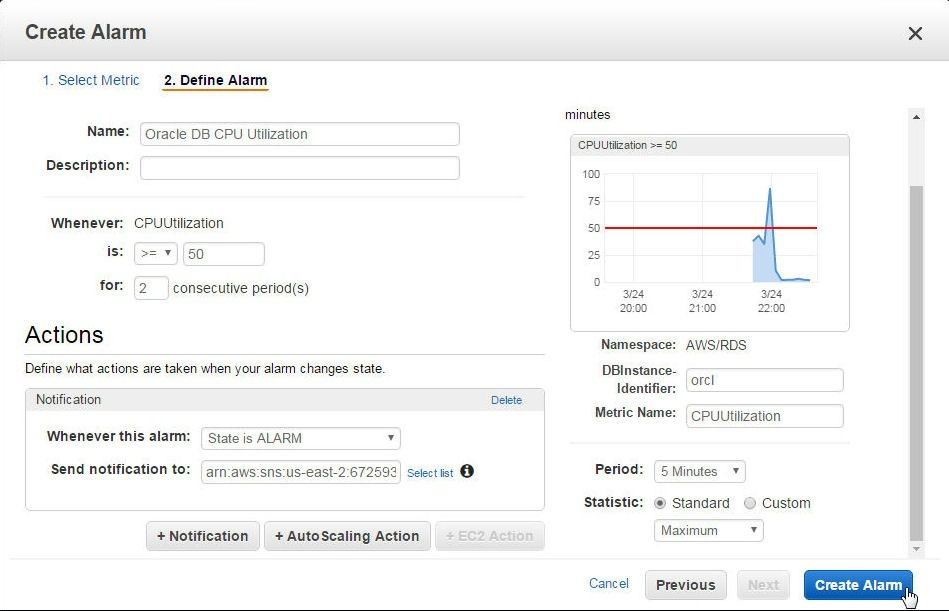
Figure 47. Create Alarm
The Oracle DB CPU Utilization Alarm alarm gets created, as shown in Figure 48.
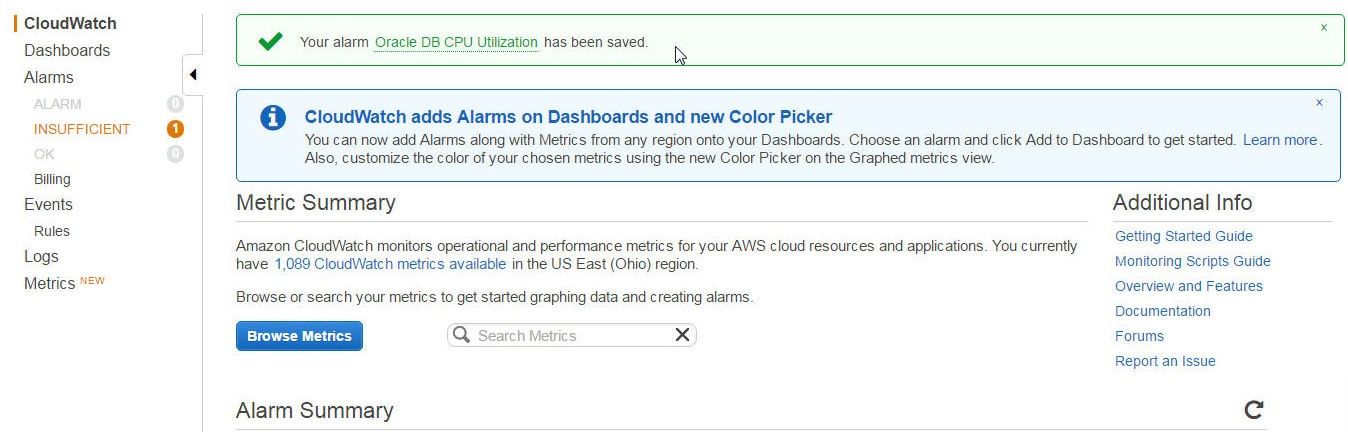
Figure 48. Oracle DB CPU Utilization Alarm
Initially the alarm state cannot be determined due to insufficient data, as indicated by the INSUFFICIENT DATA alarm state, shown in Figure 49.
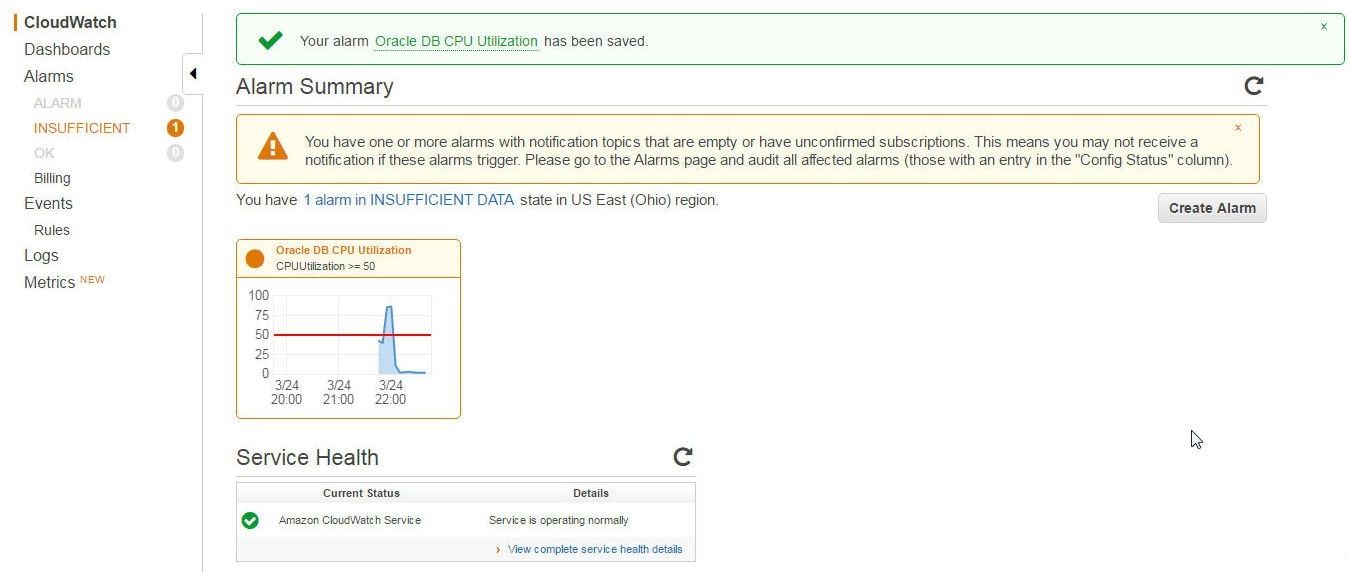
Figure 49. Alarm state cannot be determined due to INSUFFICIENT DATA
A CloudWatch alarm configured to send notification to an SNS Topic is of limited use, as a Database administrator would be required to monitor the SNS Dashboard constantly for the alarm state. A SNS Subscription should be created to send notification to a DBA to one of the several endpoints, which include sending via Email. To create an SNS Subscription, click on Create Subscription as shown in Figure 50.
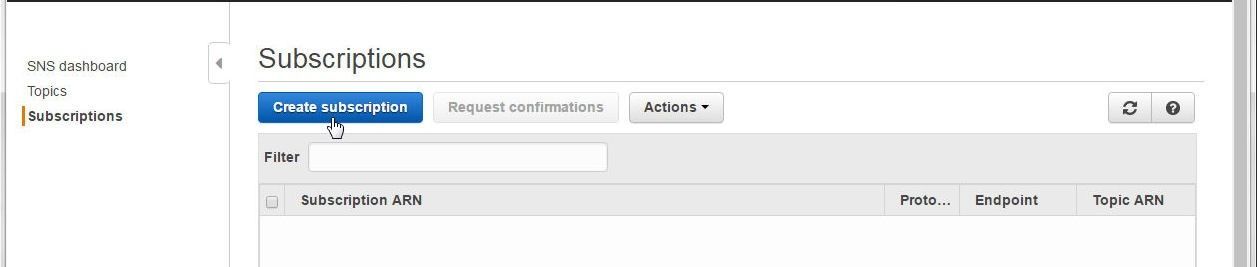
Figure 50. Subscriptions> Create Subscription
The Create subscription dialog gets displayed as shown in Figure 51.
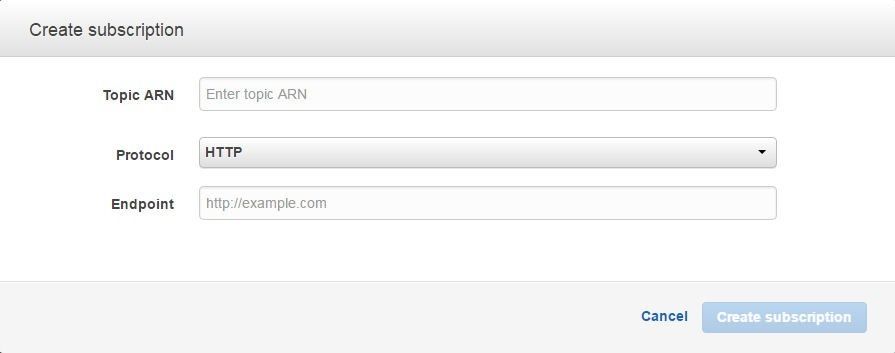
Figure 51. Create Subscription
In the Create subscription dialog, specify the Topic ARN and select a Protocol from the list. To send Email notifications, select Protocol as Email as shown in Figure 52. Specify Endpoint as the Email address to send notification to, and click on Create Subscription.
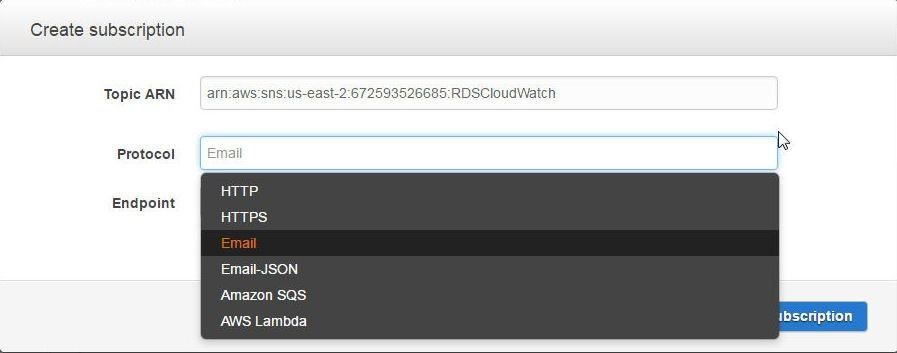
Figure 52. Selecting Subscription Protocol
A new subscription gets created and is initially “PendingConfirmation” as shown in Figure 53.
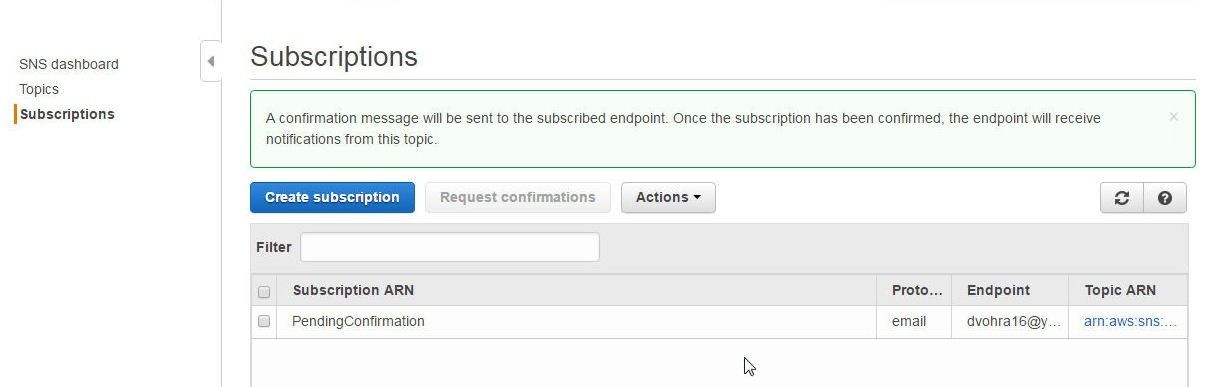
Figure 53. New Subscription pending confirmation
As sufficient data becomes available the alarm status becomes OK as shown in Figure 54, but the Config Status is Invalid notification, which is because the Subscription created is in Pending state till confirmed.
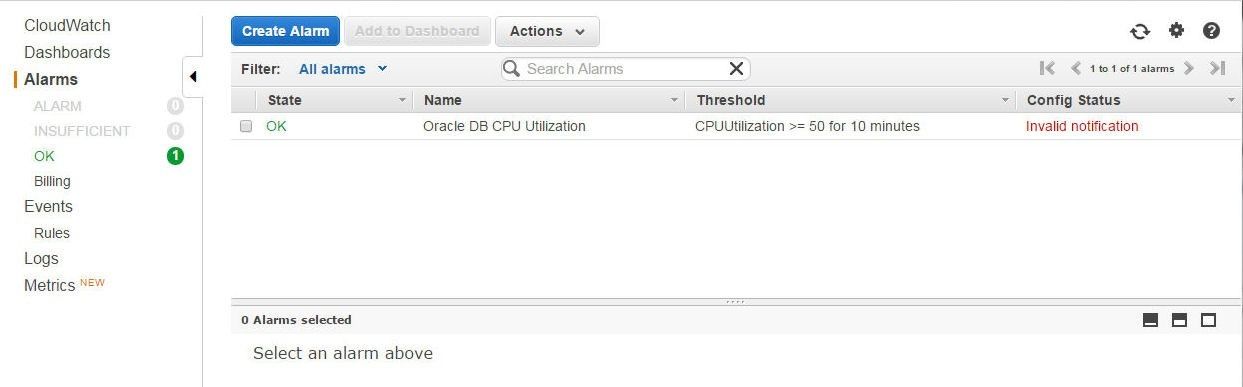
Figure 54. Alarm State and Config Status
Select the alarm, and the Details tab also indicates that the notification topic could not be found, as shown in Figure 55.
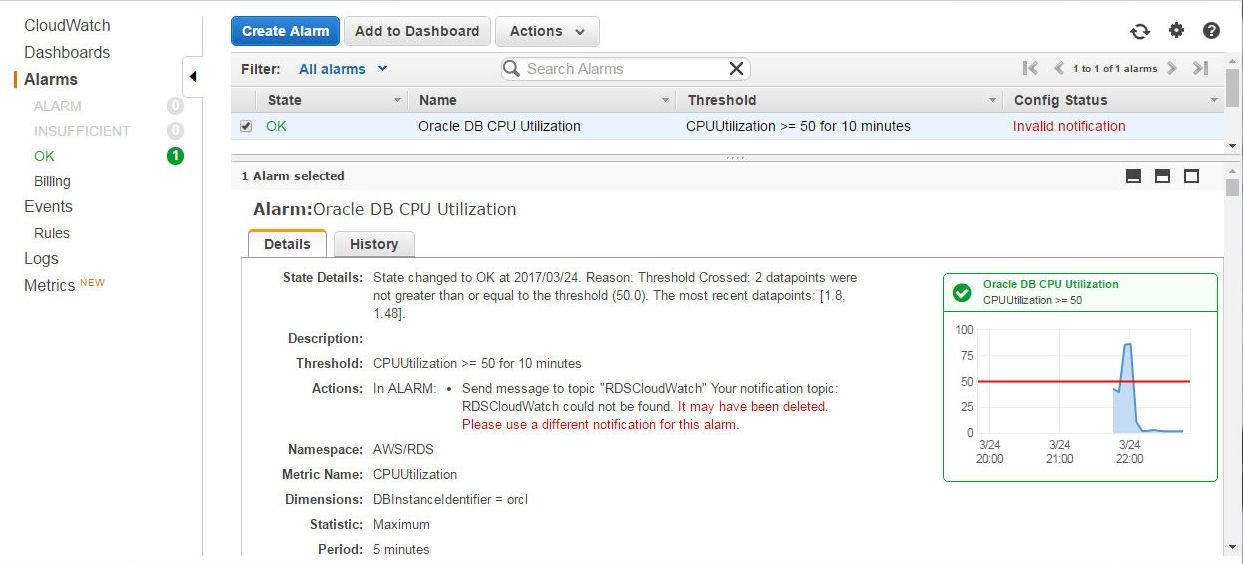
Figure 55. Alarm pending confirmation
When the Subscription is created, a message gets sent to the endpoint Email. Confirm the subscription in the confirmation message and a Subscription confirmed message gets displayed a shown in Figure 56.
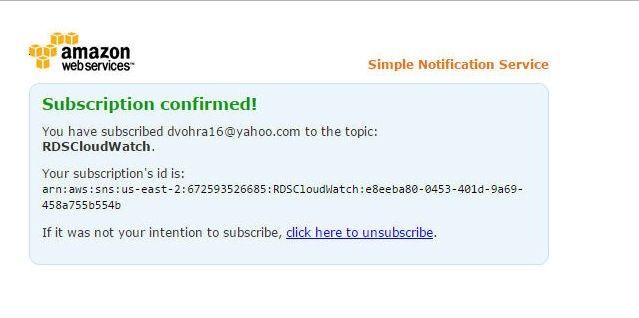
Figure 56. Subscription confirmed
The Invalid Notification message in the Alarm Config Status and the Details tab get removed, as shown in Figure 57.
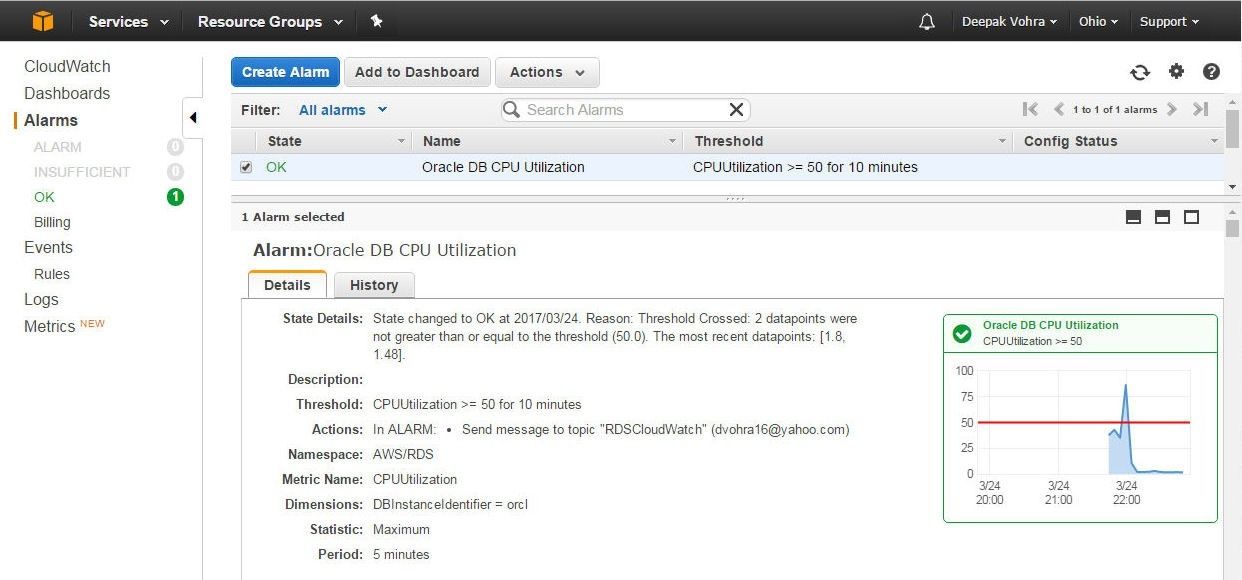
Figure 57. CloudWatch Alarm with Confirmed Status and OK State
With a CloudWatch Alarm created and configured with an SNS Topic and Subscription, if the CPUUtilization were to be >= 50, an Email notification would be sent to the subscriber.
Configuring RDS Events Notification
An RDS Database generates events for the different stages of a database, such as a DB Instance being created or backed up. An Event Subscription may be created by selecting Event Subscriptions in the RDS Dashboard, as shown in Figure 58.
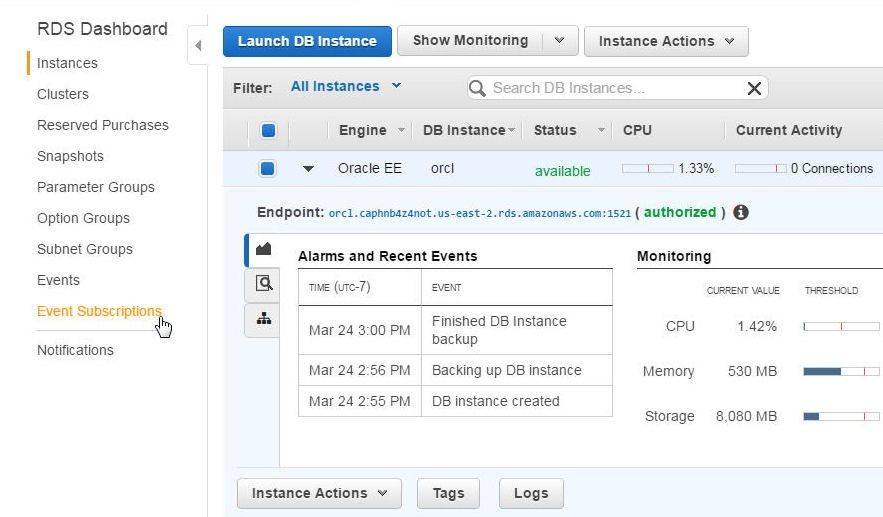
Figure 58. Event Subscription
Click on Create Event Subscription as shown in Figure 59.
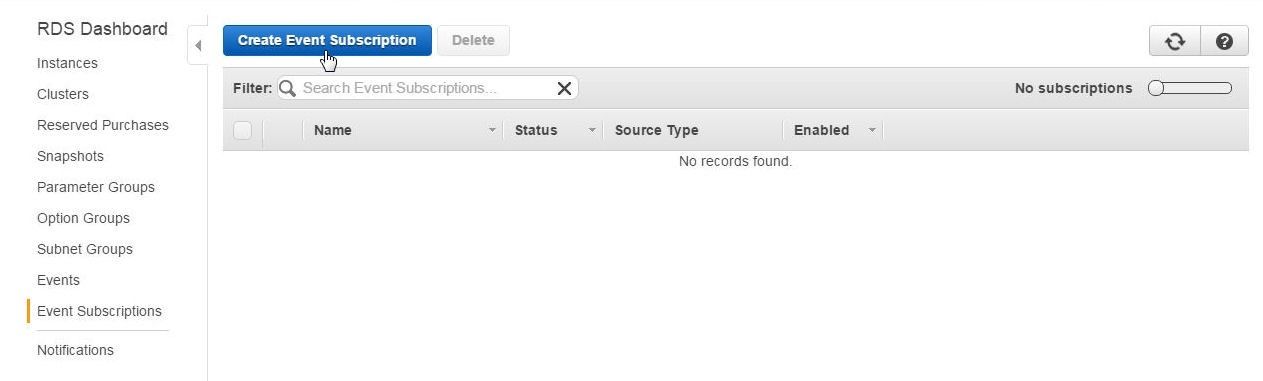
Figure 59. Create Event Subscription
In the Create Event Subscription dialog specify a subscription Name (orcl-RDS) and select an SNS Topic (RDSCloudWatch), as shown in Figure 60.
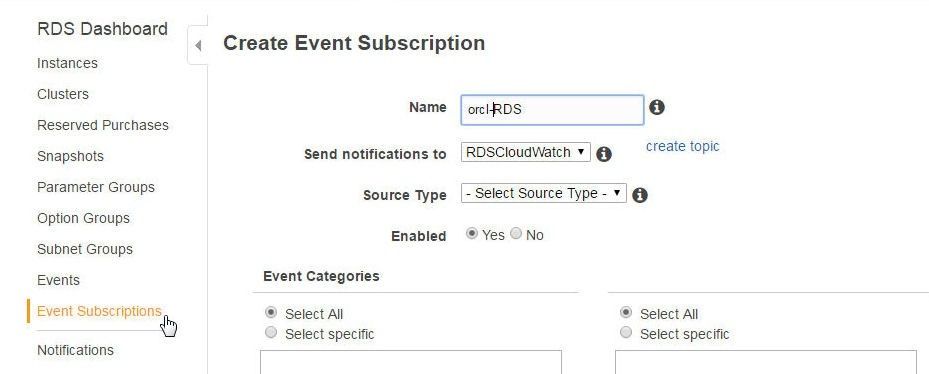
Figure 60. Create Event Subscription
In Source Types select Instances (database), as shown in Figure 61 and select Enabled>Yes to enable the subscription.
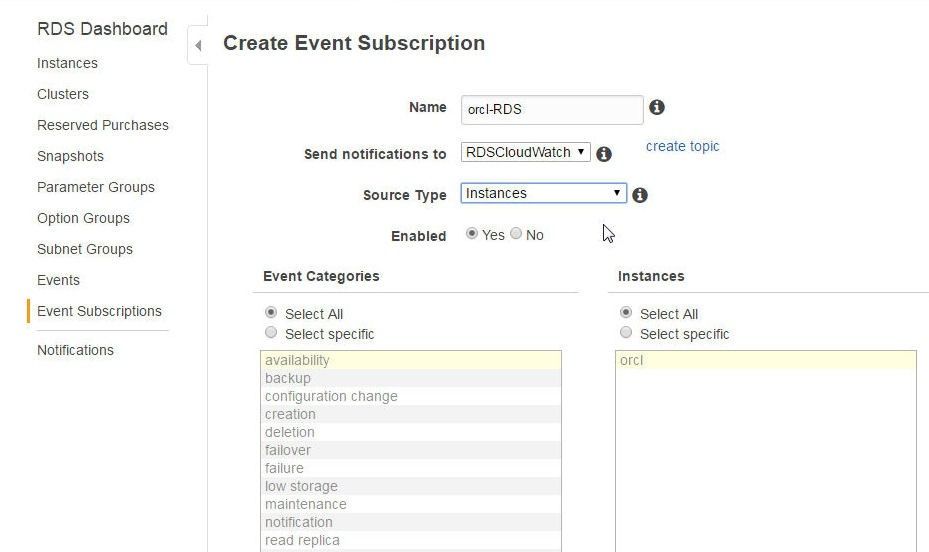
Figure 61. Selecting Database Instances as Source Type
In Event Categories, Select All is selected by default. Alternatively, specific event categories may be selected from those listed. In Instances, Select All is selected by default and specific Database instances may be selected from those listed, as shown in Figure 62. Click on Create.
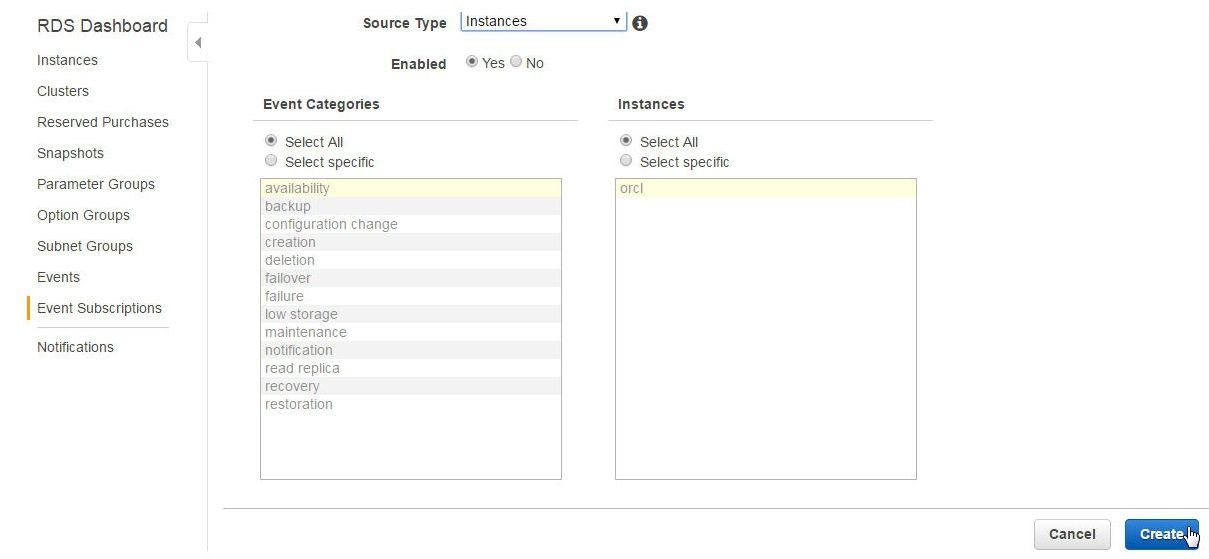
Figure 62. Selecting Event Categories and Instances
The event subscription gets created, as shown in Figure 63.
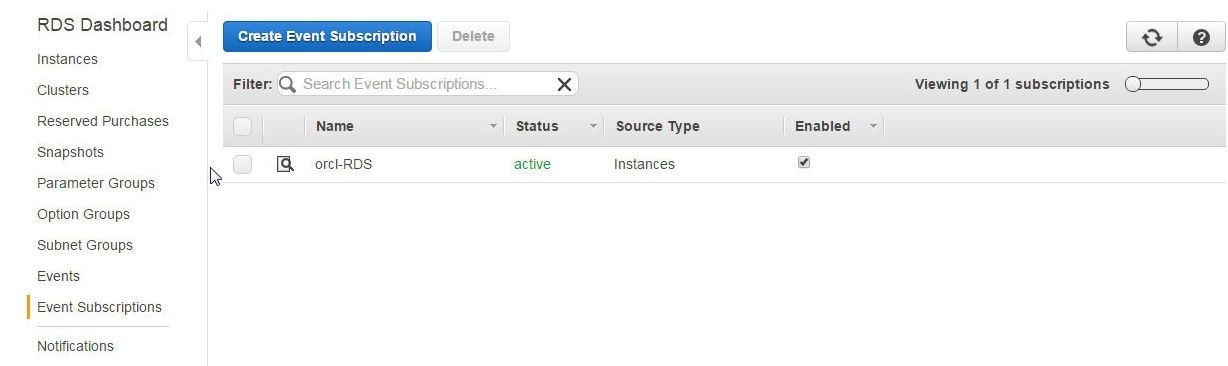
Figure 63. Event Subscription orcl-RDS
The Events generated by RDS Databases may be listed with the Events selection, as shown in Figure 64. By default all Events are listed but Events may be filtered.
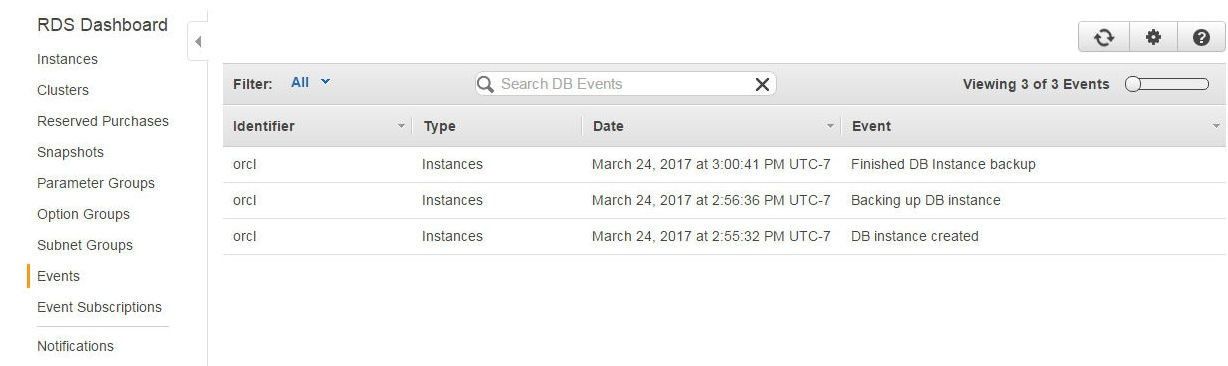
Figure 64. Events
An Event Subscription’s details may be displayed by selecting the Go to Details page, as shown in Figure 65.
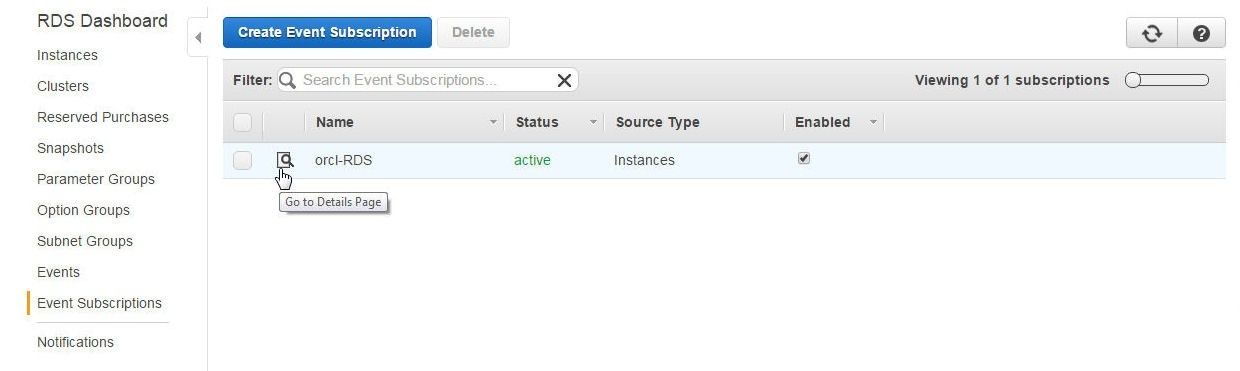
Figure 65. Go to Details Page
An Event Subscription may be updated with the Update button, which is not enabled till some update has been made, such as adding or removing an Event category or Database instance, as shown in Figure 66.
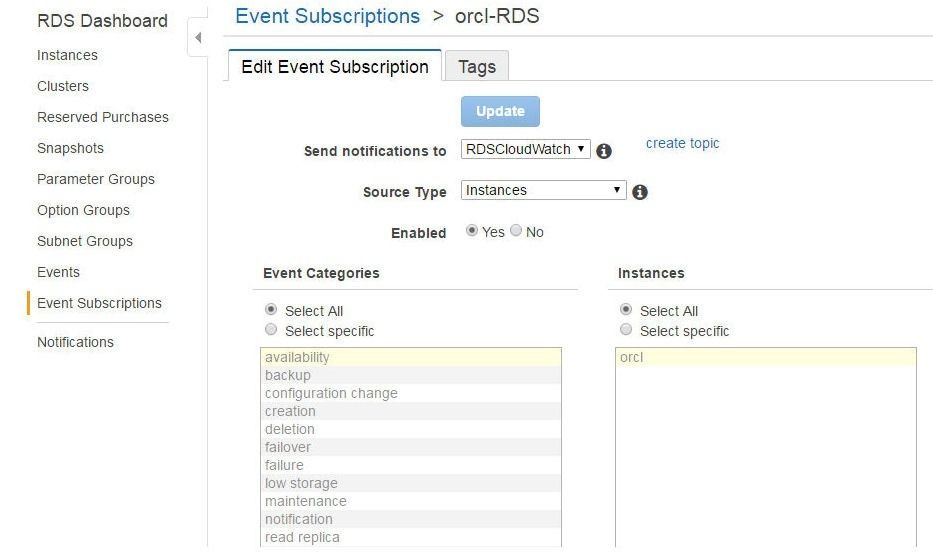
Figure 66. Update Option on Edit Event Subscription Details Page
Accessing RDS Database Log files
The RDS Database Log files include all the logs generated by a database. Click on Logs to access the database logs as shown in Figure 67.
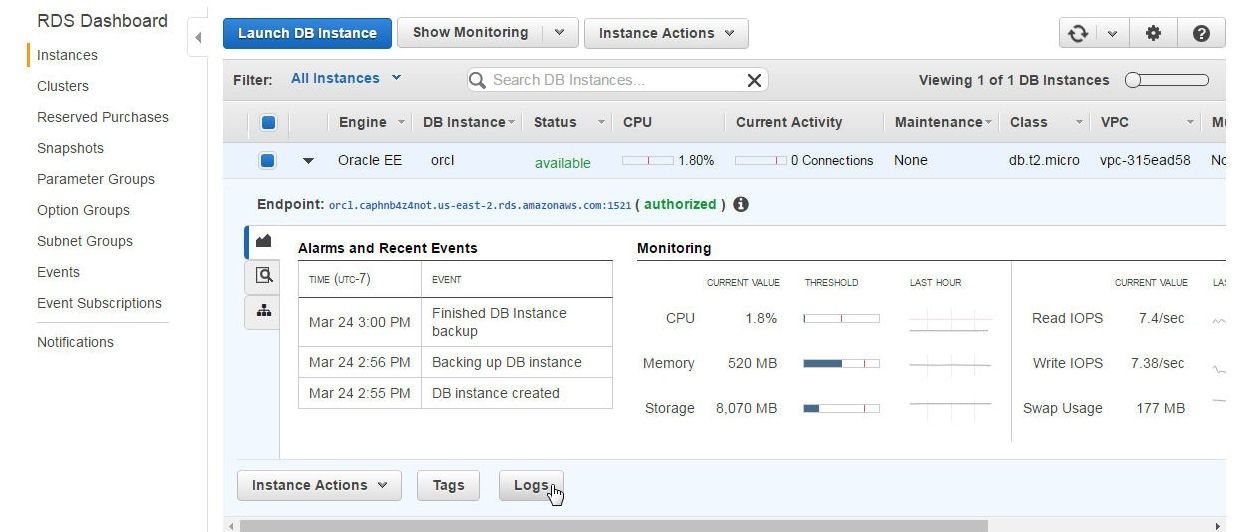
Figure 67. RDS Logs
The various time stamped database logs get listed, as shown in Figure 68. Click on view for a log entry to view the log entry detail as shown in Figure 68.
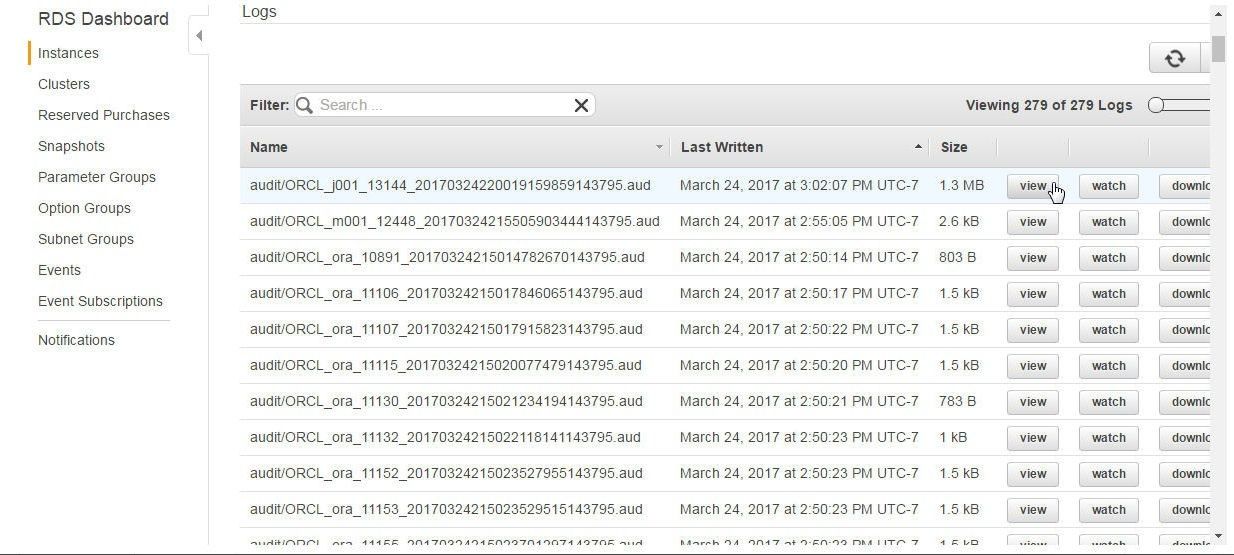
Figure 68. Listing Database Logs
The selected audit/ORCL log file gets displayed, as shown in Figure 69.
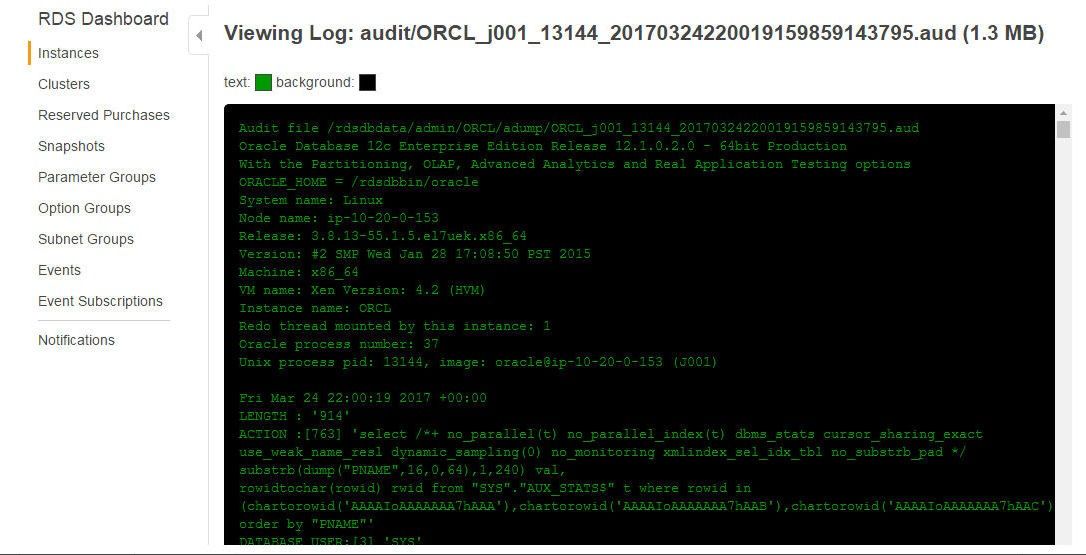
Figure 69. Log file audit/ORCL
The trace/alert_ORCL.log file is also available, as shown in Figure 70.
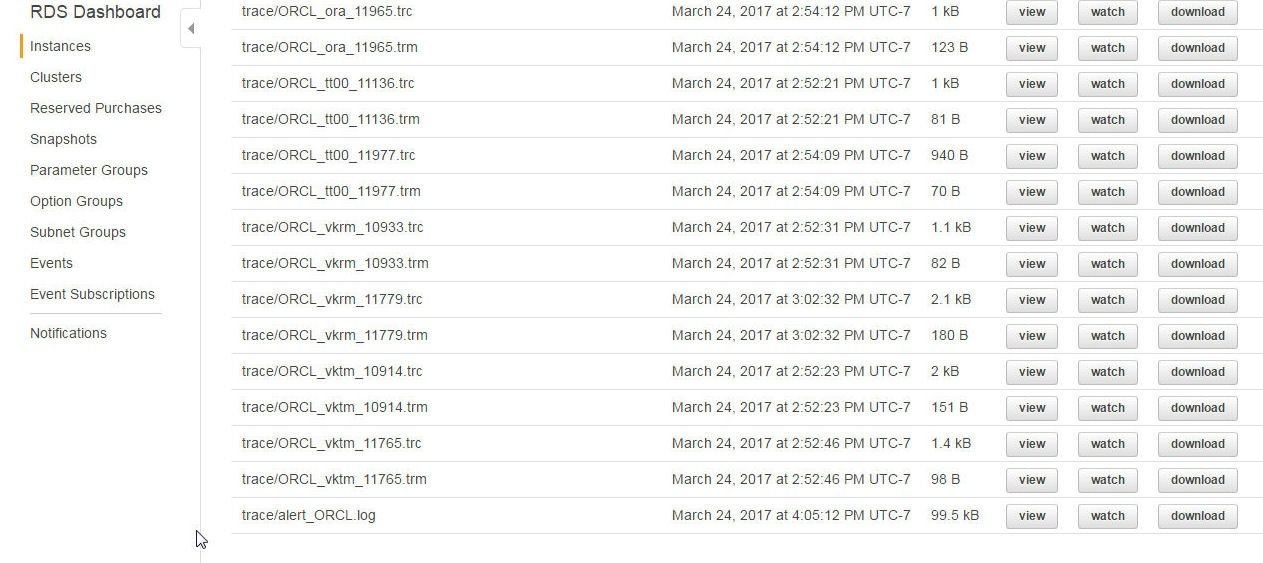
Figure 70. The trace/alert_ORCL.log File
Click on “view” button shown in Figure 70 for the trace/alert_ORCL.log to display the log file shown in Figure 71.
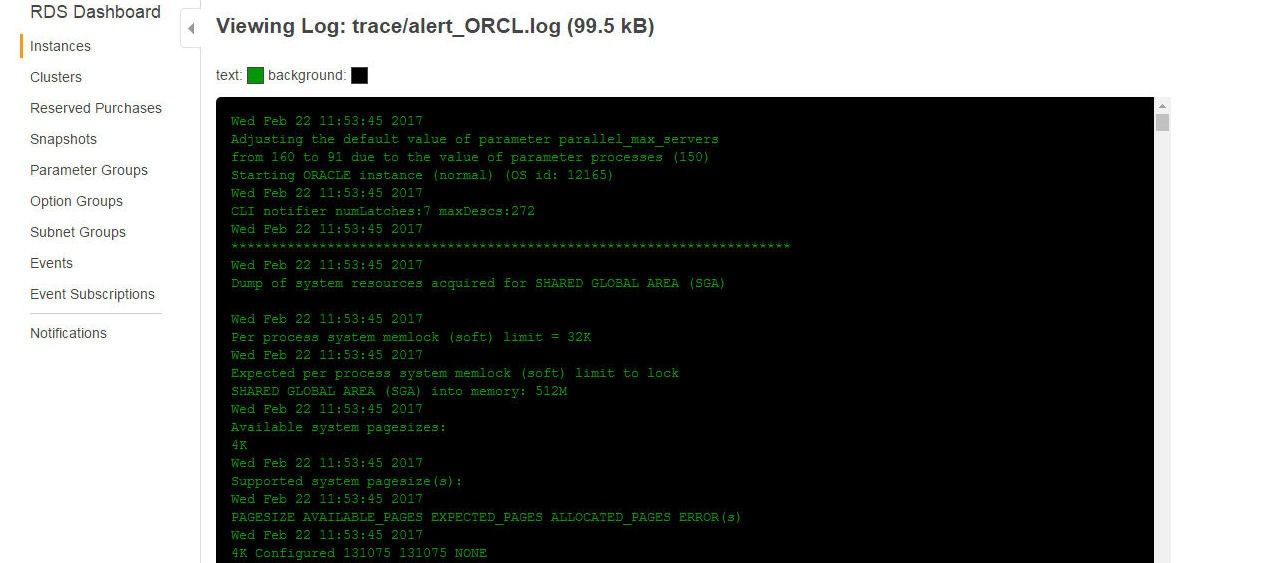
Figure 71. Log File trace/alert_ORCL.log
The Refresh Log button may be used to refresh the trace/alert_ORCL.log log file, as shown in Figure 72.
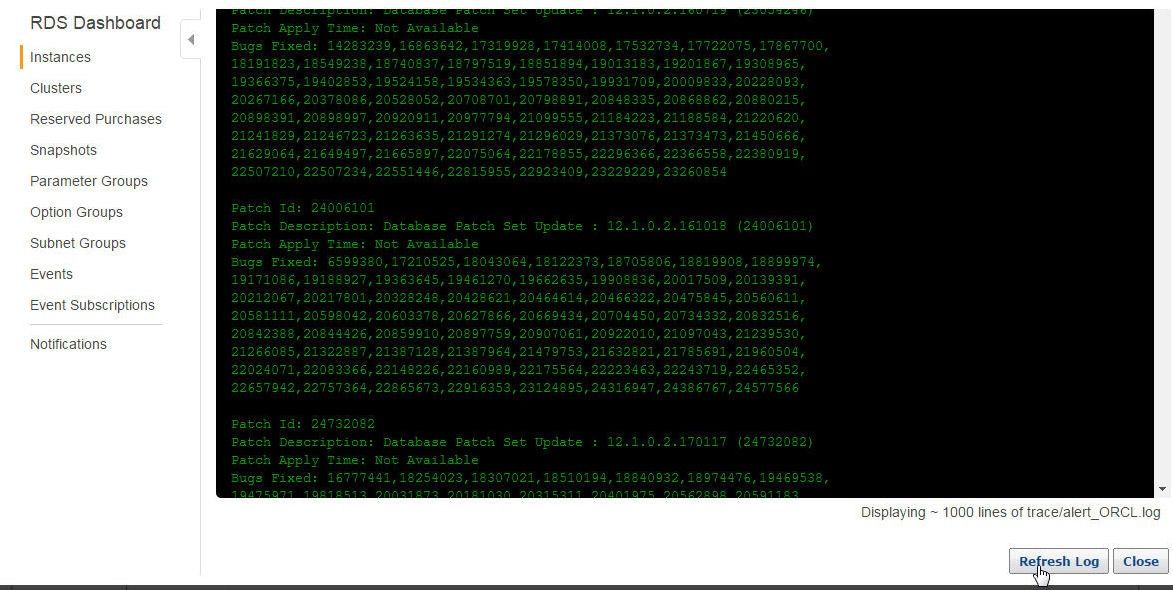
Figure 72. Refresh Log
Monitoring RDS
The Show Monitoring drop-down provides options to Show Multi Graph View, Show Single Graph View, Show Latest Metrics View, and Enhanced Monitoring, as shown in Figure 73.
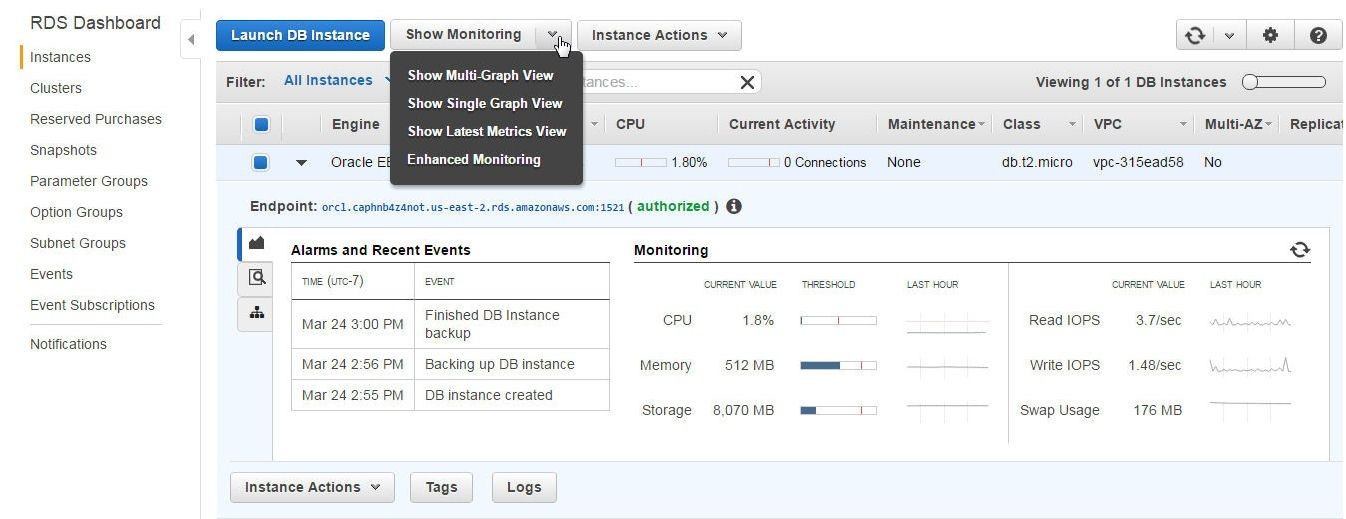
Figure 73. Show Monitoring
The Multi Graph View consists of multiple graphs, one each for CPU Utilization, DB Connections, Free Storage Space, Freeable Memory, Write IOPS, and Read IOPS, as shown in Figure 74.
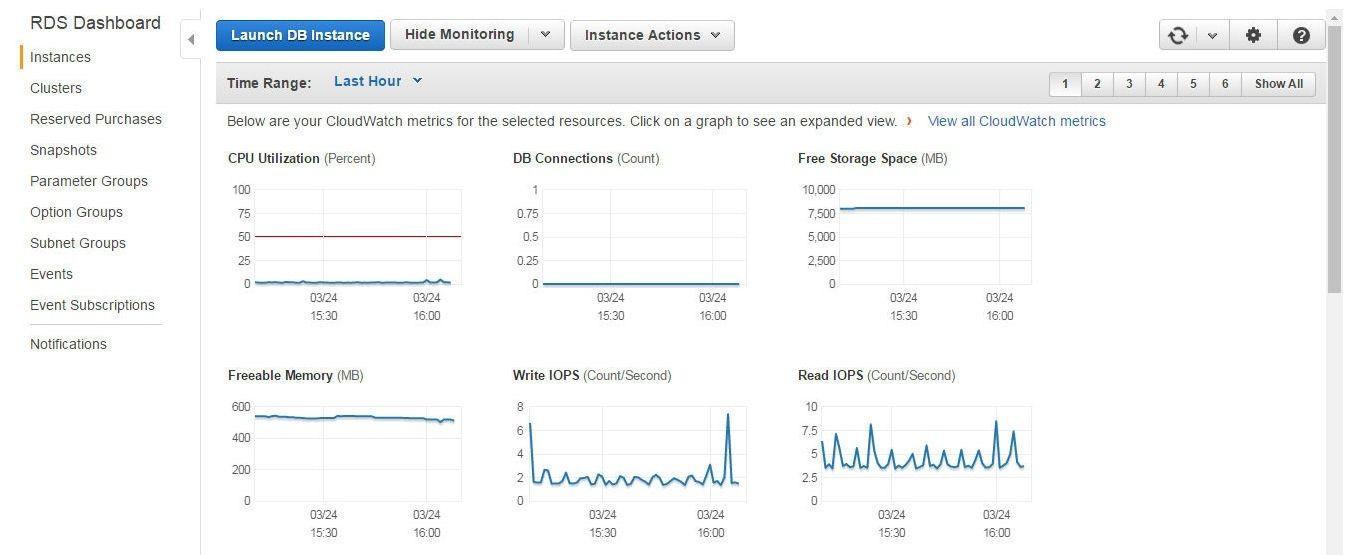
Figure 74. Multi Graph View
The Single Graph View displays the graphs as a single graph for a chosen metric, as shown for CPU Utilization (Percent) in Figure 75.
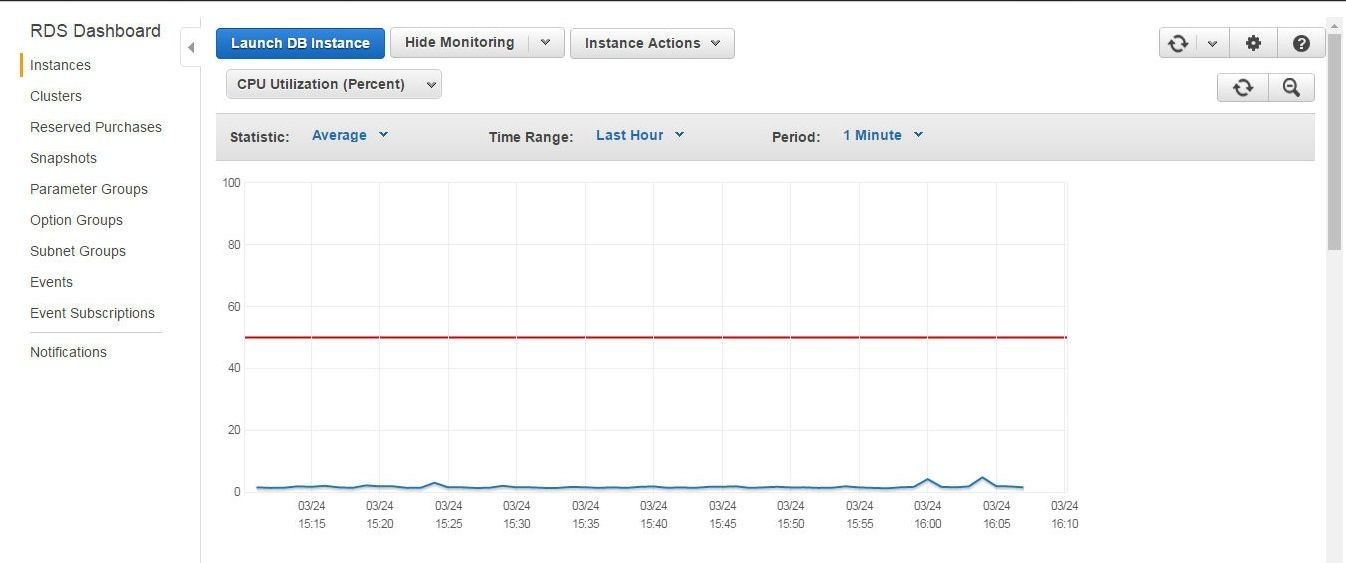
Figure 75. Single Graph View
The Latest Metrics View displays the SQL, System, and Deployment metrics in the selected recent time range, as shown in Figure 76.
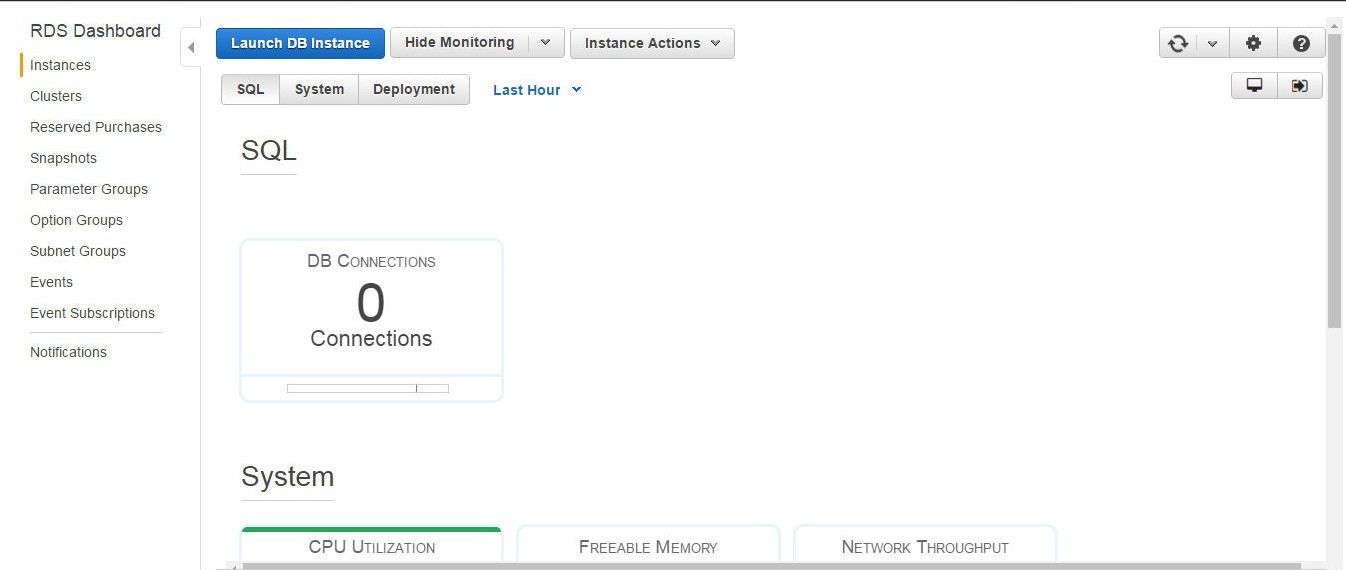
Figure 76. Latest Metrics View>SQL
The System metrics are shown in Figure 77.
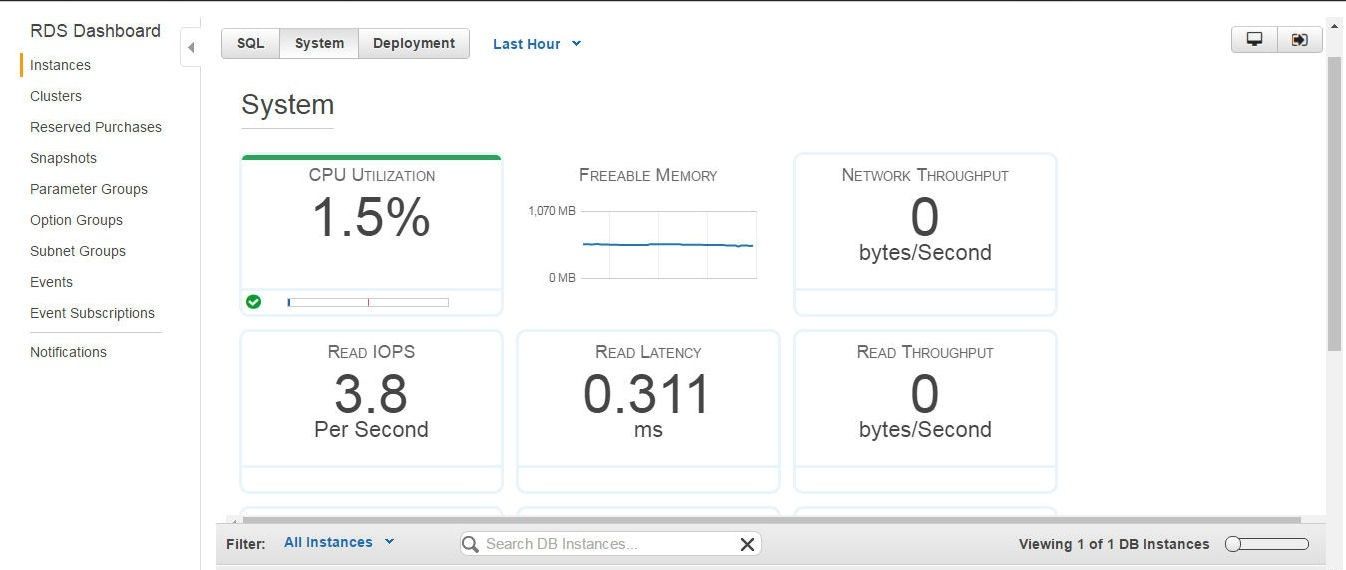
Figure 77. Latest Metrics View>System
Enhanced Monitoring for Oracle Database became available in May 2016 and consists of 56 System metrics and Per Process metrics, and aggregated process information at a granularity of 1 second. Enhanced monitoring is not available for t1.micro and m1.small instance types. Enhanced Monitoring includes a Dashboard, shown in Figure 78, and a Process List.
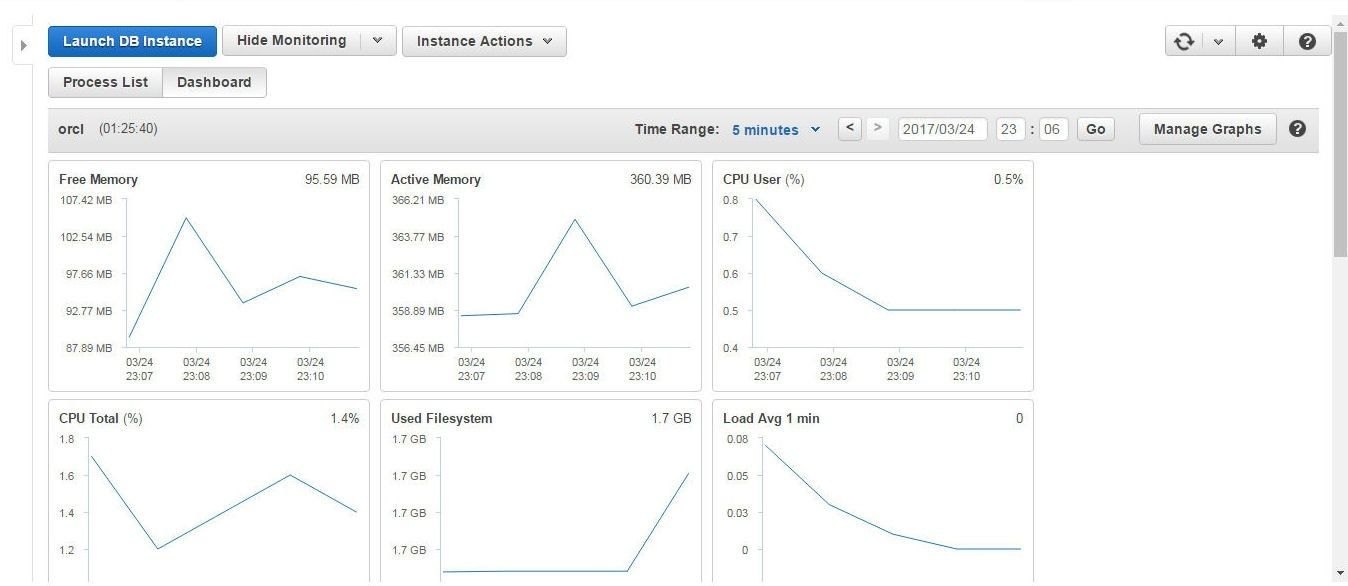
Figure 78. Enhanced Monitoring
In this article we discussed the proactive database management that is provided to an Oracle database instance, or one of the other supported databases, on AWS RDS. The CloudWatch RDS Metrics, CloudWatch Logs, custom CloudWatch Alarms, RDS Events Notification, RDS Database Log files, and RDS Dashboard Monitoring are integrated with RDS and do not require much additional configuration.
Start the discussion at forums.toadworld.com