Hi,
Recursive views present various data dictionary information in a readable form. In Oracle, real-time information can generally be monitored using the V$ dictionary views. Oracle tracks literally everything going on both within the database and with your applications within the database. It’s just a matter of finding the information, and knowing that it exists. There is another set of views that store information, called the DBA_ views. These views are used to track various types of metadata (data about data).
I will discuss how many of these views are used to assist with performance issues. Several of my examples use information from one view as input to another. I will supply useful scripts you can use to track similar issues in your Oracle database.
There are so many different things you can monitor and follow up on using these views, so this article will focus on finding the SQL associated with a particular performance issue. If you can get the SQL and its execution plan, you can generally solve your application performance issues. Sometimes the issue is with the database itself being extremely busy. It is beyond the scope of this article to go into this level of detail but watch for other blog posts and articles from me on finding other database performance issues.
My Top 10 Views (with their related views) will include:
- V$SQL
- V$SQL_AREA
- V$SQL_PLAN
- DBA_HIST_SQLTEXT
- V$SESS_IO
- V$FILESTAT
- V$TABLESPACE
- V$DATAFILE
- V$TEMPSTAT
- V$TABLESPACE
- V$DATAFILE
- V$SYSTEM_EVENT
- V$SESSION_EVENT
- V$SESSION_WAIT
- DBA_EXTENTS
- V$SQL_BIND_CAPTURE
- V$PARAMETER
- V$SGASTAT
- V$SGASTAT
V$SQL
I start with this topic because all performance issues are caused by some kind of application SQL. Sometimes it’s contention (Oracle is not allowed to work), in that poorly designed applications are trying to access/change the same information at the same time. Sometimes it’s I/O problems or just long-running SQL. The SQL needs to be tuned. Going back to contention, it’s amazing how many locking issues simply go away if the offending SQL just runs a little faster.
So, to do SQL tuning, you need explain plans. I have plenty of blog posts on getting execution plans and what the content means. This article will show you how to find the offending SQL, not necessarily what to do about it…maybe we can cover those topics in a future article.
The following two scripts will be useful to get the explain plans for particular offensive SQL, once you have found some or all of the SQL text.
Select plan_table_output
From v$sql s,
table(dbms_xplan.display_cursor(s.sql_id, s.child_number)) t
Where s.sql_text like '%&Enter_SQL_Text%'
This SQL will return the explain plan that the SQL executed with. It will prompt you for partial SQL text.
*** Tip *** I’ve long had an idea that if you can give each SQL a name in a comments field (/* */ after the SELECT, UPDATE, INSERT, DELETE syntax), it would make it easier to use scripts like this to produce the proper explain plans.
Select sql_text
From v$sql_area a, v$sql_plan p
Where a.address = p.address
And p.owner not in (‘SYS’,’SYSTEM’)
And p.operation = ‘TABLE ACCESS’
And p.options like ‘FULL%’;
This SQL will find specific explain plan operations using V$SQL_AREA and V$SQL_PLAN. Adjust the last two lines for the access type and operations you desire to seek. Take the SQL text that is returned, or partial SQL text…and put it into the first query above to find the explain plan. Enhance this SQL by changing the last two lines to prompts.
SQL in the v$SQL area are currently in the library cache.
DBA_HIST_SQLTEXT
Select plan_table_output
From dba_hist_sqltext s,
Table(dbms_xplan.display_cursor(s.sql_id)) t
Where s.sql_text like '%&Enter_SQL_Text%'
This query does the same thing as the first explain plan query above except that it looks into the automated workload repository (AWR)
***Note*** You need to be licensed to look at this information…check with your DBA staff before running this query.
These explain plans are collected and stored for the past seven days.
V$SESS_I
OK, now that we can get explain plans for our offending SQL, let me show you some clever ways of finding the offending SQL.
Of course, you can use Toad or SQL Developers reports showing the Top SQL, top this/top that/etc…but this series will help you track down the SQL causing a particular performance issue.
desc V$sess_io
Name                     Null Type
------------------------ ---- ------
SID                           NUMBER
BLOCK_GETS                    NUMBER
CONSISTENT_GETS               NUMBER
PHYSICAL_READS                NUMBER
BLOCK_CHANGES                 NUMBER
CONSISTENT_CHANGES            NUMBER
OPTIMIZED_PHYSICAL_READS      NUMBER
Using V$SESS_IO, you can get an idea of what kind of ‘working too hard’ problem your SQL is causing.
Block Gets are blocks being changed (lots of DML perhaps). Consistent Gets are logical reads (blocks already in buffer cache), Block Changes (similar to Block Gets…but these are the blocks getting the changes), Consistent Changes (you have readers bumping into long running DML, causing read consistency to kick in…readers and writers bumping into each other…). Physical Reads (getting blocks from tablespaces).
Use this information in the next series to look for the SQL contributing to your performance issue.
V$FILESTAT
select t.name, d.name, d.file# "file#", phyrds, phywrts, phyblkrd, phyblkwrt
from v$tablespace t, v$datafile d, v$filestat s
where d.file# = s.file#
and t.ts# = d.ts#
order by 4 desc;
This information will show physical I/O operations across the tablespaces and their associated data files. Adjust the ORDER BY clause (last line) to have the top I/O operations appear at the top of the report.
select b.name object, a.dbarfil "File#", count(a.dbablk) "Num Blocks", sum(a.tch) "Touch Count"
from x$bh a, obj$ b
where a.obj = b.dataobj#
and a.tch > 0
and a.file# = &file_no
group by b.name, a.dbarfil
order by 4 desc;
Take the file number in the above report as input into this SQL (you have to run this as SYS…be careful out there!!!). This will show you the tables with a lot of I/O on those particular data files.
***Note*** This was a particularly fun exercise for me years ago, to figure out how to see items in the buffer cache!!! The X$BH IS the buffer cache. X$ tables are the underlying Oracle dictionary tables used to run the database. I used V$ view descriptions to help interpret the column and table names in the X$ tables.
Take the table name from this report into the V$SQL or AWR history to get your explain plans. This table name is indeed partial SQL text.
V$TEMPSTAT
Your problem could be that your temporary tablespaces are being used too much. Oracle10g gave us the ability to have tablespace groups with several temporary tablespaces assigned to each group. The group is assigned to the users. As they connect, Oracle RDBMS round-robins assigns them to a temporary tablespace within the group.
***Tip*** I have advocated using some of the newer flash drive technology with these temporary tablespaces. Temporary tablespaces are doing the sorting/group bys/result set storage for larger queries…and have a lot of physical I/O all the time.
select t.name, d.name,s.PHYRDS, s.PHYWRTS, s.PHYBLKRD, s.PHYBLKWRT, dd.logging
from v$tablespace t,v$tempfile d, v$filestat s, dba_tablespaces dd
where d.file# = s.file#
and t.ts# = d.ts#
and dd.contents = 'TEMPORARY'
and dd.TABLESPACE_NAME = t.NAME
order by 1,2;
If you are I/O bound on your temporary tablespaces, simply add more temporary tablespaces…or…use the Temporary Tablespace Groups to help divvy up the I/O operations across physical files.
V$SYSTEM_EVENT
Shifting gears a little, ‘Oracle not allowed to work’ is generally a contention issue. These kinds of performance issues show up pretty quickly using views like V$SYSTEM_EVENT and V$SESSION_EVENT.
select      event,
      total_waits,
      total_timeouts,
      (time_waited / 100) time_waited,
      (average_wait / 100) average_wait
from  sys.v_$system_event
where total_waits > 0
order by time_waited desc;
Wait events are where Oracle logs its time when it’s doing something. These events show up in a number of places including Stats Pack and SQL Trace. What you are looking for are the events with larger numbers, as this shows the time logged on those events by various Oracle processes, and processes your applications are working with.
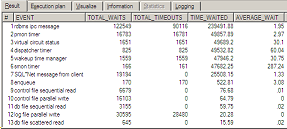
Oracle System Wait Events
It is beyond the scope of this article to discuss wait events. Perhaps another article!?!!??
V$SESSION_EVENT
select      username, event,
      total_waits,
      total_timeouts,
      (time_waited / 100) time_waited,
      (average_wait / 100) average_wait
from  sys.v_$session_event e, v$session s
where e.sid = s.sid
and username IS NOT null
and   total_waits > 0
order by time_waited desc;
This is the same information, except that it has been gathered by connected user. This will probably be more useful information to your SQL and your application issues.
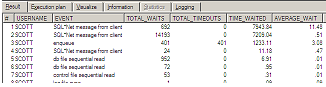
Wait Events by User
In this screen shot, notice the ‘enqueue’ wait event. This indicates a problem with row-level locking. Another user has the data block locked while this user is trying to update it as well. The other user’s SQL is blocking this particular SQL that is getting the enqueue wait event time and causing this particular SQL to wait in a blocked state. Ask me for the blocking SQL information. Toad shows the blocking user as well, to see the SQL that is actually causing the issue. This SQL is paying the price for another SQL that is holding the resource (the lock) too long.
V$SESSION_WAIT
The wait events DB FILE Sequential Read (index or single block reads) and DB FILE Scattered Read (full table scans or fast full index scans) deal with physical reads. These wait events are also logged in V$SESSION_WAIT.
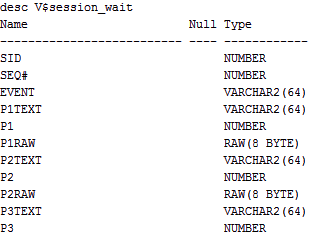
V$SESSION_WAIT
Notice there are P1, P2, and P3 parameters that get populated. When you are dealing with wait events that work with data, P1 is the File number and P2 is the block number of the object working on the wait event. Use these numbers to query DBA_EXTENTS for the object name.
Now, you are back to the original two SQL statements…you have partial SQL text and can look up the SQL in either the library cache (V$SQL) or AWR (seven days of history) and get explain plans.
V$SQL_BIND_CAPTURE
If your offending SQL statement has bind variables, having the data associated with these bind variables is VERY useful in the SQL tuning process.
You take the SQL_ID from your SQL statement and look up the bind variable content that was submitted with your SQL using V$SQL_BIND_CAPTURE. If you have access to AWR, this information is also stored for seven days in DBA_HIST_SQLBIND.
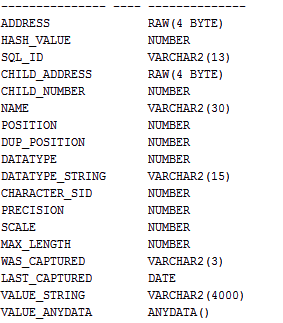
V$SQL_BIND_CAPTURE
The key fields are SQL_ID and VALUE_STRING. The datatype might be of interest depending on how you run your explain plans.
You can also query V$SQL_BIND_DATA.
V$SGASTAT
And finally number 10. I use this query when I need more physical memory; for the buffer cache, perhaps.
This query shows the size and available space in the shared pool; that is mostly the library cache. The library cache holds all the SQL, unless it gets full, then it ages out. This pool used to be rather small but starting in Oracle9, it started growing…and growing. Now, this pool is usually way big and has the potential to share available memory with other processes.
SELECT to_number(p.value) psize, s.bytes fspace, (s.bytes/p.value) * 100 pfree
FROM v$parameter p, v$sgastat s
WHERE p.name = 'shared_pool_size'
AND   s.name = 'free memory'
and   s.pool = 'shared pool'
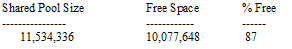
Shared Pool Size
This script is showing me that we have an 11MB shared pool size, of which most is free. If this were a busy system, I’d say there is easily 8MB of space that could be used for other Oracle processes.
Summary
I've just scratched the surface with Oracle Problem Finding. I use a variety of scripts and techniques depending on the type of problem people are having. This article covered finding various issues and tracing the information back to the SQL that is causing the problem. Once you have the offending SQL, you can fix the offending SQL.
Next month I’m writing an article for release here on Toad World about finding problems in the Oracle database. These scripts are actually part of my problem-solving methodology that I use on-site when helping solve Oracle performance issues. I cover all of this material in my SQL performance tuning classes and I simply give away these scripts.
Dan Hotka
Author/Instructor/Oracle Expert
Start the discussion at forums.toadworld.com