In my last couple of blogs for Spotlight on Oracle I have highlighted a couple of features that may not be well known but are very useful. I would like to continue that theme here with another great set of features that can be easy to overlook – the Alarm views.
The Alarm views can be accessed from the Menu bar by selecting View and one of the following – Alarm Log, Alarms By Time or Spotlight Today. These can also be accessed by using the toolbar as shown below.
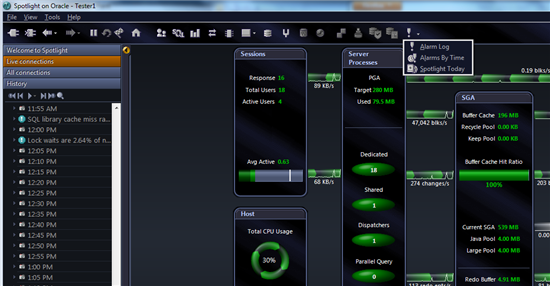
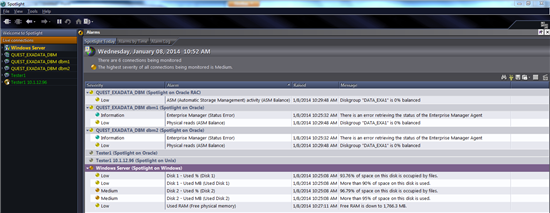
Spotlight Today
This page shows a current view of the active alarms across the different connections that I have set up. There are filters that can be set up so that only certain connections appear here. I can also filter by severity level if for example I only want to see alerts with a severity of medium or high. In the view below, the display is grouped by connections however I can also group by alarms. This can be nice if I want to quickly see which connections might be having high CPU usage or disk space issues.
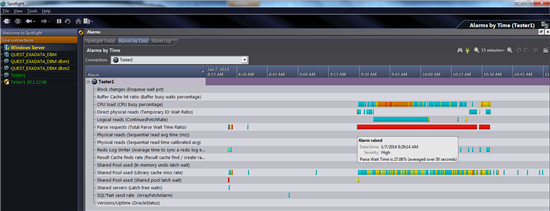
Alarms by Time
As the name suggests, this page shows which alarms have occurred at which times. This can be incredibly useful for tasks such as identifying performance trends or performing a root cause analysis or postmortem for a problem that may have been resolved. Using this view it is easy to see when an alarm was triggered and for how long it persisted. Performing a mouse over of any alarm shows more detail of the alarm.
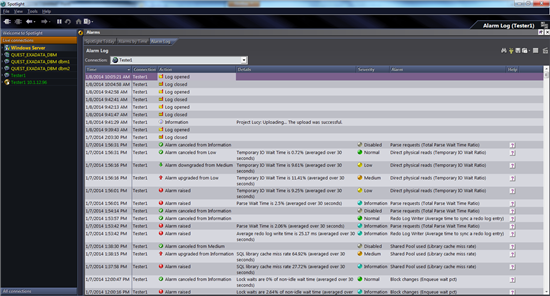
Alarm Log
This screen enables the user to browse through all of the alarms for a single connection or multiple connections. The extra detailed presented here can enable a more precise analysis of how an alarm condition has progressed over time. In the example below, I can see how a Direct physical reads (Temporary IO Wait Ratio) alarm escalated from a low severity to a medium severity and then eventually back to a Normal state.
Start the discussion at forums.toadworld.com