One of the great things about Spotlight is that it's easy to take a quick look at the screen and know immediately if there is a problem that needs your attention. I have had a number of Spotlight users tell me that they like to set up Spotlight on a large monitor in their data center to serve as a central point where someone can walk in and assess the overall status of the environment quickly. There are a couple of features than can be useful when putting Spotlight on display in this fashion.
The first is to put Spotlight into Slideshow mode. This mode rotates the Spotlight display between the open connections. In the Spotlight options, the amount of time between each interval can be configured as well as whether or not to cycle between all connections, the connections with the highest-severity or connections with a severity above a certain threshold. Slideshow mode can also be set to automatically start up when there has been no activity on the console for a certain period.
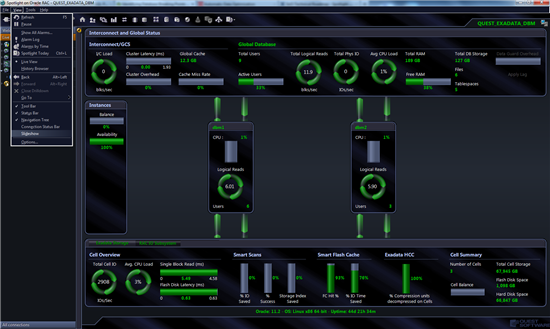
Enabling Slideshow Mode
The other display feature that can be very useful is the Connection Status Bar. This is a free-floating status bar that can be placed outside of the Spotlight application and can serve as a kind of heat map to quickly show connection status for all open connections. It can be configured to display text labels to show the connection names next to the status and also to sort the connections by severity so that connections with higher severity show up on the left hand side.
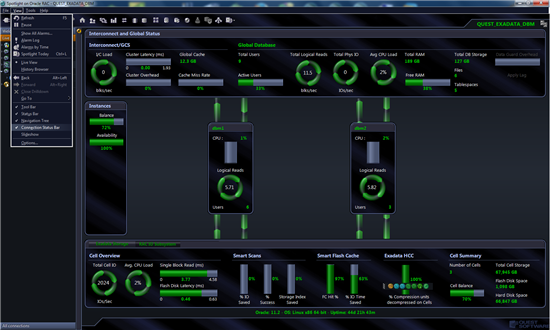
Enabling The Connection Status Bar

The Connection Status Bar
Start the discussion at forums.toadworld.com