If there’s one thing that people ask me it’s “How can I use Toad for Data Analysts to automatically update my Excel report?” I’ll show you how you can get your Excel reports to update from the database in just a few steps – and how you can automate the process!
Step 1: Create your query
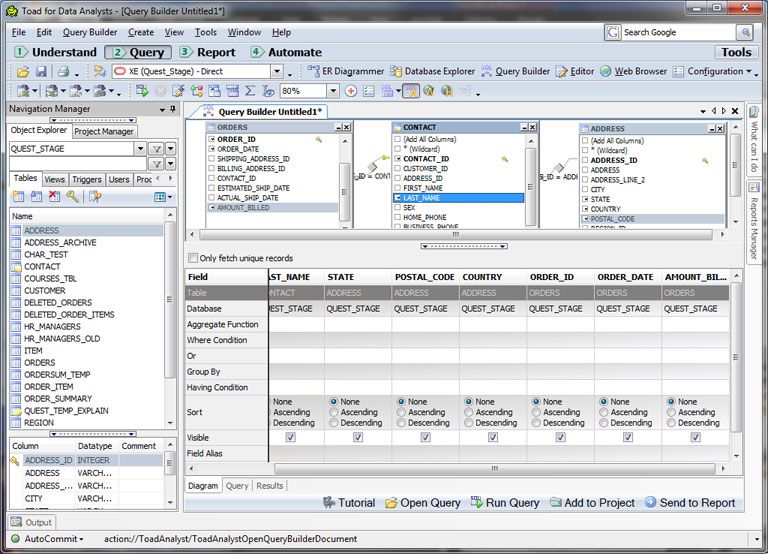
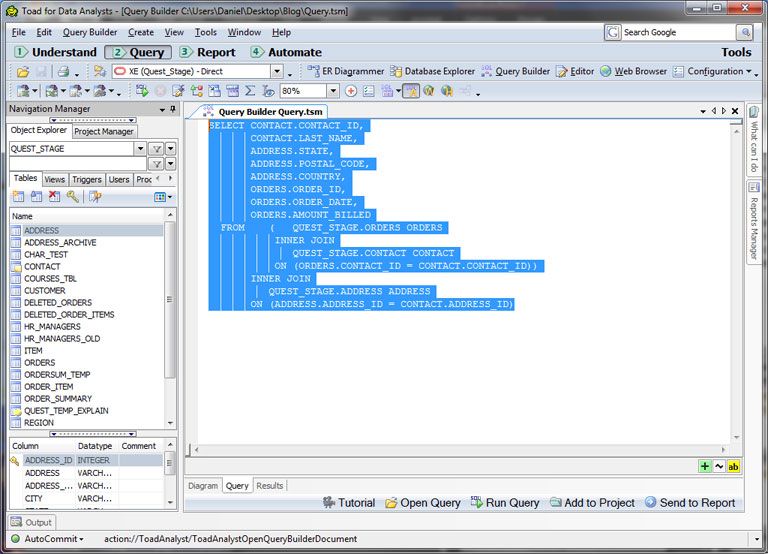
Of course, you’ll need to create your query first (and execute it, optionally). If you already have your query written, skip ahead to step 3. I prefer to use the Query Builder for speed and ease. Assuming you’re already connected to the database you want to query, begin by clicking on the “Query Builder” button on the toolbar. With the new Query Builder file open, simply drag tables/views from the Object Explorer on the left onto the Query Builder. All of the joins will be automatically created for you, assuming the tables are related in the database. If not, you can join your tables/views by dragging one column onto another. Next, simply check the checkboxes for the columns you want included in your query and (optionally) add any grouping or aggregate functions to the columns. When you’re finished, your Query Builder should look something like this:
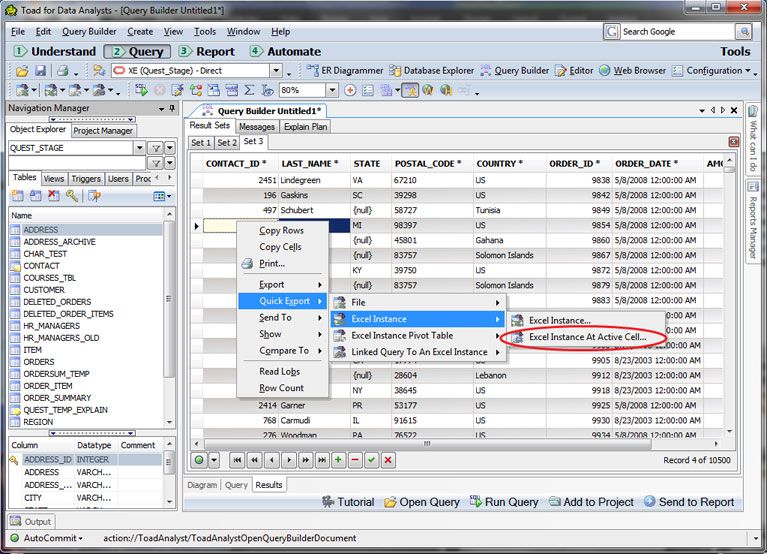
Now that your query is complete, test it out to see if you get the data you’re looking for by clicking “Run Query” on the wizard bar at the bottom. (Alternatively, you can also use the run buttons on the toolbar or F5/F9.) Your results will be shown in the result tab of the Query Builder. You can now group and sort the results or move straight to the export step via the right-click menu, as seen below.
Step 2: Create your Report (if you haven’t already):
In my case, I already have an XLS file created and open on my PC, so I’ve chosen to send the data to that XLS file at the active cell (A:1 on Sheet 2 in this case). Once you export the data, you should see it appear in Excel. (NOTE: make sure you create your report in Excel 2003 format… Toad for Data Analysts doesn’t support the newer 2007 XLSX format – yet! We’re working on it!)
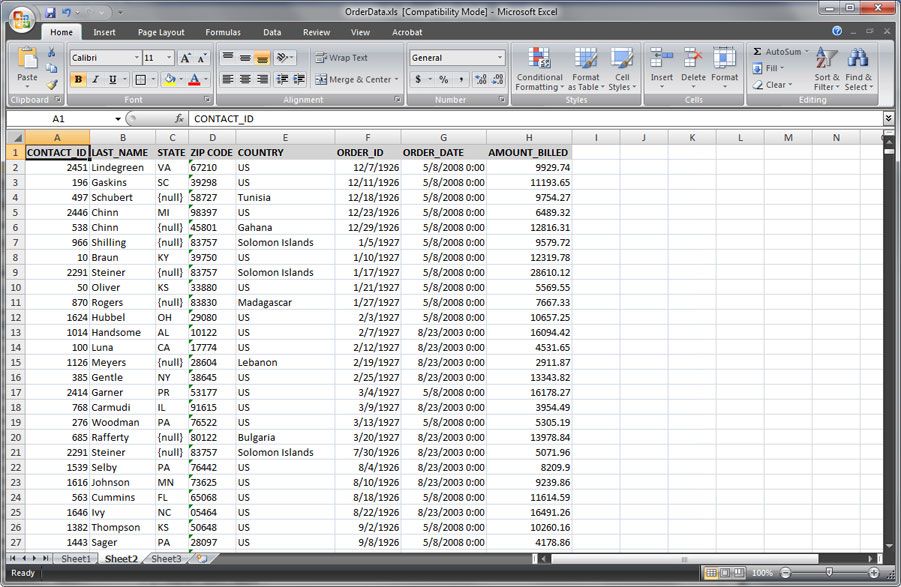
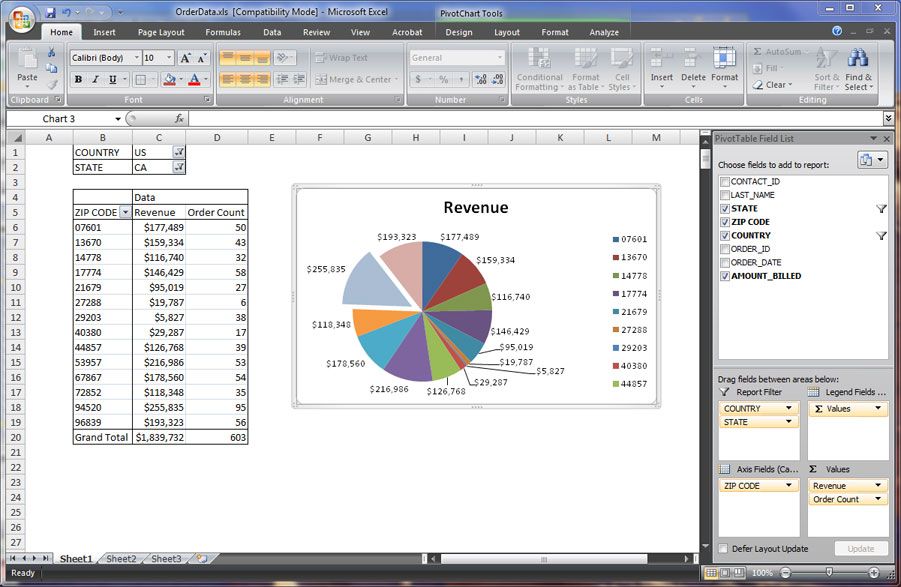
Now, if you haven’t already created your report, definitely do so now. The trick for creating refreshable reports is to make sure your report references data on other sheets and that your range is dynamic. In my case, I never need to add columns, but I know that the number of records will increase or decrease periodically. Thus, when I create my pivot table, I am careful to select my reference data as columns A – H and not a range like A:1 – H:50 (for instance). This way my pivot table will not break if I have more than the pre-set number of rows. In my example, I created a pivot table (from the data in sheet 2) and a chart (based on the pivot table data).
Now that the report is created, lets move to the next step…
Step 3: Getting the data into the report
The best way to do this (on a regular basis) is to use the Export Wizard, which can be found under TOOLS | Export | Export Wizard. This wizard allows you to specify exactly where the data should go. For instance, aside from all of the other export formats, in Excel you can send it to an open instance or a saved file an you can specify exactly which worksheet to use and which cell to begin with! By using the Export Wizard, you can also save its settings as a template and include it in automation. But I’m getting ahead of myself… here’s a screenshot of the Export Wizard where I’m setting the source for the export.
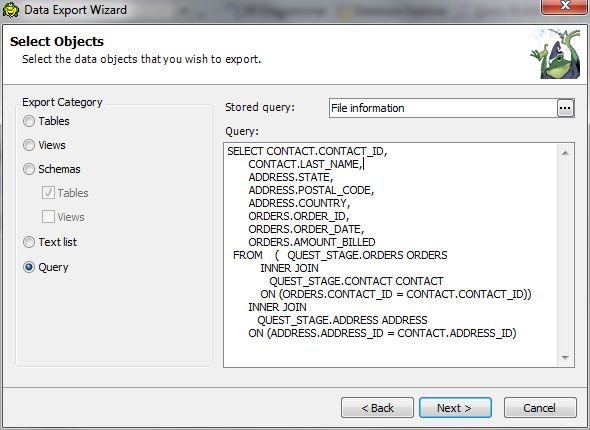
In this case, I’ve pasted the SQL that we generated in our Query Builder. You can see the SQL by selecting the “Query” tab of the Query Builder:
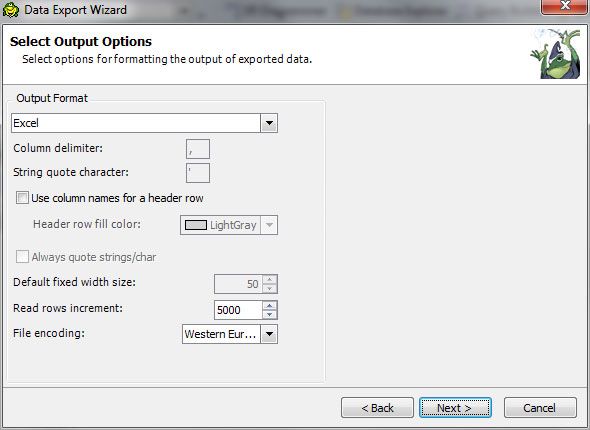
Next, we need to specify Excel as the export format.
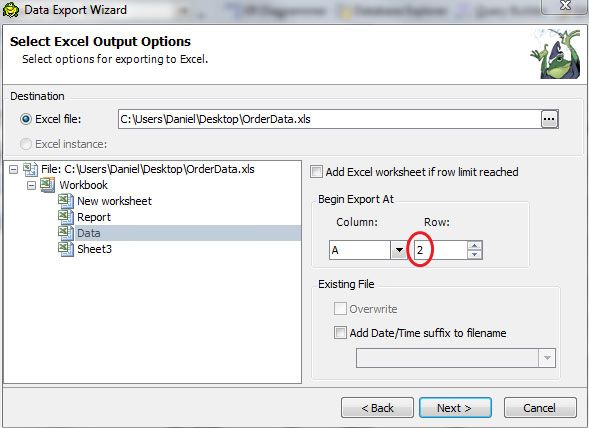
On the next screen, you’ll see options for your Excel output. This is where you can specify the destination file, the worksheet you want to use, and a few other options. In the case of an updateable Excel report like mine, you need to be careful to preserve the header row in your data worksheet. If you overwrite that row, your Excel pivot will be invalid when it refreshes! So, accordingly, I’ve selected to send the data to cell A:2.
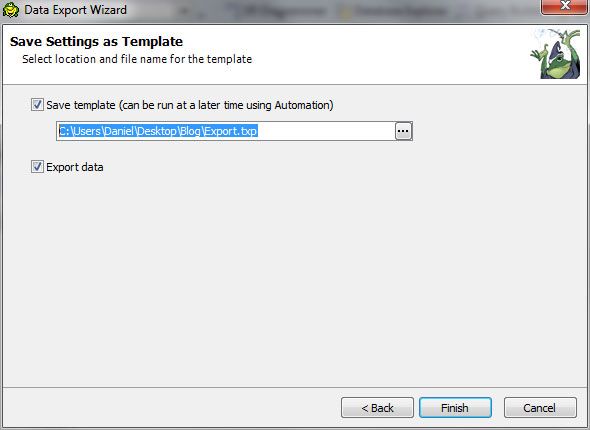
On the next (and final!) screen, you can save the export settings in a template file. Make sure you don’t skip this piece – the template file is what makes automation possible!
Now that the data has been exported, open up the XLS file and refresh your pivot from the right -click menu. You’re in business!
Step 4: Automating the process
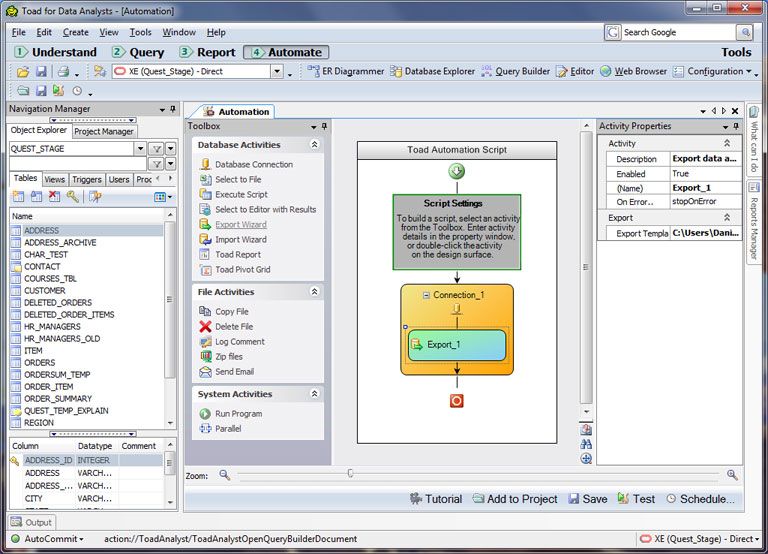
Now, for the Holy Grail… Automation. Once you have your query and you have your report, why should you have to mess with it over and over and over again every time you need to update it. Toad for Data Analysts has a very robust, easy to use automation feature that allows you to graphically link separate steps together into a workflow.
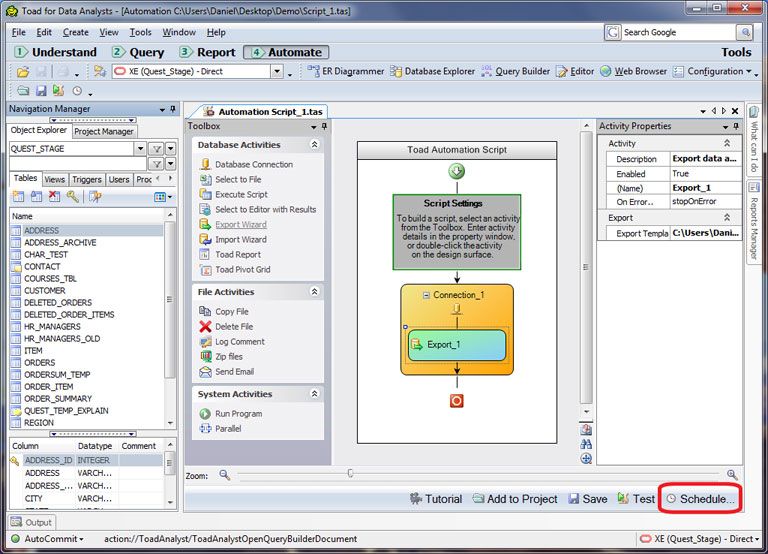
To automate the report update, click on the “4 Automation” button on the toolbar. Next, click on the actions that you want to include in your workflow (on the left-hand side of the window). I created a workflow that does nothing more than open a connection to my database (make sure you save your password!) and execute the Export template that I created earlier. Of course, there are many more things that you can do with the automation feature (like emailing, executing scripts, move/copy files, and more); I’ve just focused on what we need to do for this scenario.
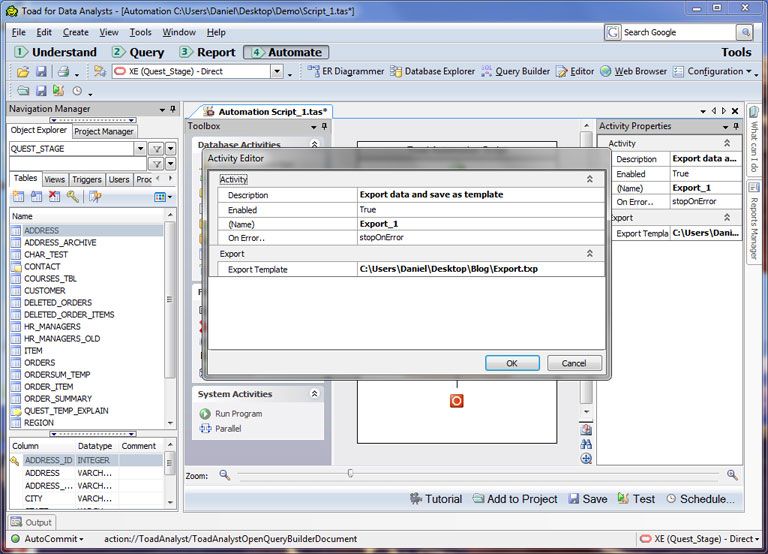
You can see that I’ve pointed to the Export template in my export action below:
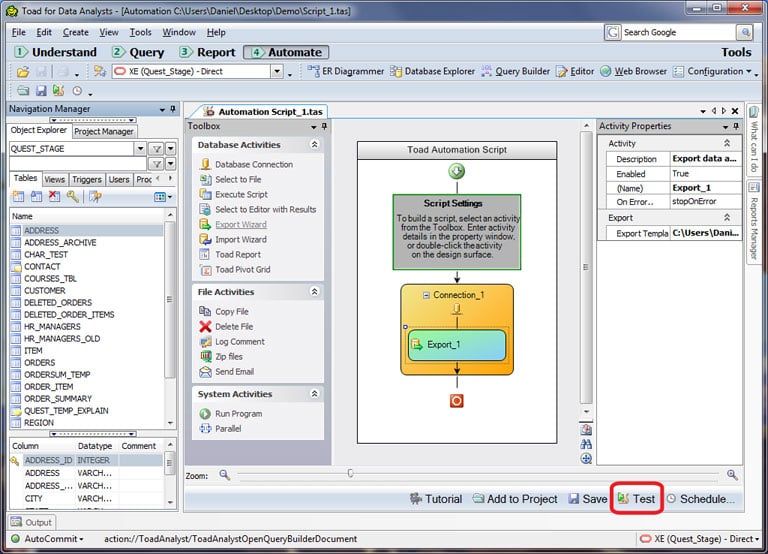
Once you string all of your actions together into a workflow, save and test the workflow by clicking the “Test” button on the wizard bar. (NOTE: this “test” action will actually execute all of the steps in your workflow… make sure you’re prepared to run all of your actions!)
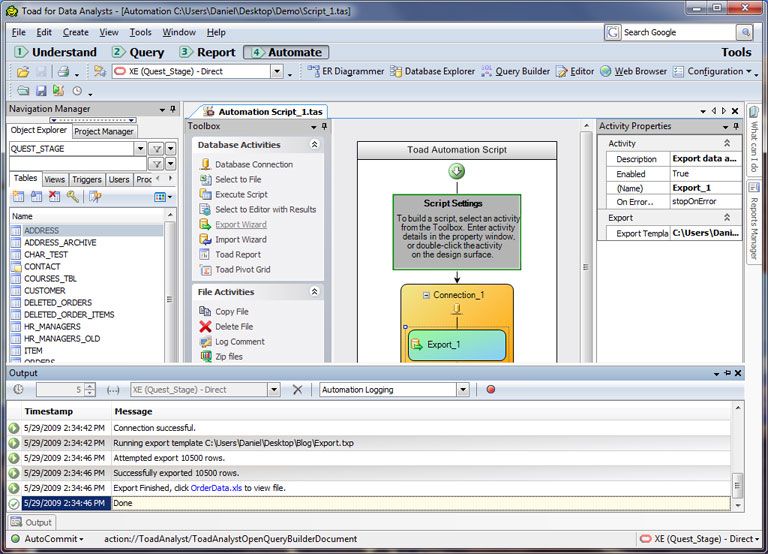
As the automation workflow runs, you can see the discrete actions being executed by Toad for Data Analysts in the Output window (below). This gives you the ability to inspect and verify that your workflow is actually doing what you’ve designed it to do.
Step 5: Schedule it!
Of course, what good is it to have an automation workflow if you have to manually run it every two weeks…? Seems like it defeats the purpose, right!? Once you’ve tested your automation workflow, just click on the “Schedule” button to schedule it with the Windows Scheduler.
Toad for Data Analysts will compile your workflow into a .TAS file and send the command line parameters to the Windows Scheduler for you; all you need to do now is set the execution schedule.
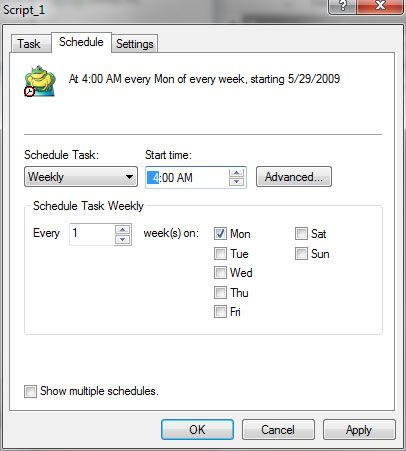
In my case, I’ve set it to run every two weeks on Monday morning at 4:00am. When it executes, Toad for Data Analysts will open up in silent mode, run through my workflow and quietly exit.
Conclusion
So in 5 simple steps we created our query, created our Excel report, specified the export actions, set up an automation workflow and scheduled the workflow to run on a regular basis. In all, this took me about 5 minutes to set up. Of course, I was working with a very simple example, but it demonstrates the power and flexibility of Toad for Data Analysts. I hope that you find this article helpful!
Daniel
Start the discussion at forums.toadworld.com