If you have been in my tuning class or read my tuning blogs, I carry on at length about the importance of reviewing the explain plan with which the SQL executed, not an explain plan because you needed to have one.
The explain plan button on Toad’s main editor screen is just that: an explain plan because you need to have one, and is not the one it executed with.
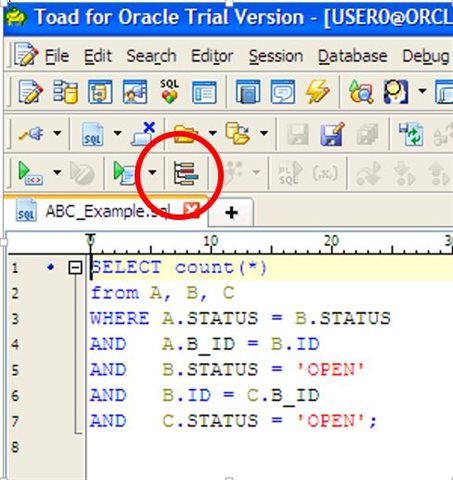
It is, however, easy for Toad to return the actual explain plan with which the SQL executed.
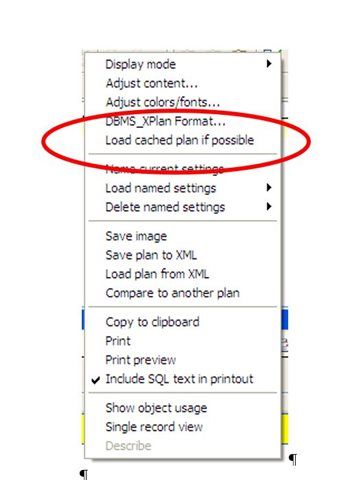
Right click in the explain plan panel and select “Load cached plan if possible.” This will look up the most-recently-executed SQL’s explain plan in the library cache and use that as input to the explain plan panel.
I recommend always keeping this on, as it is the actual explain plan executed.
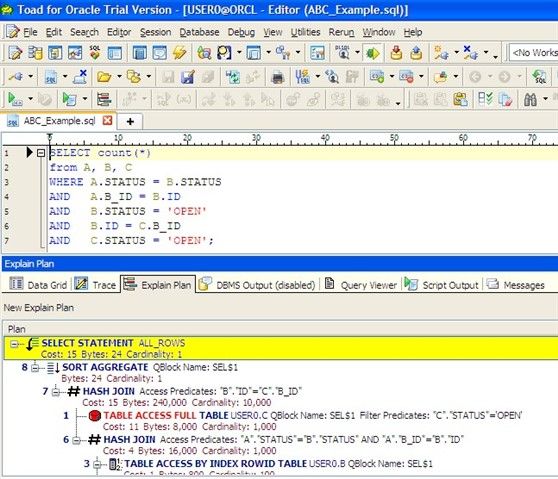
From this point forward, when you execute your SQL, the actual explain plan executed will be populated into the Explain Plan window.
Read my other Toad blogs on tracing, in which I covered how to run a SQL trace, directly from this SQL. That trace file contains the explain plan the SQL executed with along with other useful information.
Start the discussion at forums.toadworld.com